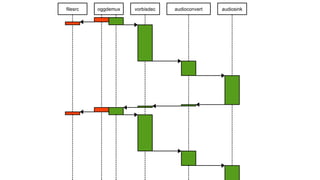
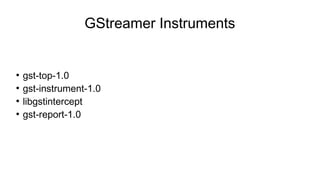
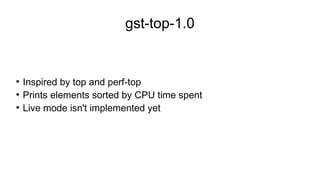
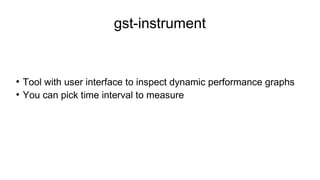
GStreamer Conference 2015
Simple techniques of pipeline performance
measurements and time profiling of individual
elements
Kyrylo Polezhaiev <kirushyk@gmail.com>
github.com/kirushyk
twitter.com/kirushyk
Why it is important to avoid extra work?
●
Less hot laptop
●
Longer battery live
●
Smaller latency
●
More users can be served simultaneously
Optimizations
●
There is a way to improve performance: to do optimizations.
●
This speech is not about optimizations.
●
You can not optimize what you can not measure.
●
You need to know what to focus on.
1 a = get_current_time ();
2 foo ();
3 b = get_current_time ();
4 wasted_time = b – a;
1 a = get_current_thread_time ();
2 foo ();
3 b = get_current_thread_time ();
4 spent_time = b – a;
1 void foo () {
2 foo_stuff ();
3 }
4 void bar () {
5 bar_stuff ();
6 foo ();
7 }
8 void zozolala () {
9 bar ();
10 zozolala_stuff ();
11 }
Time of nested synchronous calls
●
ΔT (foo) = ΔT (foo_stuff) + small overhead
●
ΔT (bar) = ΔT (bar_stuff) + ΔT (foo) + small overhead
●
ΔT (bar) = ΔT (bar_stuff) + ΔT (foo_stuff) + 2 small overheads
●
ΔT (zozolala) = ΔT (zozolala_stuff) + ΔT (bar)
●
ΔT (zozolala) = ΔT (zozolala_stuff) + ΔT (bar_stuff) + ΔT (foo_stuff)
●
ΔT (bar_stuff) = ΔT (bar) – ΔT (foo) – small overhead
filesrc oggdemux vorbisdec audioconvert osxaudiosink
oggdemux → vorbisdec
vorbisdec →
audioconvert
audioconvert →
osxaudiosink
oggdemux
filesrc oggdemux vorbisdec audioconvert audiosink
GStreamer Instruments
●
gst-top-1.0
●
gst-instrument-1.0
●
libgstintercept
●
gst-report-1.0
gst-top-1.0
●
Inspired by top and perf-top
●
Prints elements sorted by CPU time spent
●
Live mode isn't implemented yet
gst-instrument
●
Tool with user interface to inspect dynamic performance graphs
●
You can pick time interval to measure
Under the hood
libgstintercept (to be replaced soon) and gst-report-1.0
libgstintercept
●
.so / .dylib to intercept GStreamer API calls
●
Injected via LD_PRELOAD / DYLD_INSERT_LIBRARIES
●
Dumps every pipeline to tracing file
●
Will be replaced with new tracing infrastructure
API calls to intercept
●
gst_element_change_state
●
gst_pad_push
●
gst_pad_push_list
●
gst_pad_pull_range
●
gst_pad_push_event
●
gst_element_set_state
Problems with tracing
●
Some elements (like x264enc) do not always use GstTasks and
creating their own threads.
●
Inaccurate CPU time measurement: we need to take context
switch into account (to be fixed after moving to new GStreamer
tracing subsystem), have problems with upstack elements and
live pipeline.
gst-report-1.0
●
Reads the trace file and creates performance report
●
Can generate output in dot format
Thank you :-)
Questions?

GStreamer Instruments

  • 1.
    GStreamer Conference 2015 Simpletechniques of pipeline performance measurements and time profiling of individual elements Kyrylo Polezhaiev <kirushyk@gmail.com> github.com/kirushyk twitter.com/kirushyk
  • 2.
    Why it isimportant to avoid extra work? ● Less hot laptop ● Longer battery live ● Smaller latency ● More users can be served simultaneously
  • 3.
    Optimizations ● There is away to improve performance: to do optimizations. ● This speech is not about optimizations. ● You can not optimize what you can not measure. ● You need to know what to focus on.
  • 4.
    1 a =get_current_time (); 2 foo (); 3 b = get_current_time (); 4 wasted_time = b – a;
  • 5.
    1 a =get_current_thread_time (); 2 foo (); 3 b = get_current_thread_time (); 4 spent_time = b – a;
  • 6.
    1 void foo() { 2 foo_stuff (); 3 } 4 void bar () { 5 bar_stuff (); 6 foo (); 7 } 8 void zozolala () { 9 bar (); 10 zozolala_stuff (); 11 } Time of nested synchronous calls ● ΔT (foo) = ΔT (foo_stuff) + small overhead ● ΔT (bar) = ΔT (bar_stuff) + ΔT (foo) + small overhead ● ΔT (bar) = ΔT (bar_stuff) + ΔT (foo_stuff) + 2 small overheads ● ΔT (zozolala) = ΔT (zozolala_stuff) + ΔT (bar) ● ΔT (zozolala) = ΔT (zozolala_stuff) + ΔT (bar_stuff) + ΔT (foo_stuff) ● ΔT (bar_stuff) = ΔT (bar) – ΔT (foo) – small overhead
  • 7.
    filesrc oggdemux vorbisdecaudioconvert osxaudiosink
  • 8.
    oggdemux → vorbisdec vorbisdec→ audioconvert audioconvert → osxaudiosink oggdemux
  • 9.
    filesrc oggdemux vorbisdecaudioconvert audiosink
  • 10.
  • 11.
    gst-top-1.0 ● Inspired by topand perf-top ● Prints elements sorted by CPU time spent ● Live mode isn't implemented yet
  • 12.
    gst-instrument ● Tool with userinterface to inspect dynamic performance graphs ● You can pick time interval to measure
  • 13.
    Under the hood libgstintercept(to be replaced soon) and gst-report-1.0
  • 14.
    libgstintercept ● .so / .dylibto intercept GStreamer API calls ● Injected via LD_PRELOAD / DYLD_INSERT_LIBRARIES ● Dumps every pipeline to tracing file ● Will be replaced with new tracing infrastructure
  • 15.
    API calls tointercept ● gst_element_change_state ● gst_pad_push ● gst_pad_push_list ● gst_pad_pull_range ● gst_pad_push_event ● gst_element_set_state
  • 16.
    Problems with tracing ● Someelements (like x264enc) do not always use GstTasks and creating their own threads. ● Inaccurate CPU time measurement: we need to take context switch into account (to be fixed after moving to new GStreamer tracing subsystem), have problems with upstack elements and live pipeline.
  • 17.
    gst-report-1.0 ● Reads the tracefile and creates performance report ● Can generate output in dot format
  • 18.