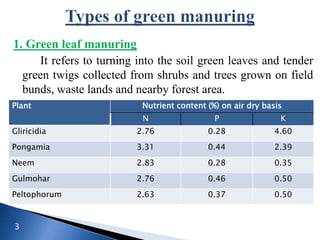
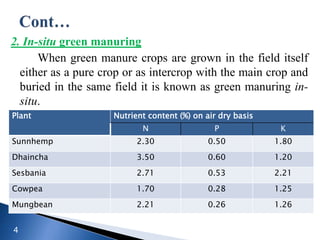
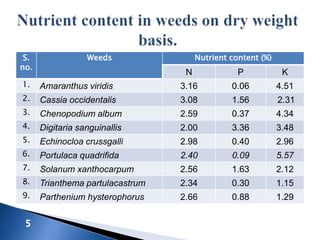
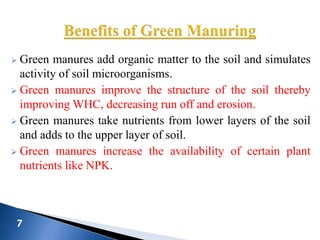
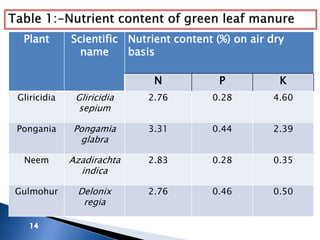
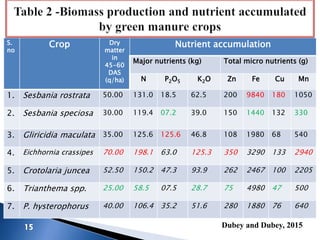
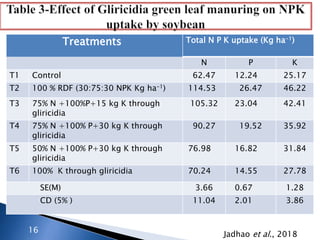
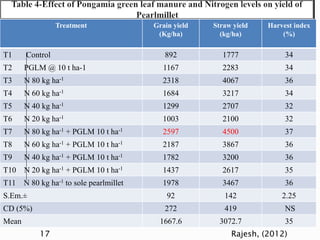
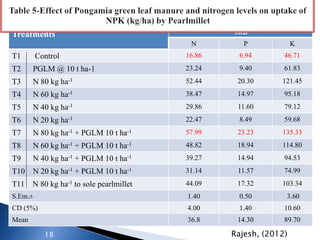
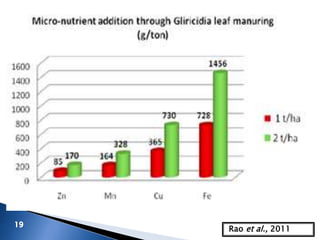
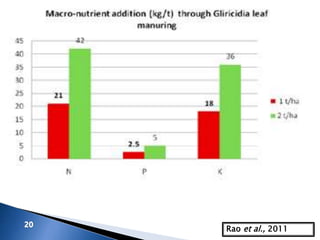
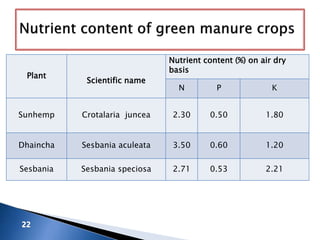
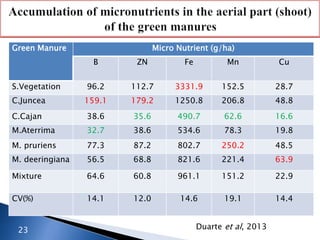
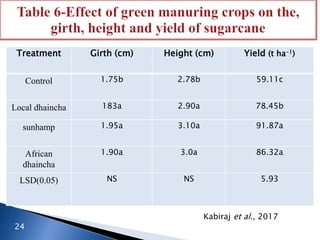
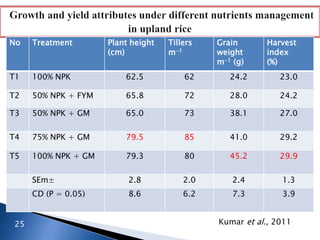
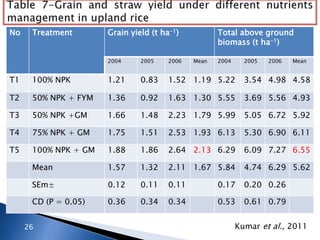
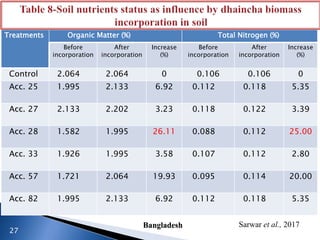
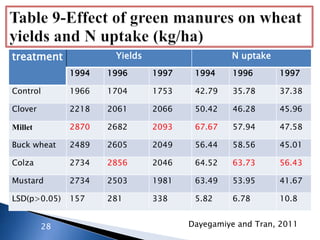
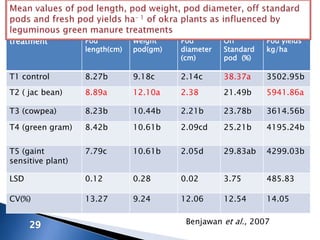
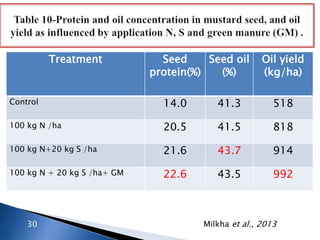
Green Manuring for Sustainable
Agriculture
Bhanuprakash N
2017A12M1
 Green manuring is a part of organic farming which can be
defined as “the practice of enriching the soil fertility by
ploughing under or soil incorporation of any green manure
crops while they are green or soon after they start
flowering.
 Green manuring is considered to be a good management
practice in all agricultural production systems because of
its increasing sustainability of cropping system through
reducing soil erosion.
 The crops that are grown for green manure are called green
manure crops.
2
1. Green leaf manuring
It refers to turning into the soil green leaves and tender
green twigs collected from shrubs and trees grown on field
bunds, waste lands and nearby forest area.
3
Plant Nutrient content (%) on air dry basis
N P K
Gliricidia 2.76 0.28 4.60
Pongamia 3.31 0.44 2.39
Neem 2.83 0.28 0.35
Gulmohar 2.76 0.46 0.50
Peltophorum 2.63 0.37 0.50
2. In-situ green manuring
When green manure crops are grown in the field itself
either as a pure crop or as intercrop with the main crop and
buried in the same field it is known as green manuring in-
situ.
4
Plant Nutrient content (%) on air dry basis
N P K
Sunnhemp 2.30 0.50 1.80
Dhaincha 3.50 0.60 1.20
Sesbania 2.71 0.53 2.21
Cowpea 1.70 0.28 1.25
Mungbean 2.21 0.26 1.26
S.
no.
Weeds Nutrient content (%)
N P K
1. Amaranthus viridis 3.16 0.06 4.51
2. Cassia occidentalis 3.08 1.56 2.31
3. Chenopodium album 2.59 0.37 4.34
4. Digitaria sanguinallis 2.00 3.36 3.48
5. Echinocloa crussgalli 2.98 0.40 2.96
6. Portulaca quadrifida 2.40 0.09 5.57
7. Solanum xanthocarpum 2.56 1.63 2.12
8. Trianthema partulacastrum 2.34 0.30 1.15
9. Parthenium hysterophorus 2.66 0.88 1.29
 Yield a large quantity of green material within a short
period.
 Be quick growing especially in the beginning so as to
suppress weeds.
 Be succulent and have more leafy growth than woody
growth so that its decomposition will be rapid.
 Preferably is a legume.
 Have deep and fibrous root systems.
 Be able to grow even on poor soils.
6
 Green manures add organic matter to the soil and simulates
activity of soil microorganisms.
 Green manures improve the structure of the soil thereby
improving WHC, decreasing run off and erosion.
 Green manures take nutrients from lower layers of the soil
and adds to the upper layer of soil.
 Green manures increase the availability of certain plant
nutrients like NPK.
 Under rainfed conditions, the germination and growth
of succeeding crop may be affected due to depletion of
moisture for the growth and decomposition of green
manuring.
 Green manuring crops inclusive of decomposition
period occupies the field least 75-80 days which means
a loss of one crop.
 Incidence of pests and diseases may increases if the
green manuring is not kept free from them.
8
 Indian soils are deficient in Nitrogen and
Phosphorus and there is hardly any soil
from which yield can be obtained without
fertilization
 Green manure crop should be incorporated into soil at proper
age of crop to get maximum benefit. It should be turned into
soil at flowering stage, which is about 7-8 weeks after sowing.
 Dhaincha attain maximum growth about 8 weeks after sowing,
while sunhemp crop flower aroung 8-10 weeks after sowing.
An 8 week old green manure crop is succulent enough to be
turned into soil for best response under rice.
 Various reports conclude that a green manure crop should be
turned under at 7 to 8 week age, which coincides with
flowering and maximum growth stage for most of the green
manure crops.
 Which green manure crop should be grown (best suited
to the soil and climatic condition)
 When should be grown (time of sowing)
 At what stage it should be buried (time/stage to turned
into soil)
 What should be the time lag between the burying of the
green manure crop and the sowing of the next crop (to
allow decomposition)
12
Research findings
GREEN LEAF MANURING
1313
Plant Scientific
name
Nutrient content (%) on air dry
basis
N P K
Gliricidia Gliricidia
sepium
2.76 0.28 4.60
Pongania Pongamia
glabra
3.31 0.44 2.39
Neem Azadirachta
indica
2.83 0.28 0.35
Gulmohur Delonix
regia
2.76 0.46 0.50
S.
no
Crop Dry
matter
in
45-60
DAS
(q/ha)
Nutrient accumulation
Major nutrients (kg) Total micro nutrients (g)
N P2O5 K2O Zn Fe Cu Mn
1. Sesbania rostrata 50.00 131.0 18.5 62.5 200 9840 180 1050
2. Sesbania speciosa 30.00 119.4 07.2 39.0 150 1440 132 330
3. Gliricidia maculata 35.00 125.6 125.6 46.8 108 1980 68 540
4. Eichhornia crassipes 70.00 198.1 63.0 125.3 350 3290 133 2940
5. Crotolaria juncea 52.50 150.2 47.3 93.9 262 2467 100 2205
6. Trianthema spp. 25.00 58.5 07.5 28.7 75 4980 47 500
7. P. hysterophorus 40.00 106.4 35.2 51.6 280 1880 76 640
Dubey and Dubey, 2015
Treatments Total N P K uptake (Kg ha-1)
N P K
T1 Control 62.47 12.24 25.17
T2 100 % RDF (30:75:30 NPK Kg ha-1) 114.53 26.47 46.22
T3 75% N +100%P+15 kg K through
gliricidia
105.32 23.04 42.41
T4 75% N +100% P+30 kg K through
gliricidia
90.27 19.52 35.92
T5 50% N +100% P+30 kg K through
gliricidia
76.98 16.82 31.84
T6 100% K through gliricidia 70.24 14.55 27.78
SE(M) 3.66 0.67 1.28
CD (5% ) 11.04 2.01 3.86
16
Jadhao et al., 2018
Treatment Grain yield
(Kg/ha)
Straw yield
(kg/ha)
Harvest index
(%)
T1 Control 892 1777 34
T2 PGLM @ 10 t ha-1 1167 2283 34
T3 N 80 kg ha-1 2318 4067 36
T4 N 60 kg ha-1 1684 3217 34
T5 N 40 kg ha-1 1299 2707 32
T6 N 20 kg ha-1 1003 2100 32
T7 N 80 kg ha-1 + PGLM 10 t ha-1 2597 4500 37
T8 N 60 kg ha-1 + PGLM 10 t ha-1 2187 3867 36
T9 N 40 kg ha-1 + PGLM 10 t ha-1 1782 3200 36
T10 N 20 kg ha-1 + PGLM 10 t ha-1 1437 2617 35
T11 N 80 kg ha-1 to sole pearlmillet 1978 3467 36
S.Em.± 92 142 2.25
CD (5%) 272 419 NS
Mean 1667.6 3072.7 35
Rajesh, (2012)17
Treatments Total
N P K
T1 Control 16.86 6.94 46.71
T2 PGLM @ 10 t ha-1 23.24 9.40 61.83
T3 N 80 kg ha-1 52.44 20.30 121.45
T4 N 60 kg ha-1 38.47 14.97 95.18
T5 N 40 kg ha-1 29.86 11.60 79.12
T6 N 20 kg ha-1 22.47 8.49 59.68
T7 N 80 kg ha-1 + PGLM 10 t ha-1 57.99 23.23 135.33
T8 N 60 kg ha-1 + PGLM 10 t ha-1 48.82 18.94 114.80
T9 N 40 kg ha-1 + PGLM 10 t ha-1 39.27 14.94 94.53
T10 N 20 kg ha-1 + PGLM 10 t ha-1 31.14 11.57 74.99
T11 N 80 kg ha-1 to sole pearlmillet 44.09 17.32 103.34
S.Em.± 1.40 0.50 3.60
CD (5%) 4.00 1.40 10.60
Mean 36.8 14.30 89.70
18 Rajesh, (2012)
Rao et al., 2011
Rao et al., 2011
In-situ green manuring
2121
Plant
Scientific name
Nutrient content (%) on air dry
basis
N P K
Sunhemp Crotalaria juncea 2.30 0.50 1.80
Dhaincha Sesbania aculeata 3.50 0.60 1.20
Sesbania Sesbania speciosa 2.71 0.53 2.21
Duarte et al, 201323
Green Manure Micro Nutrient (g/ha)
B ZN Fe Mn Cu
S.Vegetation 96.2 112.7 3331.9 152.5 28.7
C.Juncea 159.1 179.2 1250.8 206.8 48.8
C.Cajan 38.6 35.6 490.7 62.6 16.6
M.Aterrima 32.7 38.6 534.6 78.3 19.8
M. pruriens 77.3 87.2 802.7 250.2 48.5
M. deeringiana 56.5 68.8 821.6 221.4 63.9
Mixture 64.6 60.8 961.1 151.2 22.9
CV(%) 14.1 12.0 14.6 19.1 14.4
Treatment Girth (cm) Height (cm) Yield (t ha-1)
Control 1.75b 2.78b 59.11c
Local dhaincha 183a 2.90a 78.45b
sunhamp 1.95a 3.10a 91.87a
African
dhaincha
1.90a 3.0a 86.32a
LSD(0.05) NS NS 5.93
Kabiraj et al., 2017
24
No Treatment Plant height
(cm)
Tillers
m-1
Grain
weight
m-1 (g)
Harvest
index
(%)
T1 100% NPK 62.5 62 24.2 23.0
T2 50% NPK + FYM 65.8 72 28.0 24.2
T3 50% NPK + GM 65.0 73 38.1 27.0
T4 75% NPK + GM 79.5 85 41.0 29.2
T5 100% NPK + GM 79.3 80 45.2 29.9
SEm± 2.8 2.0 2.4 1.3
CD (P = 0.05) 8.6 6.2 7.3 3.9
Kumar et al., 201125
No Treatment Grain yield (t ha-1) Total above ground
biomass (t ha-1)
2004 2005 2006 Mean 2004 2005 2006 Mean
T1 100% NPK 1.21 0.83 1.52 1.19 5.22 3.54 4.98 4.58
T2 50% NPK + FYM 1.36 0.92 1.63 1.30 5.55 3.69 5.56 4.93
T3 50% NPK +GM 1.66 1.48 2.23 1.79 5.99 5.05 6.72 5.92
T4 75% NPK + GM 1.75 1.51 2.53 1.93 6.13 5.30 6.90 6.11
T5 100% NPK + GM 1.88 1.86 2.64 2.13 6.29 6.09 7.27 6.55
Mean 1.57 1.32 2.11 1.67 5.84 4.74 6.29 5.62
SEm± 0.12 0.11 0.11 0.17 0.20 0.26
CD (P = 0.05) 0.36 0.34 0.34 0.53 0.61 0.79
26 Kumar et al., 2011
Treatments Organic Matter (%) Total Nitrogen (%)
Before
incorporation
After
incorporation
Increase
(%)
Before
incorporation
After
incorporation
Increase
(%)
Control 2.064 2.064 0 0.106 0.106 0
Acc. 25 1.995 2.133 6.92 0.112 0.118 5.35
Acc. 27 2.133 2.202 3.23 0.118 0.122 3.39
Acc. 28 1.582 1.995 26.11 0.088 0.112 25.00
Acc. 33 1.926 1.995 3.58 0.107 0.112 2.80
Acc. 57 1.721 2.064 19.93 0.095 0.114 20.00
Acc. 82 1.995 2.133 6.92 0.112 0.118 5.35
27
Sarwar et al., 2017Bangladesh
treatment Yields N uptake
1994 1996 1997 1994 1996 1997
Control 1966 1704 1753 42.79 35.78 37.38
Clover 2218 2061 2066 50.42 46.28 45.96
Millet 2870 2682 2093 67.67 57.94 47.58
Buck wheat 2489 2605 2049 56.44 58.56 45.01
Colza 2734 2856 2046 64.52 63.73 56.43
Mustard 2734 2503 1981 63.49 53.95 41.67
LSD(p>0.05) 157 281 338 5.82 6.78 10.8
28 Dayegamiye and Tran, 2011
treatment Pod
length(cm)
Weight
pod(gm)
Pod
diameter
(cm)
Off
Standard
pod (%)
Pod yields
kg/ha
T1 control 8.27b 9.18c 2.14c 38.37a 3502.95b
T2 ( jac bean) 8.89a 12.10a 2.38 21.49b 5941.86a
T3 (cowpea) 8.23b 10.44b 2.21b 23.78b 3614.56b
T4 (green gram) 8.42b 10.61b 2.09cd 25.21b 4195.24b
T5 (gaint
sensitive plant)
7.79c 10.61b 2.05d 29.83ab 4299.03b
LSD 0.12 0.28 0.02 3.75 485.83
CV(%) 13.27 9.24 12.06 12.54 14.05
Benjawan et al., 2007
Treatment Seed
protein(%)
Seed oil
(%)
Oil yield
(kg/ha)
Control 14.0 41.3 518
100 kg N /ha 20.5 41.5 818
100 kg N+20 kg S /ha 21.6 43.7 914
100 kg N + 20 kg S /ha+ GM 22.6 43.5 992
30 Milkha et al., 2013
 Green manuring technology is gaining importance due to
increasing emphasis on soil health, minimize environmental
pollution and cut down the use of chemical in agriculture.
 Application of green manure crops supplements the
chemical fertilizers and restores soil fertility. Therefore, it is
an eco-friendly low cost technology to conserve the natural
resources besides maintaining environmental quality in a
sustainable manner
 By raising or incorporation of green and green leaf manures
the soil fertility can be improved
 low cost practice and an alternate way to improve soil
fertility status.
31
32
THANK YOU

Green manuring

  • 1.
    Green Manuring forSustainable Agriculture Bhanuprakash N 2017A12M1
  • 2.
     Green manuringis a part of organic farming which can be defined as “the practice of enriching the soil fertility by ploughing under or soil incorporation of any green manure crops while they are green or soon after they start flowering.  Green manuring is considered to be a good management practice in all agricultural production systems because of its increasing sustainability of cropping system through reducing soil erosion.  The crops that are grown for green manure are called green manure crops. 2
  • 3.
    1. Green leafmanuring It refers to turning into the soil green leaves and tender green twigs collected from shrubs and trees grown on field bunds, waste lands and nearby forest area. 3 Plant Nutrient content (%) on air dry basis N P K Gliricidia 2.76 0.28 4.60 Pongamia 3.31 0.44 2.39 Neem 2.83 0.28 0.35 Gulmohar 2.76 0.46 0.50 Peltophorum 2.63 0.37 0.50
  • 4.
    2. In-situ greenmanuring When green manure crops are grown in the field itself either as a pure crop or as intercrop with the main crop and buried in the same field it is known as green manuring in- situ. 4 Plant Nutrient content (%) on air dry basis N P K Sunnhemp 2.30 0.50 1.80 Dhaincha 3.50 0.60 1.20 Sesbania 2.71 0.53 2.21 Cowpea 1.70 0.28 1.25 Mungbean 2.21 0.26 1.26
  • 5.
    S. no. Weeds Nutrient content(%) N P K 1. Amaranthus viridis 3.16 0.06 4.51 2. Cassia occidentalis 3.08 1.56 2.31 3. Chenopodium album 2.59 0.37 4.34 4. Digitaria sanguinallis 2.00 3.36 3.48 5. Echinocloa crussgalli 2.98 0.40 2.96 6. Portulaca quadrifida 2.40 0.09 5.57 7. Solanum xanthocarpum 2.56 1.63 2.12 8. Trianthema partulacastrum 2.34 0.30 1.15 9. Parthenium hysterophorus 2.66 0.88 1.29
  • 6.
     Yield alarge quantity of green material within a short period.  Be quick growing especially in the beginning so as to suppress weeds.  Be succulent and have more leafy growth than woody growth so that its decomposition will be rapid.  Preferably is a legume.  Have deep and fibrous root systems.  Be able to grow even on poor soils. 6
  • 7.
     Green manuresadd organic matter to the soil and simulates activity of soil microorganisms.  Green manures improve the structure of the soil thereby improving WHC, decreasing run off and erosion.  Green manures take nutrients from lower layers of the soil and adds to the upper layer of soil.  Green manures increase the availability of certain plant nutrients like NPK.
  • 8.
     Under rainfedconditions, the germination and growth of succeeding crop may be affected due to depletion of moisture for the growth and decomposition of green manuring.  Green manuring crops inclusive of decomposition period occupies the field least 75-80 days which means a loss of one crop.  Incidence of pests and diseases may increases if the green manuring is not kept free from them. 8
  • 9.
     Indian soilsare deficient in Nitrogen and Phosphorus and there is hardly any soil from which yield can be obtained without fertilization
  • 10.
     Green manurecrop should be incorporated into soil at proper age of crop to get maximum benefit. It should be turned into soil at flowering stage, which is about 7-8 weeks after sowing.  Dhaincha attain maximum growth about 8 weeks after sowing, while sunhemp crop flower aroung 8-10 weeks after sowing. An 8 week old green manure crop is succulent enough to be turned into soil for best response under rice.  Various reports conclude that a green manure crop should be turned under at 7 to 8 week age, which coincides with flowering and maximum growth stage for most of the green manure crops.
  • 11.
     Which greenmanure crop should be grown (best suited to the soil and climatic condition)  When should be grown (time of sowing)  At what stage it should be buried (time/stage to turned into soil)  What should be the time lag between the burying of the green manure crop and the sowing of the next crop (to allow decomposition)
  • 12.
  • 13.
  • 14.
    Plant Scientific name Nutrient content(%) on air dry basis N P K Gliricidia Gliricidia sepium 2.76 0.28 4.60 Pongania Pongamia glabra 3.31 0.44 2.39 Neem Azadirachta indica 2.83 0.28 0.35 Gulmohur Delonix regia 2.76 0.46 0.50
  • 15.
    S. no Crop Dry matter in 45-60 DAS (q/ha) Nutrient accumulation Majornutrients (kg) Total micro nutrients (g) N P2O5 K2O Zn Fe Cu Mn 1. Sesbania rostrata 50.00 131.0 18.5 62.5 200 9840 180 1050 2. Sesbania speciosa 30.00 119.4 07.2 39.0 150 1440 132 330 3. Gliricidia maculata 35.00 125.6 125.6 46.8 108 1980 68 540 4. Eichhornia crassipes 70.00 198.1 63.0 125.3 350 3290 133 2940 5. Crotolaria juncea 52.50 150.2 47.3 93.9 262 2467 100 2205 6. Trianthema spp. 25.00 58.5 07.5 28.7 75 4980 47 500 7. P. hysterophorus 40.00 106.4 35.2 51.6 280 1880 76 640 Dubey and Dubey, 2015
  • 16.
    Treatments Total NP K uptake (Kg ha-1) N P K T1 Control 62.47 12.24 25.17 T2 100 % RDF (30:75:30 NPK Kg ha-1) 114.53 26.47 46.22 T3 75% N +100%P+15 kg K through gliricidia 105.32 23.04 42.41 T4 75% N +100% P+30 kg K through gliricidia 90.27 19.52 35.92 T5 50% N +100% P+30 kg K through gliricidia 76.98 16.82 31.84 T6 100% K through gliricidia 70.24 14.55 27.78 SE(M) 3.66 0.67 1.28 CD (5% ) 11.04 2.01 3.86 16 Jadhao et al., 2018
  • 17.
    Treatment Grain yield (Kg/ha) Strawyield (kg/ha) Harvest index (%) T1 Control 892 1777 34 T2 PGLM @ 10 t ha-1 1167 2283 34 T3 N 80 kg ha-1 2318 4067 36 T4 N 60 kg ha-1 1684 3217 34 T5 N 40 kg ha-1 1299 2707 32 T6 N 20 kg ha-1 1003 2100 32 T7 N 80 kg ha-1 + PGLM 10 t ha-1 2597 4500 37 T8 N 60 kg ha-1 + PGLM 10 t ha-1 2187 3867 36 T9 N 40 kg ha-1 + PGLM 10 t ha-1 1782 3200 36 T10 N 20 kg ha-1 + PGLM 10 t ha-1 1437 2617 35 T11 N 80 kg ha-1 to sole pearlmillet 1978 3467 36 S.Em.± 92 142 2.25 CD (5%) 272 419 NS Mean 1667.6 3072.7 35 Rajesh, (2012)17
  • 18.
    Treatments Total N PK T1 Control 16.86 6.94 46.71 T2 PGLM @ 10 t ha-1 23.24 9.40 61.83 T3 N 80 kg ha-1 52.44 20.30 121.45 T4 N 60 kg ha-1 38.47 14.97 95.18 T5 N 40 kg ha-1 29.86 11.60 79.12 T6 N 20 kg ha-1 22.47 8.49 59.68 T7 N 80 kg ha-1 + PGLM 10 t ha-1 57.99 23.23 135.33 T8 N 60 kg ha-1 + PGLM 10 t ha-1 48.82 18.94 114.80 T9 N 40 kg ha-1 + PGLM 10 t ha-1 39.27 14.94 94.53 T10 N 20 kg ha-1 + PGLM 10 t ha-1 31.14 11.57 74.99 T11 N 80 kg ha-1 to sole pearlmillet 44.09 17.32 103.34 S.Em.± 1.40 0.50 3.60 CD (5%) 4.00 1.40 10.60 Mean 36.8 14.30 89.70 18 Rajesh, (2012)
  • 19.
  • 20.
  • 21.
  • 22.
    Plant Scientific name Nutrient content(%) on air dry basis N P K Sunhemp Crotalaria juncea 2.30 0.50 1.80 Dhaincha Sesbania aculeata 3.50 0.60 1.20 Sesbania Sesbania speciosa 2.71 0.53 2.21
  • 23.
    Duarte et al,201323 Green Manure Micro Nutrient (g/ha) B ZN Fe Mn Cu S.Vegetation 96.2 112.7 3331.9 152.5 28.7 C.Juncea 159.1 179.2 1250.8 206.8 48.8 C.Cajan 38.6 35.6 490.7 62.6 16.6 M.Aterrima 32.7 38.6 534.6 78.3 19.8 M. pruriens 77.3 87.2 802.7 250.2 48.5 M. deeringiana 56.5 68.8 821.6 221.4 63.9 Mixture 64.6 60.8 961.1 151.2 22.9 CV(%) 14.1 12.0 14.6 19.1 14.4
  • 24.
    Treatment Girth (cm)Height (cm) Yield (t ha-1) Control 1.75b 2.78b 59.11c Local dhaincha 183a 2.90a 78.45b sunhamp 1.95a 3.10a 91.87a African dhaincha 1.90a 3.0a 86.32a LSD(0.05) NS NS 5.93 Kabiraj et al., 2017 24
  • 25.
    No Treatment Plantheight (cm) Tillers m-1 Grain weight m-1 (g) Harvest index (%) T1 100% NPK 62.5 62 24.2 23.0 T2 50% NPK + FYM 65.8 72 28.0 24.2 T3 50% NPK + GM 65.0 73 38.1 27.0 T4 75% NPK + GM 79.5 85 41.0 29.2 T5 100% NPK + GM 79.3 80 45.2 29.9 SEm± 2.8 2.0 2.4 1.3 CD (P = 0.05) 8.6 6.2 7.3 3.9 Kumar et al., 201125
  • 26.
    No Treatment Grainyield (t ha-1) Total above ground biomass (t ha-1) 2004 2005 2006 Mean 2004 2005 2006 Mean T1 100% NPK 1.21 0.83 1.52 1.19 5.22 3.54 4.98 4.58 T2 50% NPK + FYM 1.36 0.92 1.63 1.30 5.55 3.69 5.56 4.93 T3 50% NPK +GM 1.66 1.48 2.23 1.79 5.99 5.05 6.72 5.92 T4 75% NPK + GM 1.75 1.51 2.53 1.93 6.13 5.30 6.90 6.11 T5 100% NPK + GM 1.88 1.86 2.64 2.13 6.29 6.09 7.27 6.55 Mean 1.57 1.32 2.11 1.67 5.84 4.74 6.29 5.62 SEm± 0.12 0.11 0.11 0.17 0.20 0.26 CD (P = 0.05) 0.36 0.34 0.34 0.53 0.61 0.79 26 Kumar et al., 2011
  • 27.
    Treatments Organic Matter(%) Total Nitrogen (%) Before incorporation After incorporation Increase (%) Before incorporation After incorporation Increase (%) Control 2.064 2.064 0 0.106 0.106 0 Acc. 25 1.995 2.133 6.92 0.112 0.118 5.35 Acc. 27 2.133 2.202 3.23 0.118 0.122 3.39 Acc. 28 1.582 1.995 26.11 0.088 0.112 25.00 Acc. 33 1.926 1.995 3.58 0.107 0.112 2.80 Acc. 57 1.721 2.064 19.93 0.095 0.114 20.00 Acc. 82 1.995 2.133 6.92 0.112 0.118 5.35 27 Sarwar et al., 2017Bangladesh
  • 28.
    treatment Yields Nuptake 1994 1996 1997 1994 1996 1997 Control 1966 1704 1753 42.79 35.78 37.38 Clover 2218 2061 2066 50.42 46.28 45.96 Millet 2870 2682 2093 67.67 57.94 47.58 Buck wheat 2489 2605 2049 56.44 58.56 45.01 Colza 2734 2856 2046 64.52 63.73 56.43 Mustard 2734 2503 1981 63.49 53.95 41.67 LSD(p>0.05) 157 281 338 5.82 6.78 10.8 28 Dayegamiye and Tran, 2011
  • 29.
    treatment Pod length(cm) Weight pod(gm) Pod diameter (cm) Off Standard pod (%) Podyields kg/ha T1 control 8.27b 9.18c 2.14c 38.37a 3502.95b T2 ( jac bean) 8.89a 12.10a 2.38 21.49b 5941.86a T3 (cowpea) 8.23b 10.44b 2.21b 23.78b 3614.56b T4 (green gram) 8.42b 10.61b 2.09cd 25.21b 4195.24b T5 (gaint sensitive plant) 7.79c 10.61b 2.05d 29.83ab 4299.03b LSD 0.12 0.28 0.02 3.75 485.83 CV(%) 13.27 9.24 12.06 12.54 14.05 Benjawan et al., 2007
  • 30.
    Treatment Seed protein(%) Seed oil (%) Oilyield (kg/ha) Control 14.0 41.3 518 100 kg N /ha 20.5 41.5 818 100 kg N+20 kg S /ha 21.6 43.7 914 100 kg N + 20 kg S /ha+ GM 22.6 43.5 992 30 Milkha et al., 2013
  • 31.
     Green manuringtechnology is gaining importance due to increasing emphasis on soil health, minimize environmental pollution and cut down the use of chemical in agriculture.  Application of green manure crops supplements the chemical fertilizers and restores soil fertility. Therefore, it is an eco-friendly low cost technology to conserve the natural resources besides maintaining environmental quality in a sustainable manner  By raising or incorporation of green and green leaf manures the soil fertility can be improved  low cost practice and an alternate way to improve soil fertility status. 31
  • 32.