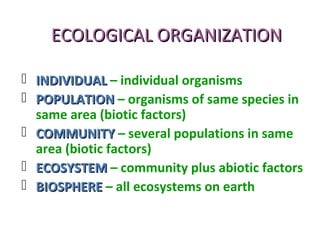
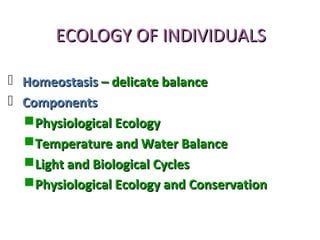
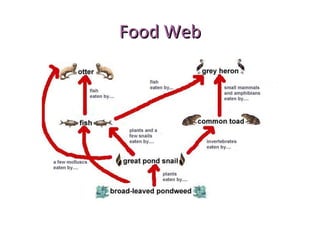
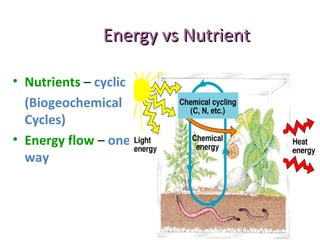
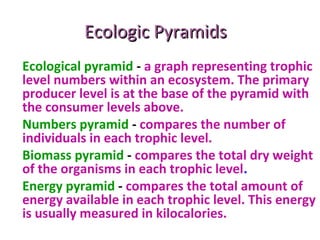
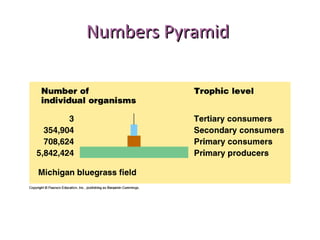
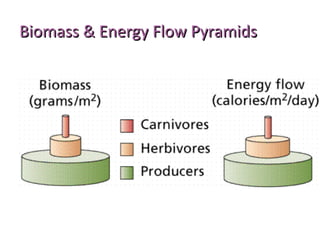
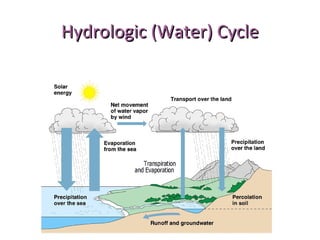
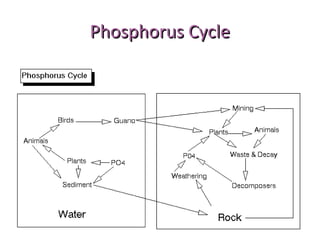
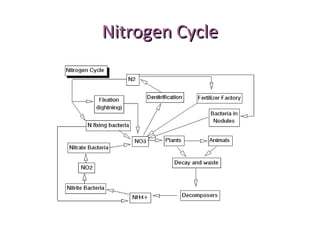
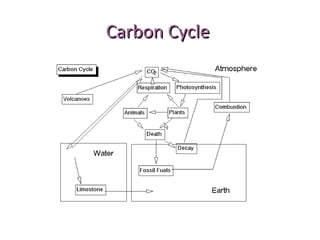
Dr.NGP INSTITUTE OF TECHNOLOGY
COMIBATORE
Department of Management Studies
By
Karuppasamy.M
710714631025
GREEN GENERATIONS (B&C)GREEN GENERATIONS (B&C)
ECOLOGICAL ORGANIZATIONECOLOGICAL ORGANIZATION
 INDIVIDUALINDIVIDUAL – individual organisms
 POPULATIONPOPULATION – organisms of same species in
same area (biotic factors)
 COMMUNITYCOMMUNITY – several populations in same
area (biotic factors)
 ECOSYSTEMECOSYSTEM – community plus abiotic factors
 BIOSPHEREBIOSPHERE – all ecosystems on earth
ECOLOGY OF INDIVIDUALSECOLOGY OF INDIVIDUALS
 HomeostasisHomeostasis – delicate balance– delicate balance
 ComponentsComponents
Physiological EcologyPhysiological Ecology
Temperature and Water BalanceTemperature and Water Balance
Light and Biological CyclesLight and Biological Cycles
Physiological Ecology and ConservationPhysiological Ecology and Conservation
ECOLOGY OF POPULATIONSECOLOGY OF POPULATIONS
 Properties of populationsProperties of populations
 Patterns of distribution and densityPatterns of distribution and density
 Intraspecific competitionIntraspecific competition
 Population dynamicsPopulation dynamics
 Growth and regulationGrowth and regulation
 Altering population growthAltering population growth
 Human impactHuman impact
Growth CurvesGrowth Curves
Survival CurvesSurvival Curves
SurvivorshipSurvivorship is the percentage ofis the percentage of
remaining survivors of aremaining survivors of a
population over time; usuallypopulation over time; usually
shown graphicallyshown graphically..
Type I survivorship curveType I survivorship curve:: mostmost
individuals live out their life spanindividuals live out their life span
and die of old age (e.g., humans).and die of old age (e.g., humans).
Type II survivorship curveType II survivorship curve::
individuals die at a constant rateindividuals die at a constant rate
(e.g., birds, rodents, and(e.g., birds, rodents, and
perennial plants).perennial plants).
Type III survivorship curveType III survivorship curve::
most individuals die early inmost individuals die early in
life (e.g., fishes, invertebrates,life (e.g., fishes, invertebrates,
and plants).and plants).
ECOLOGY OF COMMUNITIESECOLOGY OF COMMUNITIES
 Closed vs. Open communitiesClosed vs. Open communities
Closed –Closed – sharp boundariessharp boundaries
Open –Open – Lack boundariesLack boundaries
 Species abundance and diversitySpecies abundance and diversity
 Trophic Structure of CommunitiesTrophic Structure of Communities
Food chainsFood chains
Food webFood web
Trophic pyramidTrophic pyramid
INTERACTIONS AMONG SPECIESINTERACTIONS AMONG SPECIES
• InteractionsInteractions
• Interspecific competitionInterspecific competition
• PredationPredation
• ExploitationExploitation
• SymbiosisSymbiosis
Types of Species InteractionsTypes of Species Interactions
 NeutralNeutral – two species do not interact– two species do not interact
 MutualismMutualism – both benefit– both benefit
 CommensalismCommensalism – one benefits, other neutral– one benefits, other neutral
 ParasitismParasitism – one benefits, one harmed– one benefits, one harmed
but not killedbut not killed
 PredationPredation – one benefits, other killed– one benefits, other killed
Predator - Prey RelationshipPredator - Prey Relationship
Food ChainFood Chain
 rose plantrose plant  aphidsaphids  beetlebeetle  chameleonchameleon  hawkhawk
 Producer
 1st
order Consumer or Herbivore
 2nd
order Consumer or 1st
order Carnivore
 3rd
order Consumer or 2nd
order Carnivore
 4th
order Consumer or 3rd
order Carnivore
 Decomposers – consume dead and decaying
matter
Food WebFood Web
ECOLOGY OF ECOSYSTEMSECOLOGY OF ECOSYSTEMS
 Energy FlowEnergy Flow
Energy Flow PyramidsEnergy Flow Pyramids
Bio-mass PyramidsBio-mass Pyramids
 Community Succession and StabilityCommunity Succession and Stability
 Nutrient RecyclingNutrient Recycling – nutrient cycles– nutrient cycles
Energy vs NutrientEnergy vs Nutrient
• Nutrients – cyclic
(Biogeochemical
Cycles)
• Energy flow – one
way
Ecologic PyramidsEcologic Pyramids
Ecological pyramid - a graph representing trophic
level numbers within an ecosystem. The primary
producer level is at the base of the pyramid with
the consumer levels above.
Numbers pyramid - compares the number of
individuals in each trophic level.
Biomass pyramid - compares the total dry weight
of the organisms in each trophic level.
Energy pyramid - compares the total amount of
energy available in each trophic level. This energy
is usually measured in kilocalories.
Numbers PyramidNumbers Pyramid
Biomass & Energy Flow PyramidsBiomass & Energy Flow Pyramids
Hydrologic (Water) CycleHydrologic (Water) Cycle
Phosphorus CyclePhosphorus Cycle
Nitrogen CycleNitrogen Cycle
Carbon CycleCarbon Cycle
THANK YOU

Green generation 15_2-5-14

  • 1.
    Dr.NGP INSTITUTE OFTECHNOLOGY COMIBATORE Department of Management Studies By Karuppasamy.M 710714631025
  • 2.
  • 3.
    ECOLOGICAL ORGANIZATIONECOLOGICAL ORGANIZATION INDIVIDUALINDIVIDUAL – individual organisms  POPULATIONPOPULATION – organisms of same species in same area (biotic factors)  COMMUNITYCOMMUNITY – several populations in same area (biotic factors)  ECOSYSTEMECOSYSTEM – community plus abiotic factors  BIOSPHEREBIOSPHERE – all ecosystems on earth
  • 4.
    ECOLOGY OF INDIVIDUALSECOLOGYOF INDIVIDUALS  HomeostasisHomeostasis – delicate balance– delicate balance  ComponentsComponents Physiological EcologyPhysiological Ecology Temperature and Water BalanceTemperature and Water Balance Light and Biological CyclesLight and Biological Cycles Physiological Ecology and ConservationPhysiological Ecology and Conservation
  • 5.
    ECOLOGY OF POPULATIONSECOLOGYOF POPULATIONS  Properties of populationsProperties of populations  Patterns of distribution and densityPatterns of distribution and density  Intraspecific competitionIntraspecific competition  Population dynamicsPopulation dynamics  Growth and regulationGrowth and regulation  Altering population growthAltering population growth  Human impactHuman impact
  • 6.
  • 7.
    Survival CurvesSurvival Curves SurvivorshipSurvivorshipis the percentage ofis the percentage of remaining survivors of aremaining survivors of a population over time; usuallypopulation over time; usually shown graphicallyshown graphically.. Type I survivorship curveType I survivorship curve:: mostmost individuals live out their life spanindividuals live out their life span and die of old age (e.g., humans).and die of old age (e.g., humans). Type II survivorship curveType II survivorship curve:: individuals die at a constant rateindividuals die at a constant rate (e.g., birds, rodents, and(e.g., birds, rodents, and perennial plants).perennial plants). Type III survivorship curveType III survivorship curve:: most individuals die early inmost individuals die early in life (e.g., fishes, invertebrates,life (e.g., fishes, invertebrates, and plants).and plants).
  • 8.
    ECOLOGY OF COMMUNITIESECOLOGYOF COMMUNITIES  Closed vs. Open communitiesClosed vs. Open communities Closed –Closed – sharp boundariessharp boundaries Open –Open – Lack boundariesLack boundaries  Species abundance and diversitySpecies abundance and diversity  Trophic Structure of CommunitiesTrophic Structure of Communities Food chainsFood chains Food webFood web Trophic pyramidTrophic pyramid
  • 9.
    INTERACTIONS AMONG SPECIESINTERACTIONSAMONG SPECIES • InteractionsInteractions • Interspecific competitionInterspecific competition • PredationPredation • ExploitationExploitation • SymbiosisSymbiosis
  • 10.
    Types of SpeciesInteractionsTypes of Species Interactions  NeutralNeutral – two species do not interact– two species do not interact  MutualismMutualism – both benefit– both benefit  CommensalismCommensalism – one benefits, other neutral– one benefits, other neutral  ParasitismParasitism – one benefits, one harmed– one benefits, one harmed but not killedbut not killed  PredationPredation – one benefits, other killed– one benefits, other killed
  • 11.
    Predator - PreyRelationshipPredator - Prey Relationship
  • 12.
    Food ChainFood Chain rose plantrose plant  aphidsaphids  beetlebeetle  chameleonchameleon  hawkhawk  Producer  1st order Consumer or Herbivore  2nd order Consumer or 1st order Carnivore  3rd order Consumer or 2nd order Carnivore  4th order Consumer or 3rd order Carnivore  Decomposers – consume dead and decaying matter
  • 13.
  • 14.
    ECOLOGY OF ECOSYSTEMSECOLOGYOF ECOSYSTEMS  Energy FlowEnergy Flow Energy Flow PyramidsEnergy Flow Pyramids Bio-mass PyramidsBio-mass Pyramids  Community Succession and StabilityCommunity Succession and Stability  Nutrient RecyclingNutrient Recycling – nutrient cycles– nutrient cycles
  • 15.
    Energy vs NutrientEnergyvs Nutrient • Nutrients – cyclic (Biogeochemical Cycles) • Energy flow – one way
  • 16.
    Ecologic PyramidsEcologic Pyramids Ecologicalpyramid - a graph representing trophic level numbers within an ecosystem. The primary producer level is at the base of the pyramid with the consumer levels above. Numbers pyramid - compares the number of individuals in each trophic level. Biomass pyramid - compares the total dry weight of the organisms in each trophic level. Energy pyramid - compares the total amount of energy available in each trophic level. This energy is usually measured in kilocalories.
  • 17.
  • 18.
    Biomass & EnergyFlow PyramidsBiomass & Energy Flow Pyramids
  • 19.
  • 20.
  • 21.
  • 22.
  • 23.