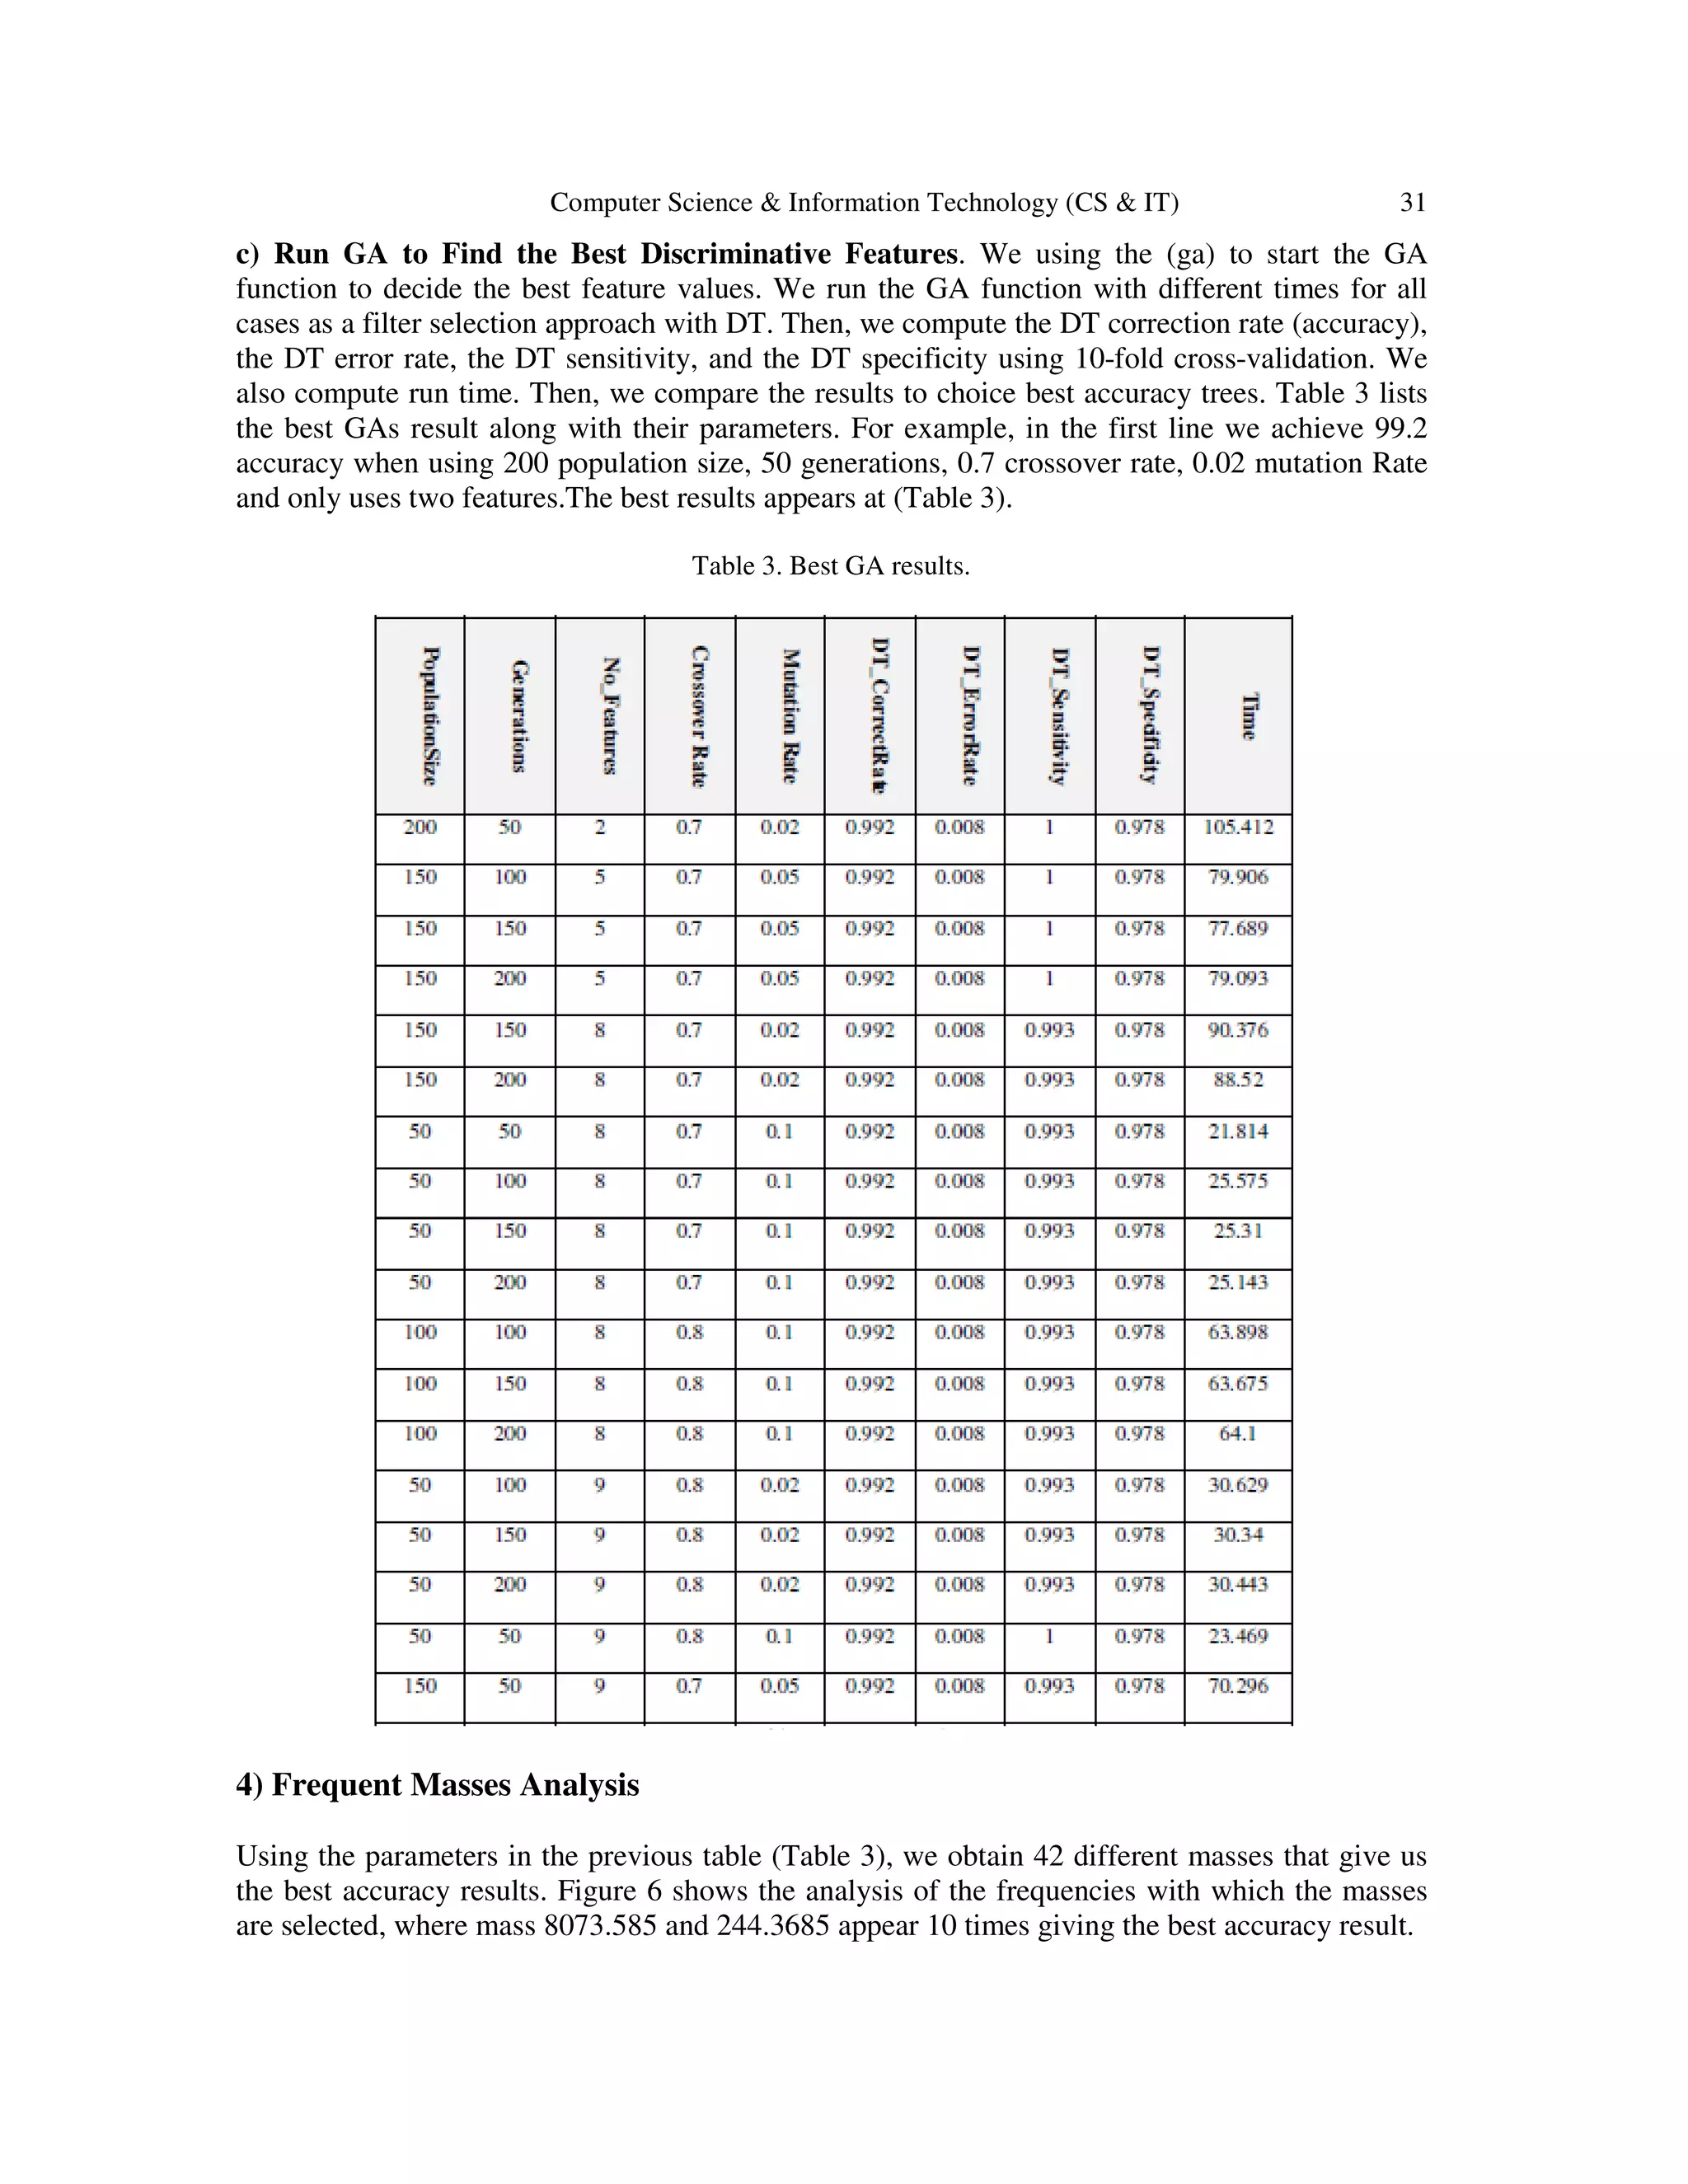
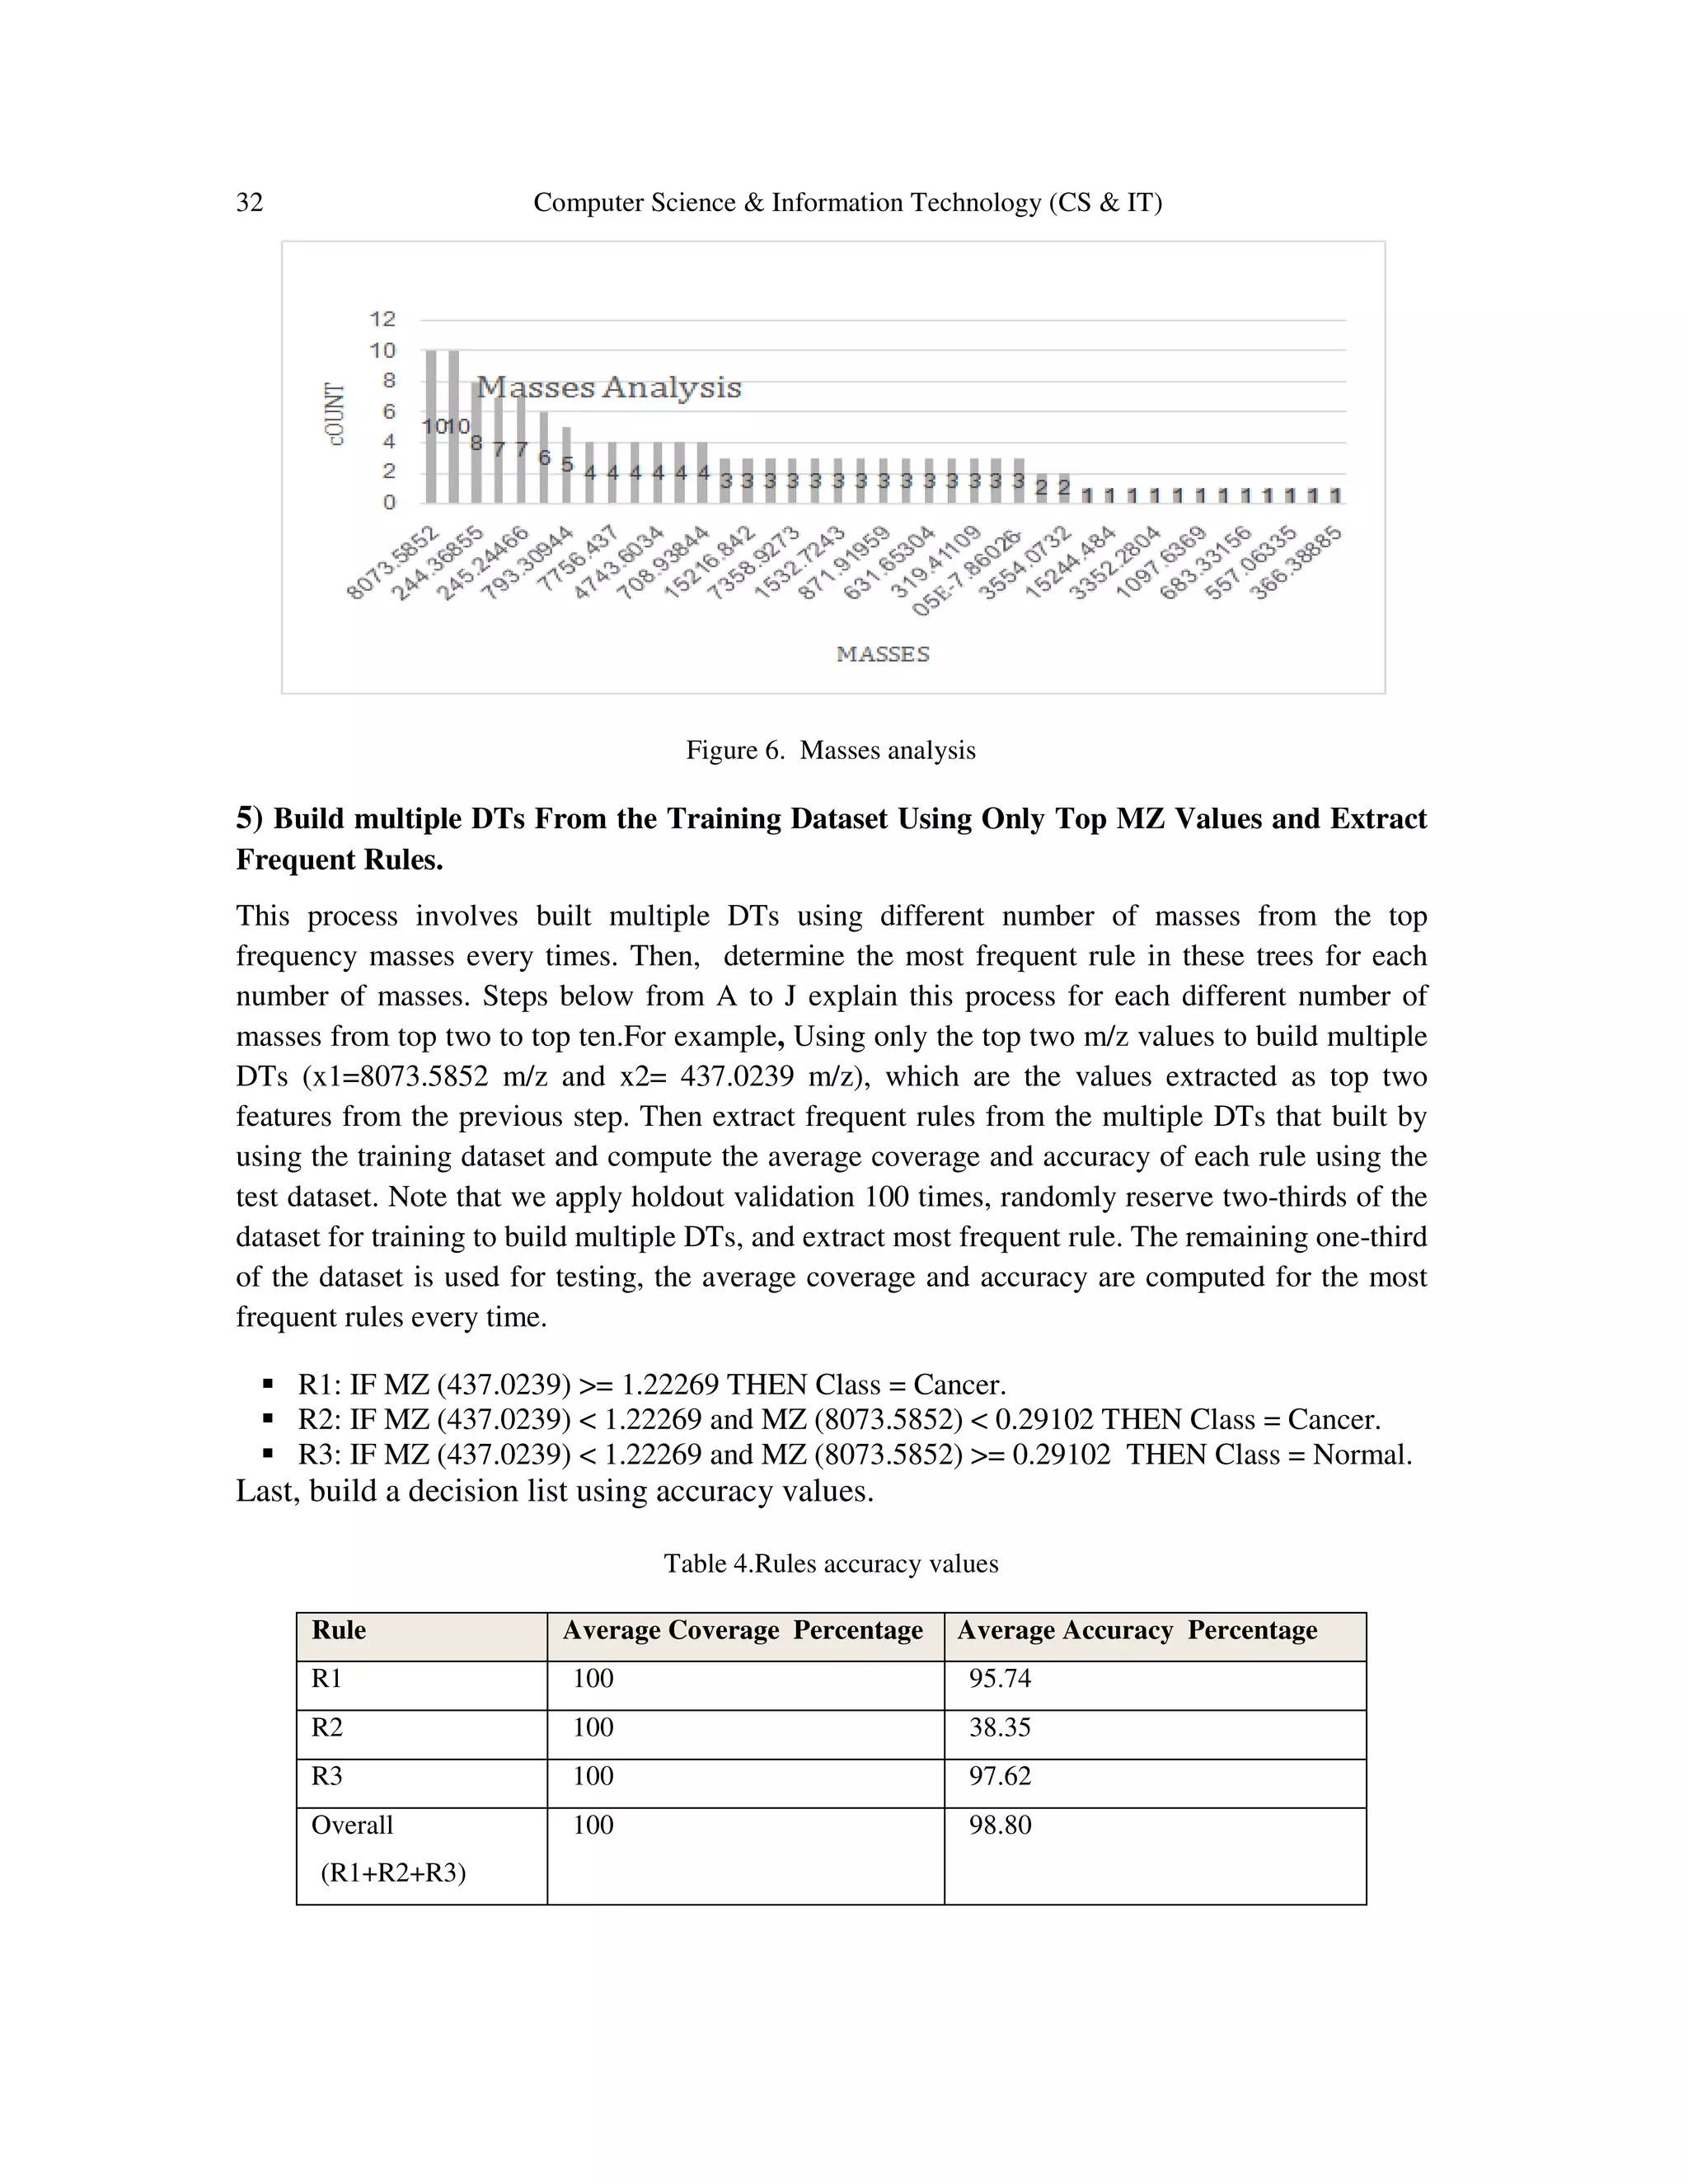
Many studies uses different data mining techniques to analyze mass spectrometry data and
extract useful knowledge about biomarkers. These Biomarkers allow the medical experts to
determine whether an individual has a disease or not. Some of these studies have proposed
models that have obtained high accuracy. However, the black-box nature and complexity of the
proposed models have posed significant issues. Thus, to address this problem and build an
accurate model, we use a genetic algorithm for feature selection along with a rule-based
classifier, namely Genetic Rule-Based Classifier algorithm for Mass Spectra data (GRC-MS).
According to the literature, rule-based classifiers provide understandable rules, but not
accurate. In addition, genetic algorithms have achieved excellent results when used with
different classifiers for feature selection. Experiments are conducted on real dataset and the
proposed classifier GRC-MS achieves 99.7% accuracy. In addition, the generated rules are
more understandable than those of other classifier models
Medical informatics growth can be observed now days. Advancement in different medical fields
discovers the various critical diseases and provides the guidelines for their cure. This has been possible
only because of well heeled medical databases as well as automation of data analysis process. Towards
this analysis process lots of learning and intelligence is required, the data mining techniques provides the
basis for that and various data mining techniques are available like Decision tree Induction, Rule Based
Classification or mining, Support vector machine, Stochastic classification, Logistic regression, Naïve
bayes, Artificial Neural Network & Fuzzy Logic, Genetic Algorithms. This paper provides the basic of
data mining with their effective techniques availability in medical sciences & reveals the efforts done on
medical databases using data mining techniques for human disease diagnosis.
Patterns discovered from based on collected molecular profiles of patient tumour samples, and also clinical metadata, could be used to provide personalized cancer treatment to patients with
similar molecular subtypes. Computational algorithms for cancer diagnosis, prognosis, and therapeutics that can recognize specific functions and aid in classifiers based on a plethora of
publicly accessible cancer research outcomes are needed. Machine learning, a branch of artificial intelligence, has a great deal of potential for problem solving in cryptic cancer
datasets, as per a literature study. We focus on the new state of machine learning applications in cancer research in this study, illustrating trends and analysing major accomplishments,
roadblocks, and challenges along the way to clinic implementation. In the context of noninvasive treating cancer using diet-based and natural biomarkers, we propose a novel machine learning algorithm.
IRJET - Breast Cancer Prediction using Supervised Machine Learning Algorithms...IRJET Journal
This document describes a study that uses supervised machine learning algorithms to predict breast cancer. Three algorithms - decision tree, logistic regression, and random forest - are applied to preprocessed breast cancer data. The random forest model achieved the best accuracy at 98.6% for predicting whether a tumor was benign or malignant. The study aims to develop an early prediction system for breast cancer using machine learning techniques.
Novel modelling of clustering for enhanced classification performance on gene...IJECEIAES
Gene expression data is popularized for its capability to disclose various disease conditions. However, the conventional procedure to extract gene expression data itself incorporates various artifacts that offer challenges in diagnosis a complex disease indication and classification like cancer. Review of existing research approaches indicates that classification approaches are few to proven to be standard with respect to higher accuracy and applicable to gene expression data apart from unaddresed problems of computational complexity. Therefore, the proposed manuscript introduces a novel and simplified model capable using Graph Fourier Transform, Eigen Value and vector for offering better classification performance considering case study of microarray database, which is one typical example of gene expressiondata. The study outcome shows that proposed system offers comparatively better accuracy and reduced computational complexity with the existing clustering approaches.
Hybrid prediction model with missing value imputation for medical data 2015-g...Jitender Grover
The document presents a novel hybrid prediction model called HPM-MI that uses K-means clustering and multilayer perceptron (MLP) to improve predictive classification for medical data with missing values. The model first analyzes 11 different imputation techniques using K-means clustering to select the best one for filling missing values in the data. It then uses K-means clustering again to validate class labels and remove incorrectly classified instances before applying the MLP classifier. The model is tested on three medical datasets from the UCI repository and shows improved accuracy, sensitivity, specificity and other metrics compared to existing methods, particularly when datasets have large numbers of missing values.
Comparative study of artificial neural network based classification for liver...Alexander Decker
This document presents a comparative study of different artificial neural network (ANN) classification models for predicting liver disease in patients. It evaluates ANN models like backpropagation, radial basis function, self-organizing map, and support vector machine on liver patient data. The support vector machine model achieved the highest accuracy at 99.76% for men data and 97.7% for women data, indicating it may be effective as a predictive tool for liver patients.
SCDT: FC-NNC-structured Complex Decision Technique for Gene Analysis Using Fu...IJECEIAES
In many diseases classification an accurate gene analysis is needed, for which selection of most informative genes is very important and it require a technique of decision in complex context of ambiguity. The traditional methods include for selecting most significant gene includes some of the statistical analysis namely 2-Sample-T-test (2STT), Entropy, Signal to Noise Ratio (SNR). This paper evaluates gene selection and classification on the basis of accurate gene selection using structured complex decision technique (SCDT) and classifies it using fuzzy cluster based nearest neighborclassifier (FC-NNC). The effectiveness of the proposed SCDT and FC-NNC is evaluated for leave one out cross validation metric(LOOCV) along with sensitivity, specificity, precision and F1-score with four different classifiers namely 1) Radial Basis Function (RBF), 2) Multi-layer perception(MLP), 3) Feed Forward(FF) and 4) Support vector machine(SVM) for three different datasets of DLBCL, Leukemia and Prostate tumor. The proposed SCDT &FC-NNC exhibits superior result for being considered more accurate decision mechanism.
Cancer is a disease caused by abnormal cell growth and can affect different cell types. This paper focuses on breast cancer, which is classified based on the type of affected cell. There are several risk factors that can increase the likelihood of developing cancer, including gender, age, genetics, family history, weight, alcohol use, and smoking. The dataset used contains information from 569 breast cancer cases, including demographic and cell feature data. Machine learning algorithms like decision trees can be applied to build models for diagnosing breast cancer based on these attributes with up to 96.46% accuracy.
EVOLVING EFFICIENT CLUSTERING AND CLASSIFICATION PATTERNS IN LYMPHOGRAPHY DAT...ijsc
Data mining refers to the process of retrieving knowledge by discovering novel and relative patterns from
large datasets. Clustering and Classification are two distinct phases in data mining that work to provide an
established, proven structure from a voluminous collection of facts. A dominant area of modern-day
research in the field of medical investigations includes disease prediction and malady categorization. In
this paper, our focus is to analyze clusters of patient records obtained via unsupervised clustering
techniques and compare the performance of classification algorithms on the clinical data. Feature
selection is a supervised method that attempts to select a subset of the predictor features based on the
information gain. The Lymphography dataset comprises of 18 predictor attributes and 148 instances with
the class label having four distinct values. This paper highlights the accuracy of eight clustering algorithms
in detecting clusters of patient records and predictor attributes and highlights the performance of sixteen
classification algorithms on the Lymphography dataset that enables the classifier to accurately perform
multi-class categorization of medical data. Our work asserts the fact that the Random Tree algorithm and
the Quinlan’s C4.5 algorithm give 100 percent classification accuracy with all the predictor features and
also with the feature subset selected by the Fisher Filtering feature selection algorithm.. It is also stated
here that the Density Based Spatial Clustering of Applications with Noise (DBSCAN) clustering algorithm
offers increased clustering accuracy in less computation time.
Data Mining Techniques In Computer Aided Cancer DiagnosisDataminingTools Inc
Data mining techniques are used in computer aided cancer diagnosis and detection. They help physicians interpret complex diagnoses, combine information from multiple sources, and provide support for differential diagnosis. Specific techniques like neural networks, decision trees, and cluster detection are used in ALL diagnosis. Data mining can also be applied to detect gastric cancer using single nucleotide polymorphism information. It helps organize healthcare claims data to detect cancer patterns and evaluate treatment efficacy. New applications of data mining and neural networks are also helping detect cancers like breast cancer sooner.
Cheminformatics plays a key role in modern drug discovery by helping chemists organize and analyze the vast amounts of chemical data being produced. It combines fields like chemistry, biology, and informatics to transform data into knowledge. Specifically, cheminformatics aids in tasks like identifying drug targets, finding lead compounds, optimizing leads, and conducting pre-clinical trials through methods such as high-throughput screening, structure-activity modeling, and predictive toxicity analysis. It also provides tools for tasks like drawing and searching chemical structures in databases.
Innovative Technique for Gene Selection in Microarray Based on Recursive Clus...AM Publications
Gene selection is usually the crucial step in microarray data analysis. A great deal of recent research has focused on the
challenging task of selecting differentially expressed genes from microarray data (‘gene selection’). Numerous gene selection
algorithms have been proposed in the literature, but it is often unclear exactly how these algorithms respond to conditions like
small sample-sizes or differing variances. Choosing an appropriate algorithm can therefore be difficult in many cases. This paper
presents combination of Analysis of Variance (ANOVA), Principle Component Analysis (PCA), Recursive Cluster Elimination
(RCE) a classification algorithm by employing a innovative method for gene selection. It reduces the gene expression data into
minimal number of gene subset. This is a new feature selection method which uses ANOVA statistical test, principal component
analysis, KNN classification &RCE (recursive cluster elimination). At each step redundant & irrelevant features are get
eliminated. Classification accuracy reaches up to 99.10% and lesser time for classification when compared to other convectional techniques.
Efficiency of Prediction Algorithms for Mining Biological DatabasesIOSR Journals
This document analyzes the efficiency of various prediction algorithms for mining biological databases. It discusses prediction through mining biological databases to identify disease risks. It then evaluates several prediction algorithms (ZeroR, OneR, JRip, PART, Decision Table) on a breast cancer dataset using measures like accuracy, sensitivity, specificity, and predictive values. The results show that the JRip and PART algorithms generally had the highest accuracy rates, around 70%, while ZeroR had the lowest accuracy. However, ZeroR had a perfect positive predictive value. The study aims to assess the most efficient algorithms for predictive mining of biological data.
1. Bioinformatics uses computer science and information technology to analyze biological data and assist with drug discovery. It helps identify drug targets and design drug candidates.
2. The drug design process involves identifying a disease target, studying compounds of interest, detecting molecular disease bases, rational drug design, refinement, and testing. Bioinformatics tools assist with each step.
3. CADD uses computational methods to simulate drug-receptor interactions and is heavily dependent on bioinformatics tools and databases. It supports techniques like virtual screening, sequence analysis, homology modeling, and physicochemical modeling to aid drug development.
GRAPHICAL MODEL AND CLUSTERINGREGRESSION BASED METHODS FOR CAUSAL INTERACTION...ijaia
The early detection of Breast Cancer, the deadly disease that mostly affects women is extremely complex because it requires various features of the cell type. Therefore, the efficient approach to diagnosing Breast Cancer at the early stage was to apply artificial intelligence where machines are simulated with intelligence and programmed to think and act like a human. This allows machines to passively learn and find a pattern, which can be used later to detect any new changes that may occur. In general, machine learning is quite useful particularly in the medical field, which depends on complex genomic measurements such as microarray technique and would increase the accuracy and precision of results. With this technology, doctors can easily diagnose patients with cancer quickly and apply the proper treatment in a timely manner. Therefore, the goal of this paper is to address and propose a robust Breast Cancer diagnostic system using complex genomic analysis via microarray technology. The system will combine two machine learning methods, K-means cluster, and linear regression.
The document discusses using genetic algorithms for feature selection and the Weka tool for classification of an ovarian cancer dataset. It begins by introducing data mining and classification techniques. It then describes using a genetic algorithm to select relevant features from the ovarian cancer dataset, reducing it from over 15,000 attributes to 20. These selected features are input into Weka, which applies additional data preprocessing before using various classifiers. The Simple Logistic classifier achieved the highest accuracy rate of 100%. In conclusion, genetic algorithms help reduce data dimensionality for classification, and Weka is useful for evaluating different machine learning algorithms on medical datasets.
This document discusses data mining algorithms for clustering healthcare data streams. It provides an overview of the K-means and D-stream algorithms, and proposes a framework for comparing them on healthcare datasets. The framework involves feature extraction from physiological signals, calculating risk components, and applying the K-means and D-stream algorithms to cluster the data. The results would show the effectiveness and limitations of each algorithm for clustering streaming healthcare data.
An Ensemble of Filters and Wrappers for Microarray Data Classification mlaij
The development of microarray technology has suppli
ed a large volume of data to many fields. The gene
microarray analysis and classification have demonst
rated an effective way for the effective diagnosis
of
diseases and cancers. In as much as the data achiev
ing from microarray technology is very noisy and al
so
has thousands of features, feature selection plays
an important role in removing irrelevant and redund
ant
features and also reducing computational complexity
. There are two important approaches for gene
selection in microarray data analysis, the filters
and the wrappers. To select a concise subset of inf
ormative
genes, we introduce a hybrid feature selection whic
h combines two approaches. The fact of the matter i
s
that candidate’s features are first selected from t
he original set via several effective filters. The
candidate
feature set is further refined by more accurate wra
ppers. Thus, we can take advantage of both the filt
ers
and wrappers. Experimental results based on 11 micr
oarray datasets show that our mechanism can be
effected with a smaller feature set. Moreover, thes
e feature subsets can be obtained in a reasonable t
ime
C omparative S tudy of D iabetic P atient D ata’s U sing C lassification A lg...Editor IJCATR
Data mining refers to extracting knowledge from large amount of data. Real life data mining approaches are
interesting because they often present a different se
t of problems for
diabetic
patient’s
data
.
The
research area to solve
various problems and classification is one of main problem in the field. The research describes algorithmic discussion of J48
,
J48 Graft, Random tree, REP, LAD. Here used to compare the
performance of computing time, correctly classified
instances, kappa statistics, MAE, RMSE, RAE, RRSE and
to find the error rate measurement for different classifiers in
weka .In this paper the
data
classification is diabetic patients data set is develope
d by collecting data from hospital repository
consists of 1865 instances with different attributes. The instances in the dataset are two categories of blood tests, urine t
ests.
Weka tool is used to classify the data is evaluated using 10 fold cross validat
ion and the results are compared. When the
performance of algorithms
,
we found J48 is better algorithm in most of the cases
Structural bioinformatics uses computational techniques to aid in drug discovery. Bioinformatics analyzes gene and protein sequence data to identify potential drug targets. Molecular docking then simulates how candidate drug compounds interact with these targets at the atomic level. This provides insight into how well a compound may bind to and affect the target. The results can help optimize drug candidates prior to further testing.
IRJET- Gene Mutation Data using Multiplicative Adaptive Algorithm and Gene On...IRJET Journal
This document presents a methodology for analyzing gene mutation data using ontologies and association rule mining. It aims to develop a common knowledge base for genomic and proteomic analysis by integrating multiple data sources. The methodology involves using k-nearest neighbors algorithm to find similar genes, an iterative multiplicative updating algorithm to solve optimization problems, and SNCoNMF to identify co-regulatory modules between genes, microRNAs and transcription factors. The results are represented using a Bayesian rose tree for efficient visualization of associations between genetic components and diseases.
Framework for efficient transformation for complex medical data for improving...IJECEIAES
The adoption of various technological advancement has been already adopted in the area of healthcare sector. This adoption facilitates involuntary generation of medical data that can be autonomously programmed to be forwarded to a destined hub in the form of cloud storage units. However, owing to such technologies there is massive formation of complex medical data that significantly acts as an overhead towards performing analytical operation as well as unwanted storage utilization. Therefore, the proposed system implements a novel transformation technique that is capable of using a template based stucture over cloud for generating structured data from highly unstructured data in a non-conventional manner. The contribution of the propsoed methodology is that it offers faster processing and storage optimization. The study outcome also proves this fact to show propsoed scheme excels better in performance in contrast to existing data transformation scheme.
Feature Selection Mammogram based on Breast Cancer Mining IJECEIAES
The very dense breast of mammogram image makes the Radiologists often have difficulties in interpreting the mammography objectively and accurately. One of the key success factors of computer-aided diagnosis (CADx) system is the use of the right features. Therefore, this research emphasizes on the feature selection process by performing the data mining on the results of mammogram image feature extraction. There are two algorithms used to perform the mining, the decision tree and the rule induction. Furthermore, the selected features produced by the algorithms are tested using classification algorithms: k-nearest neighbors, decision tree, and naive bayesian with the scheme of 10-fold cross validation using stratified sampling way. There are five descriptors that are the best features and have contributed in determining the classification of benign and malignant lesions as follows: slice, integrated density, area fraction, model gray value, and center of mass. The best classification results based on the five features are generated by the decision tree algorithm with accuracy, sensitivity, specificity, FPR, and TPR of 93.18%; 87.5%; 3.89%; 6.33% and 92.11% respectively.
Cancer prognosis prediction using balanced stratified samplingijscai
High accuracy in cancer prediction is important to improve the quality of the treatment and to improve the
rate of survivability of patients. As the data volume is increasing rapidly in the healthcare research, the
analytical challenge exists in double. The use of effective sampling technique in classification algorithms
always yields good prediction accuracy. The SEER public use cancer database provides various prominent
class labels for prognosis prediction. The main objective of this paper is to find the effect of sampling
techniques in classifying the prognosis variable and propose an ideal sampling method based on the
outcome of the experimentation. In the first phase of this work the traditional random sampling and
stratified sampling techniques have been used. At the next level the balanced stratified sampling with
variations as per the choice of the prognosis class labels have been tested. Much of the initial time has been
focused on performing the pre-processing of the SEER data set. The classification model for
experimentation has been built using the breast cancer, respiratory cancer and mixed cancer data sets with
three traditional classifiers namely Decision Tree, Naïve Bayes and K-Nearest Neighbour. The three
prognosis factors survival, stage and metastasis have been used as class labels for experimental
comparisons. The results shows a steady increase in the prediction accuracy of balanced stratified model
as the sample size increases, but the traditional approach fluctuates before the optimum results.
Welcome to International Journal of Engineering Research and Development (IJERD)IJERD Editor
This document summarizes a research paper that uses genetic algorithms for data mining of mass spectrometry data. The paper applies genetic algorithms to the data mining step of the KDD (Knowledge Discovery in Databases) process. Specifically, it uses genetic algorithms to extract optimal features or peaks from mass spectrometry data that can distinguish cancer patients from control patients. The genetic algorithm searches for discriminative features, which are ion intensity levels at specific mass-charge values. Over generations of the genetic algorithm, the paper finds significant patterns of masses that can differentiate between normal and cancer patients.
Hybrid filtering methods for feature selection in high-dimensional cancer dataIJECEIAES
Statisticians in both academia and industry have encountered problems with high-dimensional data. The rapid feature increase has caused the feature count to outstrip the instance count. There are several established methods when selecting features from massive amounts of breast cancer data. Even so, overfitting continues to be a problem. The challenge of choosing important features with minimum loss in a different sample size is another area with room for development. As a result, the feature selection technique is crucial for dealing with high-dimensional data classification issues. This paper proposed a new architecture for high-dimensional breast cancer data using filtering techniques and a logistic regression model. Essential features are filtered out using a combination of hybrid chi–square and hybrid information gain (hybrid IG) with logistic regression as classifier. The results showed that hybrid IG performed the best for high-dimensional breast and prostate cancer data. The top 50 and 22 features outperformed the other configurations, with the highest classification accuracies of 86.96% and 82.61%, respectively, after integrating the hybrid information gain and logistic function (hybrid IG+LR) with a sample size of 75. In the future, multiclass classification of multidimensional medical data to be evaluated using data from a different domain.
EFFICACY OF NON-NEGATIVE MATRIX FACTORIZATION FOR FEATURE SELECTION IN CANCER...IJDKP
Over the past few years, there has been a considerable spread of microarray technology in many biological patterns, particularly in those pertaining to cancer diseases like leukemia, prostate, colon cancer, etc. The primary bottleneck that one experiences in the proper understanding of such datasets lies in their dimensionality, and thus for an efficient and effective means of studying the same, a reduction in their dimension to a large extent is deemed necessary. This study is a bid to suggesting different algorithms and approaches for the reduction of dimensionality of such microarray datasets.This study exploits the matrix-like structure of such microarray data and uses a popular technique called Non-Negative Matrix Factorization (NMF) to reduce the dimensionality, primarily in the field of biological data. Classification accuracies are then compared for these algorithms.This technique gives an accuracy of 98%.
EFFICACY OF NON-NEGATIVE MATRIX FACTORIZATION FOR FEATURE SELECTION IN CANCER...IJDKP
Over the past few years, there has been a considerable spread of microarray technology in many
biological patterns, particularly in those pertaining to cancer diseases like leukemia, prostate, colon
cancer, etc. The primary bottleneck that one experiences in the proper understanding of such datasets lies
in their dimensionality, and thus for an efficient and effective means of studying the same, a reduction in
their dimension to a large extent is deemed necessary. This study is a bid to suggesting different algorithms
and approaches for the reduction of dimensionality of such microarray datasets.This study exploits the
matrix-like structure of such microarray data and uses a popular technique called Non-Negative Matrix
Factorization (NMF) to reduce the dimensionality, primarily in the field of biological data. Classification
accuracies are then compared for these algorithms.This technique gives an accuracy of 98%
Controlling informative features for improved accuracy and faster predictions...Damian R. Mingle, MBA
Identification of suitable biomarkers for accurate prediction of phenotypic outcomes is a goal for personalized medicine. However, current machine learning approaches are either too complex or perform poorly.
For more information:
http://societyofdatascientists.com/controlling-informative-features-for-improved-accuracy-and-faster-predictions-in-omentum-cancer-models/?src=slideshare
This document reviews different machine learning methods for classifying malignant mesothelioma using a dataset of 324 patient records. It evaluates the performance of support vector machine (SVM), decision tree, neural network, bagging, and AdaBoost in terms of classification accuracy and computational time. SVM with a linear kernel, decision tree, and bagging using decision trees achieved the highest accuracy of 100% across different training set sizes. However, bagging had longer computational time than SVM and decision tree. Therefore, the document concludes that SVM with a linear kernel or decision tree would be the best methods for classifying malignant mesothelioma, especially for large datasets, due to their high accuracy and low computational time.
Propose a Enhanced Framework for Prediction of Heart DiseaseIJERA Editor
This document proposes a new framework for predicting heart disease using machine learning techniques. It first discusses techniques like artificial neural networks and Naive Bayes classification that can be used for classification. It also discusses feature selection techniques like principal component analysis and information gain that can reduce the number of attributes before classification. The proposed framework would take a dataset, apply feature selection to reduce attributes, then use two classification algorithms (ANN and Naive Bayes) on the reduced dataset to select important attributes for heart disease prediction. This is intended to help identify key attributes and predict heart disease symptoms more efficiently.
PREDICTION OF MALIGNANCY IN SUSPECTED THYROID TUMOUR PATIENTS BY THREE DIFFER...cscpconf
This document compares three classification methods - artificial neural networks, decision trees, and logistic regression - for predicting malignancy in thyroid tumor patients using a clinical dataset. It describes each method and applies them to a dataset of 259 thyroid tumor patients. The artificial neural network achieved 98% accuracy on the training set and 92% on the validation set. The decision tree method used 150 cases to build a model and achieved 86% accuracy. Logistic regression analysis resulted in 88% accuracy. The artificial neural network was able to accurately predict malignancy and identified important attributes like multiple nodules and family cancer history.
The document discusses using machine learning algorithms and supervised learning methods to develop an automated system for detecting nanoparticles and estimating their size and spatial distribution from scanning electron microscope images. The goal is to enable industrial-scale manufacturing of nanomaterials by applying quality control tools. Specifically, the research uses support vector machines and scale-invariant feature transform to extract features from images and classify pixels as nanorods or background in order to predict locations and dimensions of nanorods.
Graphical Model and Clustering-Regression based Methods for Causal Interactio...gerogepatton
The early detection of Breast Cancer, the deadly disease that mostly affects women is extremely complex
because it requires various features of the cell type. Therefore, the efficient approach to diagnosing Breast
Cancer at the early stage was to apply artificial intelligence where machines are simulated with
intelligence and programmed to think and act like a human. This allows machines to passively learn and
find a pattern, which can be used later to detect any new changes that may occur. In general, machine
learning is quite useful particularly in the medical field, which depends on complex genomic
measurements such as microarray technique and would increase the accuracy and precision of results.
With this technology, doctors can easily diagnose patients with cancer quickly and apply the proper
treatment in a timely manner. Therefore, the goal of this paper is to address and propose a robust Breast
Cancer diagnostic system using complex genomic analysis via microarray technology. The system will
combine two machine learning methods, K-means cluster, and linear regression.
GRAPHICAL MODEL AND CLUSTERINGREGRESSION BASED METHODS FOR CAUSAL INTERACTION...gerogepatton
The early detection of Breast Cancer, the deadly disease that mostly affects women is extremely complex because it requires various features of the cell type. Therefore, the efficient approach to diagnosing Breast Cancer at the early stage was to apply artificial intelligence where machines are simulated with intelligence and programmed to think and act like a human. This allows machines to passively learn and find a pattern, which can be used later to detect any new changes that may occur. In general, machine learning is quite useful particularly in the medical field, which depends on complex genomic measurements such as microarray technique and would increase the accuracy and precision of results. With this technology, doctors can easily diagnose patients with cancer quickly and apply the proper treatment in a timely manner. Therefore, the goal of this paper is to address and propose a robust Breast Cancer diagnostic system using complex genomic analysis via microarray technology. The system will combine two machine learning methods, K-means cluster, and linear regression.
Classification AlgorithmBased Analysis of Breast Cancer DataIIRindia
The classification algorithms are very frequently used algorithms for analyzing various kinds of data available in different repositories which have real world applications. The main objective of this research work is to find the performance of classification algorithms in analyzing Breast Cancer data via analyzing the mammogram images based its characteristics.Different attribute values of cancer affected mammogram images are considered for analysis in this work. The Patients food habits, age of the patients, their life styles, occupation, their problem about the diseases and other information are taken into account for classification. Finally, performance of classification algorithms J48, CART and ADTree are given with its accuracy. The accuracy of taken algorithms is measured by various measures like specificity, sensitivity and kappa statistics (Errors).
PREDICTIVE ANALYTICS IN HEALTHCARE SYSTEM USING DATA MINING TECHNIQUEScscpconf
The health sector has witnessed a great evolution following the development of new computer technologies, and that pushed this area to produce more medical data, which gave birth to multiple fields of research. Many efforts are done to cope with the explosion of medical data on one hand, and to obtain useful knowledge from it on the other hand. This prompted researchers to apply all the technical innovations like big data analytics, predictive analytics, machine learning and learning algorithms in order to extract useful knowledge and help in making decisions. With the promises of predictive analytics in big data, and the use of machine learning
algorithms, predicting future is no longer a difficult task, especially for medicine because predicting diseases and anticipating the cure became possible. In this paper we will present an overview on the evolution of big data in healthcare system, and we will apply a learning algorithm on a set of medical data. The objective is to predict chronic kidney diseases by using Decision Tree (C4.5) algorithm.
Evolving Efficient Clustering and Classification Patterns in Lymphography Dat...ijsc
Data mining refers to the process of retrieving knowledge by discovering novel and relative patterns from large datasets. Clustering and Classification are two distinct phases in data mining that work to provide an established, proven structure from a voluminous collection of facts. A dominant area of modern-day research in the field of medical investigations includes disease prediction and malady categorization. In this paper, our focus is to analyze clusters of patient records obtained via unsupervised clustering techniques and compare the performance of classification algorithms on the clinical data. Feature selection is a supervised method that attempts to select a subset of the predictor features based on the information gain. The Lymphography dataset comprises of 18 predictor attributes and 148 instances with the class label having four distinct values. This paper highlights the accuracy of eight clustering algorithms in detecting clusters of patient records and predictor attributes and highlights the performance of sixteen classification algorithms on the Lymphography dataset that enables the classifier to accurately perform multi-class categorization of medical data. Our work asserts the fact that the Random Tree algorithm and the Quinlan’s C4.5 algorithm give 100 percent classification accuracy with all the predictor features and also with the feature subset selected by the Fisher Filtering feature selection algorithm.. It is also stated here that the Density Based Spatial Clustering of Applications with Noise (DBSCAN) clustering algorithm offers increased clustering accuracy in less computation time.
Performance evaluation of random forest with feature selection methods in pre...IJECEIAES
Data mining is nothing but the process of viewing data in different angle and compiling it into appropriate information. Recent improvements in the area of data mining and machine learning have empowered the research in biomedical field to improve the condition of general health care. Since the wrong classification may lead to poor prediction, there is a need to perform the better classification which further improves the prediction rate of the medical datasets. When medical data mining is applied on the medical datasets the important and difficult challenges are the classification and prediction. In this proposed work we evaluate the PIMA Indian Diabtes data set of UCI repository using machine learning algorithm like Random Forest along with feature selection methods such as forward selection and backward elimination based on entropy evaluation method using percentage split as test option. The experiment was conducted using R studio platform and we achieved classification accuracy of 84.1%. From results we can say that Random Forest predicts diabetes better than other techniques with less number of attributes so that one can avoid least important test for identifying diabetes.
IRJET-Survey on Data Mining Techniques for Disease PredictionIRJET Journal
This document discusses using data mining techniques to predict disease, specifically focusing on heart disease. It provides an overview of different classification algorithms that can be used for disease prediction, including decision trees, Bayesian classifiers, multilayer perceptrons, and ensemble techniques. These algorithms are analyzed based on their accuracy, time efficiency, and area under the ROC curve. The document also reviews related literature applying various data mining methods like decision trees, KNN, and support vector machines to heart disease prediction. Overall, the document examines using classification algorithms and data mining to extract patterns from medical data that can help predict heart disease and other illnesses.
Heart Failure Prediction using Different MachineLearning TechniquesIRJET Journal
This document discusses predicting heart failure using machine learning techniques. It aims to improve the accuracy of cardiovascular disease prediction. Several machine learning models are evaluated using different feature selection techniques. The best model is identified based on accuracy. The document first discusses heart disease and the challenges of diagnosis. It then provides an overview of several machine learning classification algorithms that have been used for heart disease prediction, including random forest, k-nearest neighbors, logistic regression and naive bayes. The document also discusses the importance of feature selection and cross-validation for evaluating model performance. The goal is to find the machine learning model with the highest accuracy for heart failure prediction.
SVM &GA-CLUSTERING BASED FEATURE SELECTION APPROACH FOR BREAST CANCER DETECTIONijscai
This document summarizes a research paper that proposed a hybrid genetic algorithm and support vector machine (SVM) approach for breast cancer detection and feature selection. The proposed approach uses genetic algorithms to select the optimal features for an SVM classifier. It evaluated this approach on a breast cancer dataset and found that the sequential minimal optimization (SMO) SVM algorithm with genetic feature selection achieved very high accuracy, recall, and F-measure for classifying breast cancer compared to other classification algorithms. The genetic clustering algorithm was also able to accurately cluster the benign and malignant cases in the dataset within 38 seconds. In conclusion, the hybrid genetic algorithm and SVM approach provided an effective and accurate model for breast cancer detection and diagnosis.
Optimized stacking ensemble for early-stage diabetes mellitus predictionIJECEIAES
This paper presents an optimized stacking-based hybrid machine learning approach for predicting early-stage diabetes mellitus (DM) using the PIMA Indian diabetes (PID) dataset and early-stage diabetes risk prediction (ESDRP) dataset. The methodology involves handling missing values through mean imputation, balancing the dataset using the synthetic minority over-sampling technique (SMOTE), normalizing features, and employing a stratified train-test split. Logistic regression (LR), naïve Bayes (NB), AdaBoost with support vector machines (AdaBoost+SVM), artificial neural network (ANN), and k-nearest neighbors (k-NN) are used as base learners (level 0), while random forest (RF) meta-classifier serves as the level 1 model to combine their predictions. The proposed model achieves impressive accuracy rates of 99.7222% for the ESDRP dataset and 94.2085% for the PID dataset, surpassing existing literature by absolute differences ranging from 10.2085% to 16.7222%. The stacking-based hybrid model offers advantages for early-stage DM prediction by leveraging multiple base learners and a meta-classifier. SMOTE addresses class imbalance, while feature normalization ensures fair treatment of features during training. The findings suggest that the proposed approach holds promise for early-stage DM prediction, enabling timely interventions and preventive measures.
ANALYSIS OF PROTEIN MICROARRAY DATA USING DATA MININGijbbjournal
Latest progress in biology, medical science, bioinformatics, and biotechnology has become important and
tremendous amounts of biodata that demands in-depth analysis. On the other hand, recent progress in data
mining research has led to the development of numerous efficient and scalable methods for mining
interesting patterns in large databases. This paper bridge the two fields, data mining and bioinformatics
for successful mining of biological data. Microarrays constitute a new platform which allows the discovery
and characterization of proteins.
Similar to GRC-MS: A GENETIC RULE-BASED CLASSIFIER MODEL FOR ANALYSIS OF MASS SPECTRA DATA (20)
ANALYSIS OF LAND SURFACE DEFORMATION GRADIENT BY DINSAR cscpconf
The progressive development of Synthetic Aperture Radar (SAR) systems diversify the exploitation of the generated images by these systems in different applications of geoscience. Detection and monitoring surface deformations, procreated by various phenomena had benefited from this evolution and had been realized by interferometry (InSAR) and differential interferometry (DInSAR) techniques. Nevertheless, spatial and temporal decorrelations of the interferometric couples used, limit strongly the precision of analysis results by these techniques. In this context, we propose, in this work, a methodological approach of surface deformation detection and analysis by differential interferograms to show the limits of this technique according to noise quality and level. The detectability model is generated from the deformation signatures, by simulating a linear fault merged to the images couples of ERS1 / ERS2 sensors acquired in a region of the Algerian south.
4D AUTOMATIC LIP-READING FOR SPEAKER'S FACE IDENTIFCATIONcscpconf
A novel based a trajectory-guided, concatenating approach for synthesizing high-quality image real sample renders video is proposed . The lips reading automated is seeking for modeled the closest real image sample sequence preserve in the library under the data video to the HMM predicted trajectory. The object trajectory is modeled obtained by projecting the face patterns into an KDA feature space is estimated. The approach for speaker's face identification by using synthesise the identity surface of a subject face from a small sample of patterns which sparsely each the view sphere. An KDA algorithm use to the Lip-reading image is discrimination, after that work consisted of in the low dimensional for the fundamental lip features vector is reduced by using the 2D-DCT.The mouth of the set area dimensionality is ordered by a normally reduction base on the PCA to obtain the Eigen lips approach, their proposed approach by[33]. The subjective performance results of the cost function under the automatic lips reading modeled , which wasn’t illustrate the superior performance of the
method.
MOVING FROM WATERFALL TO AGILE PROCESS IN SOFTWARE ENGINEERING CAPSTONE PROJE...cscpconf
Universities offer software engineering capstone course to simulate a real world-working environment in which students can work in a team for a fixed period to deliver a quality product. The objective of the paper is to report on our experience in moving from Waterfall process to Agile process in conducting the software engineering capstone project. We present the capstone course designs for both Waterfall driven and Agile driven methodologies that highlight the structure, deliverables and assessment plans.To evaluate the improvement, we conducted a survey for two different sections taught by two different instructors to evaluate students’ experience in moving from traditional Waterfall model to Agile like process. Twentyeight students filled the survey. The survey consisted of eight multiple-choice questions and an open-ended question to collect feedback from students. The survey results show that students were able to attain hands one experience, which simulate a real world-working environment. The results also show that the Agile approach helped students to have overall better design and avoid mistakes they have made in the initial design completed in of the first phase of the capstone project. In addition, they were able to decide on their team capabilities, training needs and thus learn the required technologies earlier which is reflected on the final product quality
PROMOTING STUDENT ENGAGEMENT USING SOCIAL MEDIA TECHNOLOGIEScscpconf
This document discusses using social media technologies to promote student engagement in a software project management course. It describes the course and objectives of enhancing communication. It discusses using Facebook for 4 years, then switching to WhatsApp based on student feedback, and finally introducing Slack to enable personalized team communication. Surveys found students engaged and satisfied with all three tools, though less familiar with Slack. The conclusion is that social media promotes engagement but familiarity with the tool also impacts satisfaction.
A SURVEY ON QUESTION ANSWERING SYSTEMS: THE ADVANCES OF FUZZY LOGICcscpconf
In real world computing environment with using a computer to answer questions has been a human dream since the beginning of the digital era, Question-answering systems are referred to as intelligent systems, that can be used to provide responses for the questions being asked by the user based on certain facts or rules stored in the knowledge base it can generate answers of questions asked in natural , and the first main idea of fuzzy logic was to working on the problem of computer understanding of natural language, so this survey paper provides an overview on what Question-Answering is and its system architecture and the possible relationship and
different with fuzzy logic, as well as the previous related research with respect to approaches that were followed. At the end, the survey provides an analytical discussion of the proposed QA models, along or combined with fuzzy logic and their main contributions and limitations.
DYNAMIC PHONE WARPING – A METHOD TO MEASURE THE DISTANCE BETWEEN PRONUNCIATIONS cscpconf
Human beings generate different speech waveforms while speaking the same word at different times. Also, different human beings have different accents and generate significantly varying speech waveforms for the same word. There is a need to measure the distances between various words which facilitate preparation of pronunciation dictionaries. A new algorithm called Dynamic Phone Warping (DPW) is presented in this paper. It uses dynamic programming technique for global alignment and shortest distance measurements. The DPW algorithm can be used to enhance the pronunciation dictionaries of the well-known languages like English or to build pronunciation dictionaries to the less known sparse languages. The precision measurement experiments show 88.9% accuracy.
INTELLIGENT ELECTRONIC ASSESSMENT FOR SUBJECTIVE EXAMS cscpconf
In education, the use of electronic (E) examination systems is not a novel idea, as Eexamination systems have been used to conduct objective assessments for the last few years. This research deals with randomly designed E-examinations and proposes an E-assessment system that can be used for subjective questions. This system assesses answers to subjective questions by finding a matching ratio for the keywords in instructor and student answers. The matching ratio is achieved based on semantic and document similarity. The assessment system is composed of four modules: preprocessing, keyword expansion, matching, and grading. A survey and case study were used in the research design to validate the proposed system. The examination assessment system will help instructors to save time, costs, and resources, while increasing efficiency and improving the productivity of exam setting and assessments.
TWO DISCRETE BINARY VERSIONS OF AFRICAN BUFFALO OPTIMIZATION METAHEURISTICcscpconf
African Buffalo Optimization (ABO) is one of the most recent swarms intelligence based metaheuristics. ABO algorithm is inspired by the buffalo’s behavior and lifestyle. Unfortunately, the standard ABO algorithm is proposed only for continuous optimization problems. In this paper, the authors propose two discrete binary ABO algorithms to deal with binary optimization problems. In the first version (called SBABO) they use the sigmoid function and probability model to generate binary solutions. In the second version (called LBABO) they use some logical operator to operate the binary solutions. Computational results on two knapsack problems (KP and MKP) instances show the effectiveness of the proposed algorithm and their ability to achieve good and promising solutions.
DETECTION OF ALGORITHMICALLY GENERATED MALICIOUS DOMAINcscpconf
In recent years, many malware writers have relied on Dynamic Domain Name Services (DDNS) to maintain their Command and Control (C&C) network infrastructure to ensure a persistence presence on a compromised host. Amongst the various DDNS techniques, Domain Generation Algorithm (DGA) is often perceived as the most difficult to detect using traditional methods. This paper presents an approach for detecting DGA using frequency analysis of the character distribution and the weighted scores of the domain names. The approach’s feasibility is demonstrated using a range of legitimate domains and a number of malicious algorithmicallygenerated domain names. Findings from this study show that domain names made up of English characters “a-z” achieving a weighted score of < 45 are often associated with DGA. When a weighted score of < 45 is applied to the Alexa one million list of domain names, only 15% of the domain names were treated as non-human generated.
GLOBAL MUSIC ASSET ASSURANCE DIGITAL CURRENCY: A DRM SOLUTION FOR STREAMING C...cscpconf
The document proposes a blockchain-based digital currency and streaming platform called GoMAA to address issues of piracy in the online music streaming industry. Key points:
- GoMAA would use a digital token on the iMediaStreams blockchain to enable secure dissemination and tracking of streamed content. Content owners could control access and track consumption of released content.
- Original media files would be converted to a Secure Portable Streaming (SPS) format, embedding watermarks and smart contract data to indicate ownership and enable validation on the blockchain.
- A browser plugin would provide wallets for fans to collect GoMAA tokens as rewards for consuming content, incentivizing participation and addressing royalty discrepancies by recording
IMPORTANCE OF VERB SUFFIX MAPPING IN DISCOURSE TRANSLATION SYSTEMcscpconf
This document discusses the importance of verb suffix mapping in discourse translation from English to Telugu. It explains that after anaphora resolution, the verbs must be changed to agree with the gender, number, and person features of the subject or anaphoric pronoun. Verbs in Telugu inflect based on these features, while verbs in English only inflect based on number and person. Several examples are provided that demonstrate how the Telugu verb changes based on whether the subject or pronoun is masculine, feminine, neuter, singular or plural. Proper verb suffix mapping is essential for generating natural and coherent translations while preserving the context and meaning of the original discourse.
EXACT SOLUTIONS OF A FAMILY OF HIGHER-DIMENSIONAL SPACE-TIME FRACTIONAL KDV-T...cscpconf
In this paper, based on the definition of conformable fractional derivative, the functional
variable method (FVM) is proposed to seek the exact traveling wave solutions of two higherdimensional
space-time fractional KdV-type equations in mathematical physics, namely the
(3+1)-dimensional space–time fractional Zakharov-Kuznetsov (ZK) equation and the (2+1)-
dimensional space–time fractional Generalized Zakharov-Kuznetsov-Benjamin-Bona-Mahony
(GZK-BBM) equation. Some new solutions are procured and depicted. These solutions, which
contain kink-shaped, singular kink, bell-shaped soliton, singular soliton and periodic wave
solutions, have many potential applications in mathematical physics and engineering. The
simplicity and reliability of the proposed method is verified.
AUTOMATED PENETRATION TESTING: AN OVERVIEWcscpconf
The document discusses automated penetration testing and provides an overview. It compares manual and automated penetration testing, noting that automated testing allows for faster, more standardized and repeatable tests but has limitations in developing new exploits. It also reviews some current automated penetration testing methodologies and tools, including those using HTTP/TCP/IP attacks, linking common scanning tools, a Python-based tool targeting databases, and one using POMDPs for multi-step penetration test planning under uncertainty. The document concludes that automated testing is more efficient than manual for known vulnerabilities but cannot replace manual testing for discovering new exploits.
CLASSIFICATION OF ALZHEIMER USING fMRI DATA AND BRAIN NETWORKcscpconf
Since the mid of 1990s, functional connectivity study using fMRI (fcMRI) has drawn increasing
attention of neuroscientists and computer scientists, since it opens a new window to explore
functional network of human brain with relatively high resolution. BOLD technique provides
almost accurate state of brain. Past researches prove that neuro diseases damage the brain
network interaction, protein- protein interaction and gene-gene interaction. A number of
neurological research paper also analyse the relationship among damaged part. By
computational method especially machine learning technique we can show such classifications.
In this paper we used OASIS fMRI dataset affected with Alzheimer’s disease and normal
patient’s dataset. After proper processing the fMRI data we use the processed data to form
classifier models using SVM (Support Vector Machine), KNN (K- nearest neighbour) & Naïve
Bayes. We also compare the accuracy of our proposed method with existing methods. In future,
we will other combinations of methods for better accuracy.
VALIDATION METHOD OF FUZZY ASSOCIATION RULES BASED ON FUZZY FORMAL CONCEPT AN...cscpconf
The document proposes a new validation method for fuzzy association rules based on three steps: (1) applying the EFAR-PN algorithm to extract a generic base of non-redundant fuzzy association rules using fuzzy formal concept analysis, (2) categorizing the extracted rules into groups, and (3) evaluating the relevance of the rules using structural equation modeling, specifically partial least squares. The method aims to address issues with existing fuzzy association rule extraction algorithms such as large numbers of extracted rules, redundancy, and difficulties with manual validation.
PROBABILITY BASED CLUSTER EXPANSION OVERSAMPLING TECHNIQUE FOR IMBALANCED DATAcscpconf
In many applications of data mining, class imbalance is noticed when examples in one class are
overrepresented. Traditional classifiers result in poor accuracy of the minority class due to the
class imbalance. Further, the presence of within class imbalance where classes are composed of
multiple sub-concepts with different number of examples also affect the performance of
classifier. In this paper, we propose an oversampling technique that handles between class and
within class imbalance simultaneously and also takes into consideration the generalization
ability in data space. The proposed method is based on two steps- performing Model Based
Clustering with respect to classes to identify the sub-concepts; and then computing the
separating hyperplane based on equal posterior probability between the classes. The proposed
method is tested on 10 publicly available data sets and the result shows that the proposed
method is statistically superior to other existing oversampling methods.
CHARACTER AND IMAGE RECOGNITION FOR DATA CATALOGING IN ECOLOGICAL RESEARCHcscpconf
Data collection is an essential, but manpower intensive procedure in ecological research. An
algorithm was developed by the author which incorporated two important computer vision
techniques to automate data cataloging for butterfly measurements. Optical Character
Recognition is used for character recognition and Contour Detection is used for imageprocessing.
Proper pre-processing is first done on the images to improve accuracy. Although
there are limitations to Tesseract’s detection of certain fonts, overall, it can successfully identify
words of basic fonts. Contour detection is an advanced technique that can be utilized to
measure an image. Shapes and mathematical calculations are crucial in determining the precise
location of the points on which to draw the body and forewing lines of the butterfly. Overall,
92% accuracy were achieved by the program for the set of butterflies measured.
SOCIAL MEDIA ANALYTICS FOR SENTIMENT ANALYSIS AND EVENT DETECTION IN SMART CI...cscpconf
Smart cities utilize Internet of Things (IoT) devices and sensors to enhance the quality of the city
services including energy, transportation, health, and much more. They generate massive
volumes of structured and unstructured data on a daily basis. Also, social networks, such as
Twitter, Facebook, and Google+, are becoming a new source of real-time information in smart
cities. Social network users are acting as social sensors. These datasets so large and complex
are difficult to manage with conventional data management tools and methods. To become
valuable, this massive amount of data, known as 'big data,' needs to be processed and
comprehended to hold the promise of supporting a broad range of urban and smart cities
functions, including among others transportation, water, and energy consumption, pollution
surveillance, and smart city governance. In this work, we investigate how social media analytics
help to analyze smart city data collected from various social media sources, such as Twitter and
Facebook, to detect various events taking place in a smart city and identify the importance of
events and concerns of citizens regarding some events. A case scenario analyses the opinions of
users concerning the traffic in three largest cities in the UAE
SOCIAL NETWORK HATE SPEECH DETECTION FOR AMHARIC LANGUAGEcscpconf
The anonymity of social networks makes it attractive for hate speech to mask their criminal
activities online posing a challenge to the world and in particular Ethiopia. With this everincreasing
volume of social media data, hate speech identification becomes a challenge in
aggravating conflict between citizens of nations. The high rate of production, has become
difficult to collect, store and analyze such big data using traditional detection methods. This
paper proposed the application of apache spark in hate speech detection to reduce the
challenges. Authors developed an apache spark based model to classify Amharic Facebook
posts and comments into hate and not hate. Authors employed Random forest and Naïve Bayes
for learning and Word2Vec and TF-IDF for feature selection. Tested by 10-fold crossvalidation,
the model based on word2vec embedding performed best with 79.83%accuracy. The
proposed method achieve a promising result with unique feature of spark for big data.
GENERAL REGRESSION NEURAL NETWORK BASED POS TAGGING FOR NEPALI TEXTcscpconf
This article presents Part of Speech tagging for Nepali text using General Regression Neural
Network (GRNN). The corpus is divided into two parts viz. training and testing. The network is
trained and validated on both training and testing data. It is observed that 96.13% words are
correctly being tagged on training set whereas 74.38% words are tagged correctly on testing
data set using GRNN. The result is compared with the traditional Viterbi algorithm based on
Hidden Markov Model. Viterbi algorithm yields 97.2% and 40% classification accuracies on
training and testing data sets respectively. GRNN based POS Tagger is more consistent than the
traditional Viterbi decoding technique.
Pushing the limits of ePRTC: 100ns holdover for 100 daysAdtran
At WSTS 2024, Alon Stern explored the topic of parametric holdover and explained how recent research findings can be implemented in real-world PNT networks to achieve 100 nanoseconds of accuracy for up to 100 days.
Encryption in Microsoft 365 - ExpertsLive Netherlands 2024Albert Hoitingh
In this session I delve into the encryption technology used in Microsoft 365 and Microsoft Purview. Including the concepts of Customer Key and Double Key Encryption.
Securing your Kubernetes cluster_ a step-by-step guide to success !KatiaHIMEUR1
Today, after several years of existence, an extremely active community and an ultra-dynamic ecosystem, Kubernetes has established itself as the de facto standard in container orchestration. Thanks to a wide range of managed services, it has never been so easy to set up a ready-to-use Kubernetes cluster.
However, this ease of use means that the subject of security in Kubernetes is often left for later, or even neglected. This exposes companies to significant risks.
In this talk, I'll show you step-by-step how to secure your Kubernetes cluster for greater peace of mind and reliability.
Alt. GDG Cloud Southlake #33: Boule & Rebala: Effective AppSec in SDLC using ...James Anderson
Effective Application Security in Software Delivery lifecycle using Deployment Firewall and DBOM
The modern software delivery process (or the CI/CD process) includes many tools, distributed teams, open-source code, and cloud platforms. Constant focus on speed to release software to market, along with the traditional slow and manual security checks has caused gaps in continuous security as an important piece in the software supply chain. Today organizations feel more susceptible to external and internal cyber threats due to the vast attack surface in their applications supply chain and the lack of end-to-end governance and risk management.
The software team must secure its software delivery process to avoid vulnerability and security breaches. This needs to be achieved with existing tool chains and without extensive rework of the delivery processes. This talk will present strategies and techniques for providing visibility into the true risk of the existing vulnerabilities, preventing the introduction of security issues in the software, resolving vulnerabilities in production environments quickly, and capturing the deployment bill of materials (DBOM).
Speakers:
Bob Boule
Robert Boule is a technology enthusiast with PASSION for technology and making things work along with a knack for helping others understand how things work. He comes with around 20 years of solution engineering experience in application security, software continuous delivery, and SaaS platforms. He is known for his dynamic presentations in CI/CD and application security integrated in software delivery lifecycle.
Gopinath Rebala
Gopinath Rebala is the CTO of OpsMx, where he has overall responsibility for the machine learning and data processing architectures for Secure Software Delivery. Gopi also has a strong connection with our customers, leading design and architecture for strategic implementations. Gopi is a frequent speaker and well-known leader in continuous delivery and integrating security into software delivery.
In his public lecture, Christian Timmerer provides insights into the fascinating history of video streaming, starting from its humble beginnings before YouTube to the groundbreaking technologies that now dominate platforms like Netflix and ORF ON. Timmerer also presents provocative contributions of his own that have significantly influenced the industry. He concludes by looking at future challenges and invites the audience to join in a discussion.
Why You Should Replace Windows 11 with Nitrux Linux 3.5.0 for enhanced perfor...SOFTTECHHUB
The choice of an operating system plays a pivotal role in shaping our computing experience. For decades, Microsoft's Windows has dominated the market, offering a familiar and widely adopted platform for personal and professional use. However, as technological advancements continue to push the boundaries of innovation, alternative operating systems have emerged, challenging the status quo and offering users a fresh perspective on computing.
One such alternative that has garnered significant attention and acclaim is Nitrux Linux 3.5.0, a sleek, powerful, and user-friendly Linux distribution that promises to redefine the way we interact with our devices. With its focus on performance, security, and customization, Nitrux Linux presents a compelling case for those seeking to break free from the constraints of proprietary software and embrace the freedom and flexibility of open-source computing.
In the rapidly evolving landscape of technologies, XML continues to play a vital role in structuring, storing, and transporting data across diverse systems. The recent advancements in artificial intelligence (AI) present new methodologies for enhancing XML development workflows, introducing efficiency, automation, and intelligent capabilities. This presentation will outline the scope and perspective of utilizing AI in XML development. The potential benefits and the possible pitfalls will be highlighted, providing a balanced view of the subject.
We will explore the capabilities of AI in understanding XML markup languages and autonomously creating structured XML content. Additionally, we will examine the capacity of AI to enrich plain text with appropriate XML markup. Practical examples and methodological guidelines will be provided to elucidate how AI can be effectively prompted to interpret and generate accurate XML markup.
Further emphasis will be placed on the role of AI in developing XSLT, or schemas such as XSD and Schematron. We will address the techniques and strategies adopted to create prompts for generating code, explaining code, or refactoring the code, and the results achieved.
The discussion will extend to how AI can be used to transform XML content. In particular, the focus will be on the use of AI XPath extension functions in XSLT, Schematron, Schematron Quick Fixes, or for XML content refactoring.
The presentation aims to deliver a comprehensive overview of AI usage in XML development, providing attendees with the necessary knowledge to make informed decisions. Whether you’re at the early stages of adopting AI or considering integrating it in advanced XML development, this presentation will cover all levels of expertise.
By highlighting the potential advantages and challenges of integrating AI with XML development tools and languages, the presentation seeks to inspire thoughtful conversation around the future of XML development. We’ll not only delve into the technical aspects of AI-powered XML development but also discuss practical implications and possible future directions.
Removing Uninteresting Bytes in Software FuzzingAftab Hussain
Imagine a world where software fuzzing, the process of mutating bytes in test seeds to uncover hidden and erroneous program behaviors, becomes faster and more effective. A lot depends on the initial seeds, which can significantly dictate the trajectory of a fuzzing campaign, particularly in terms of how long it takes to uncover interesting behaviour in your code. We introduce DIAR, a technique designed to speedup fuzzing campaigns by pinpointing and eliminating those uninteresting bytes in the seeds. Picture this: instead of wasting valuable resources on meaningless mutations in large, bloated seeds, DIAR removes the unnecessary bytes, streamlining the entire process.
In this work, we equipped AFL, a popular fuzzer, with DIAR and examined two critical Linux libraries -- Libxml's xmllint, a tool for parsing xml documents, and Binutil's readelf, an essential debugging and security analysis command-line tool used to display detailed information about ELF (Executable and Linkable Format). Our preliminary results show that AFL+DIAR does not only discover new paths more quickly but also achieves higher coverage overall. This work thus showcases how starting with lean and optimized seeds can lead to faster, more comprehensive fuzzing campaigns -- and DIAR helps you find such seeds.
- These are slides of the talk given at IEEE International Conference on Software Testing Verification and Validation Workshop, ICSTW 2022.
DevOps and Testing slides at DASA ConnectKari Kakkonen
My and Rik Marselis slides at 30.5.2024 DASA Connect conference. We discuss about what is testing, then what is agile testing and finally what is Testing in DevOps. Finally we had lovely workshop with the participants trying to find out different ways to think about quality and testing in different parts of the DevOps infinity loop.
Observability Concepts EVERY Developer Should Know -- DeveloperWeek Europe.pdfPaige Cruz
Monitoring and observability aren’t traditionally found in software curriculums and many of us cobble this knowledge together from whatever vendor or ecosystem we were first introduced to and whatever is a part of your current company’s observability stack.
While the dev and ops silo continues to crumble….many organizations still relegate monitoring & observability as the purview of ops, infra and SRE teams. This is a mistake - achieving a highly observable system requires collaboration up and down the stack.
I, a former op, would like to extend an invitation to all application developers to join the observability party will share these foundational concepts to build on:
A tale of scale & speed: How the US Navy is enabling software delivery from l...sonjaschweigert1
Rapid and secure feature delivery is a goal across every application team and every branch of the DoD. The Navy’s DevSecOps platform, Party Barge, has achieved:
- Reduction in onboarding time from 5 weeks to 1 day
- Improved developer experience and productivity through actionable findings and reduction of false positives
- Maintenance of superior security standards and inherent policy enforcement with Authorization to Operate (ATO)
Development teams can ship efficiently and ensure applications are cyber ready for Navy Authorizing Officials (AOs). In this webinar, Sigma Defense and Anchore will give attendees a look behind the scenes and demo secure pipeline automation and security artifacts that speed up application ATO and time to production.
We will cover:
- How to remove silos in DevSecOps
- How to build efficient development pipeline roles and component templates
- How to deliver security artifacts that matter for ATO’s (SBOMs, vulnerability reports, and policy evidence)
- How to streamline operations with automated policy checks on container images
Enchancing adoption of Open Source Libraries. A case study on Albumentations.AIVladimir Iglovikov, Ph.D.
Presented by Vladimir Iglovikov:
- https://www.linkedin.com/in/iglovikov/
- https://x.com/viglovikov
- https://www.instagram.com/ternaus/
This presentation delves into the journey of Albumentations.ai, a highly successful open-source library for data augmentation.
Created out of a necessity for superior performance in Kaggle competitions, Albumentations has grown to become a widely used tool among data scientists and machine learning practitioners.
This case study covers various aspects, including:
People: The contributors and community that have supported Albumentations.
Metrics: The success indicators such as downloads, daily active users, GitHub stars, and financial contributions.
Challenges: The hurdles in monetizing open-source projects and measuring user engagement.
Development Practices: Best practices for creating, maintaining, and scaling open-source libraries, including code hygiene, CI/CD, and fast iteration.
Community Building: Strategies for making adoption easy, iterating quickly, and fostering a vibrant, engaged community.
Marketing: Both online and offline marketing tactics, focusing on real, impactful interactions and collaborations.
Mental Health: Maintaining balance and not feeling pressured by user demands.
Key insights include the importance of automation, making the adoption process seamless, and leveraging offline interactions for marketing. The presentation also emphasizes the need for continuous small improvements and building a friendly, inclusive community that contributes to the project's growth.
Vladimir Iglovikov brings his extensive experience as a Kaggle Grandmaster, ex-Staff ML Engineer at Lyft, sharing valuable lessons and practical advice for anyone looking to enhance the adoption of their open-source projects.
Explore more about Albumentations and join the community at:
GitHub: https://github.com/albumentations-team/albumentations
Website: https://albumentations.ai/
LinkedIn: https://www.linkedin.com/company/100504475
Twitter: https://x.com/albumentations
Essentials of Automations: The Art of Triggers and Actions in FMESafe Software
In this second installment of our Essentials of Automations webinar series, we’ll explore the landscape of triggers and actions, guiding you through the nuances of authoring and adapting workspaces for seamless automations. Gain an understanding of the full spectrum of triggers and actions available in FME, empowering you to enhance your workspaces for efficient automation.
We’ll kick things off by showcasing the most commonly used event-based triggers, introducing you to various automation workflows like manual triggers, schedules, directory watchers, and more. Plus, see how these elements play out in real scenarios.
Whether you’re tweaking your current setup or building from the ground up, this session will arm you with the tools and insights needed to transform your FME usage into a powerhouse of productivity. Join us to discover effective strategies that simplify complex processes, enhancing your productivity and transforming your data management practices with FME. Let’s turn complexity into clarity and make your workspaces work wonders!
2. 16 Computer Science & Information Technology (CS & IT)
classifiers have the unique ability to provide very meaningful outcomes. However, unfortunately,
rules-based classifiers do not achieve the quality required for analysis of MS data.
In this paper, we propose an efficient and meaningful approach that uses Genetic Algorithms
(GAs), namely GRC-MS, to select features and then build a rule-based classification model with
the objective of classifying and understanding MS data. We also test our proposed approach on a
real dataset of ovarian cancer patients in order to measure the accuracy of the proposed approach.
The proposed approach is intended to be a general framework that can be used for the analysis of
any MS data or related continuous data. To the best of our knowledge, the combination of rule-
based classifiers with GAs as the feature selection technique has not yet been applied to MS data.
This paper is organized as follows: Section 2 provides a background about the MS techniques:
preprocessing, some feature selection, and classifiers that are used for MS data. Section 3refers to
some of the studies that use GA technique as a feature selection approach for MS data. In
addition, it summarizes some of the studies that use rule base techniques as classifiers for MS
data. Section 4 explains the steps of our proposed approach, GRC-MS. The experimental setup
and results on a real dataset are presented in Section 5.Section 6, discuss the results. Finally,
Section 7 concludes the paper and discusses future work.
2. BACKGROUND
Mass spectrometry (MS) is a recently developed technique that is used to identify, analyze, and
determine the elements, molecules, and atomic structures of any given sample [3]. MS quickly
and accurately determines the relative numbers of molecules present in complex biological or
chemical samples by transforming these samples into ions, detecting their mass-to-charge ratios
(m/z), and then measuring the intensity of each ion type [4]. This technique is used primarily to
study the effects of ionizing energy on sample molecules [3]. It has several beneficial
characteristics, such as speed and sensitivity. Moreover, because MS has a variety of possible
applications, it is preferable to other analytical methods and, as a result, has progressed rapidly
over the last decade. Today, MS is used in a number of applications, such as biochemical
problems, pollution control, atomic physics, food control, forensic science, reaction kinetics,
geochronology, inorganic chemical analysis, process monitoring, and so on [4].
2.1 Proteomics
Proteomics, a term that is first coined by Australian scientist Marc Wilkins in 1994, is an
emerging area in bioinformatics [7]. It provides information about proteins and their interactions
in the human body. The major aim of most proteomic studies is the detection of proteins of
interest, which are known as biomarkers. The term “biomarkers” refers to protein molecules that
facilitate the detection of a particular cell type and that identify cell characteristics, such as cells’
ability to perform their functions. [8]. The discovery of biomarkers in MS data is useful for the
early diagnosis of diseases. Most researchers hope to discover novel and powerful diagnostic
proteomic tools to detect these biomarkers [8]. Recently, several techniques have been developed
for analyzing bodily fluids, such as human serum, human urine, and, in some studies, tumor
tissue, to achieve protein profiling. Commonly, the analysis of body fluids is accomplished using
MS techniques [9]. Two major techniques are intended for proteomic analysis: MALDI and
SELDI. MALDI-TOF MS is a new and widely used technique for discovering biomolecules,
such as proteins with molecular masses between 400 and 350000 Da, in samples [6].
3. Computer Science & Information Technology (CS & IT) 17
2.2 Mass Spectrometry
MS experiments are generally conducted in three main stages: the data generation stage, the data
preprocessing stage, and the data analysis stage [4] [5]. In the first stage, MS techniques generate
data that are represented as a huge sequences of pairs, called matrix, spectrum, or MS data [4].
This spectrum contains mass-to-charge ratio values and intensity values [6]. The mass-to-charge
ratio values (which are represented on the x-axis) depend on the molecular mass detected in the
sample, and the intensity values (which are represented on the y-axis) depend on the quantity of
molecules detected in the sample (Figure 1) [6]. Depending on the resolution of the MS
technique, a spectrum can contain hundreds or thousands of pair values [7]. Data preprocessing
involves cleaning the data and improving their quality. On the other hand, during data analysis,
data mining or pattern extraction techniques are applied to extract knowledge.
Figure 1. Output signals from a mass spectrometer consisting of m/z and intensity values [9].
2.3 Data Mining in Mass Spectrometry
Data mining is a well-known approach that is used in science and business to extract useful
information from large and complex datasets [7][2]. The steps involved in data mining include
(Figure 2) data preparation, feature selection, model development (or pattern recognition), and
model assessment. The following section focuses on the basic algorithms used in data mining for
application to mass proteomic data. However, as previously mentioned, MS data are high in
dimensionality, and they cannot be analyzed through the direct use of data mining techniques.
Preprocessing the MS data is a crucial step in improving the data quality—and, thus, improving
the quality of the classifier algorithms [6].
Preprocessing MS Data
MS data or spectra are commonly influenced by errors or noise that occur during the sample
preparation or the insertion into the device or by noises generated by the device itself [4]. Using
the raw MS data directly for the analysis process is not effective because contaminants like noise,
m/z measurement errors, and matrix size affect the results [6] [7]. In addition, because of the
dimensional complexity of the spectra, efficient results cannot be obtained through the direct
application of data mining algorithms or pattern extraction techniques. Therefore, cleaning the
MS data is critical. To achieve clean data, different preprocessing techniques are applied to the
MS data before the application of any data mining technique such as reducing noise and
4. 18 Computer Science & Information Technology (CS & IT)
smoothing data, normalization, data reduction by binning, peak extraction, and peak alignment.
These techniques can be used alone or in combination [10].
Figure 2. Typical flowchart of the critical steps in data mining and examples of the techniques available for
MS data analysis.
Feature Selection Techniques
The MS technique produces high-dimensional data. Compared to the number of samples, a
greater number of peaks needs to be analyzed (high features-to-sample ratio datasets) [11]. Most
of the problems in analyzing data stem from the size and the complexity of the datasets that are
represented in tables of rows and columns. Rows represent records or cases, and columns
represent data dimensions, features, and attributes [7]. In the analysis of MS data, the extraction
uses the intensity of every peak in the spectrum as a feature. The number of features (or peaks) is
usually large (e.g., 17,000 peaks), while the number of samples is usually small (e.g., 140
patients) [12]. However, features often contain noise with a very little or no informational value.
Thus, it is necessary to select features from a large set of those likely to be useful in predicting the
outputs of interest. To solve this problem, after the data is pre-processed, a feature selection phase
step is performed. This step aims to detect the main parts of the spectrum that might provide a
5. Computer Science & Information Technology (CS & IT) 19
better understanding of the data’s important features, which could be used in the analysis phase
[11].
Feature selection techniques can be divided into three categories [12]: filter, wrapper, and
embedded. The filter technique analyzes each feature independently and eliminates features one
at a time based on how they correlate with the target. Feature subsets are selected based on
evaluation criterion, such as information gains. This is a simple and quick process that is
sometimes referred to as independent feature selection. Moreover, filter selection methods are
relatively computationally efficient [11] [12]. Examples of independent feature selection
techniques used with MS or high-dimensional data include: statistical tests (i.e., t-tests [13] [14],
Wilcoxon tests [17], χ2 tests [18]), information gains [19], and so on. The wrapper techniques
simultaneously analyze features in groups or subsets and build the analysis model [11] [12].
Classifiers are used to assess (several) features or feature subsets. Although the process is
computationally busy and potentially very time-consuming, since this technique typically requires
an evaluation of every scheme at every iteration, it discovers critical information that is typically
lost in independent features analysis [16] [20]. Examples of wrapper feature selection techniques
that are used with MS or high-dimensional data include: genetic algorithms [21] [22], sequential
searches [23], and estimations of distribution algorithms [24]. In embedded techniques, the search
for a best set of features is made into the classifier construction. They learn which set of features
can best contribute to the accuracy during the creation of the model [12]. These techniques make
no distinction between learning and feature selection. Embedded techniques have the advantage
of including the interactions with the classification model, while simultaneously being far less
computationally intensive than wrapper methods [12]. Examples of embedded feature selection
techniques that can be used with MS or high-dimensional data include random forest techniques
[25] and weight vector support vector machine techniques [26].
Classifiers and Decision Models for MS Data
For MS Data, usually classification or supervised learning uses to predict or classify new cases.
Where, previous knowledge about classes can be used to classify new cases. The previous
knowledge is built using a training dataset, which includes input values and their output classes.
In the training stage, the training dataset is used to define how the features are to be selected and
combined to distinguish among the different classes. In the testing stage, the weighted features
are applied to classify a new test dataset. The test dataset’s class is not known, and the dataset has
never before been seen by the model. If the model classifies new cases correctly, it is a good
model. A wide range of algorithms, such as decision tree algorithms, SVMs, ANNs, and so on,
have been developed for classification. In this subsection, we well indicate to some of well-
known classifiers that used for MS data.
i. iDecision Tree (DT) Classifier
Decision tree (DT) a hierarchical tree structure model that is described as a set of rules, presented
in a visual form that is very easy to understand. The DT was used by Vlahou et al. [28] to
analyze the MS data and it is achieved 80% accuracy in discriminating between ovarian cancer
patients and healthy controls. In addition, Su et al. [29] used DT to analyze the MS data and they
obtained 85.3% accurate.
6. 20 Computer Science & Information Technology (CS & IT)
ii. Artificial Neural Networks (ANNs) Classifier
Artificial neural networks (ANNs) are another popular classifier used in MS data analysis. Ward
et al. [13] used an ANN algorithm to analyses non-cancer and colorectal cancer samples via
SELDI to identify colorectal cancer biomarkers. The ANNs with the seven highest peaks obtained
95% sensitivity and 91% specificity. Also, Chen et al. [30] used ANNs to diagnosis colorectal
cancer. The proposed approach obtained 91% sensitivity and 93% specificity.
iii. Naive Bayesian (NB) Classifier
The naive Bayesian is “a simple probabilistic classifier based on the Bayesian theorem with the
(naive) independence assumption” [31]. Zheng [31] compared the performance of the naïve
Bayesian (NB) and the logistic regression (LR) on MS data. They found the average performance
of the NB (around 90%) and the logistic regression depended on the amount of training data.
iv. Support Vector Machine (SVM) Classifier
Support vector machines (SVMs) attempt to find the best hyperplane line that separates all class
A data points from class B data points. Wagner et al. [32] found that the linear SVM was the only
classification method that obtained robust performance (98% accuracy). Also, Prados et al. [19]
achieved 97% sensitivity and 71% specificity when used SVM-based model to classify MS data.
Performance Assessment of Models
The last stage of the data mining modeling process is the assessment or validation of the model.
Below, we will discuss the measures of accuracy, sensitivity, and specificity.
The classification of accuracy is calculated by “comparing the ratio of the number of correctly
classified samples to the total number of samples in the test data” [33]. However, when the spread
of a certain class is greater than that of other classes, the majority class will create unequal
results. In this scenario, the accuracy measure will not be true. Most MS data analysis studies
have used accuracy to report their results [33] [34].
There are four possible results when test decisions are built for data with two class samples: true-
positive, true-negative, false-positive, and false-negative [33]. The true-positive rate is known as
sensitivity. It represents the ratio of the number of correctly classified positive samples to the total
number of positive samples. When the effect of incorrectly predicting a diseased person as
healthy is high, high sensitivity is preferred in medical diagnoses. Specificity refers to the false-
positive rate, or the probability that a healthy subject will be incorrectly classified as unhealthy
[14]. When a false alarm would result in unwanted tests or treatments, high specificity is
desirable here [7]. In very good classification, both sensitivity and specificity should be high,
though different levels of these measures are accepted depending on the application. However, it
is very hard to compare the results of different studies using only measures of sensitivity and
specificity [33].Up to our knowledge, many approaches failed to achieve high accuracy. Even
when high accuracy is obtained, the “black box” nature of these proposed approaches is a major
issue. To address this problem and to build an accurate and understandable model, we propose to
use a rule-based classifier approach along with using GAs for feature selection.
7. Computer Science & Information Technology (CS & IT) 21
3. LITREATURE REVIEW
In this section, we explore some of the studies that use GA technique for feature selection on MS
data. In addition, we illustrate some studies that use rule-based techniques as a classifier on
spectrum data with classifiers.
A. Genetic Algorithm Based Feature Selection for MS Data
One popular algorithm that isused for feature selection purpose is a genetic algorithm (GA). A
GA searches for optimal MS data features or biomarkers to use in the mining stage in order to
distinguish patients from controls in an accurate way. Here wediscuss GA as a feature selection
approach for MS data. Many studies have used GA for feature selection before applying a
classifier. In 2009, Reynès et al. [35] developed a new model using a GA for feature selection and
a very simple tree as a classifier. The GA in this model sought to choose a set of interesting
features in a spectrum to achieve the best split points in the tree. First, the authors applied
preprocessing steps to the dataset. The dataset contained 162 ovarian cancer samples and 91
control samples. Of these, 46 control samples and 81 cancer samples were randomly chosen for
use as a training set; the rest (45 control and 81 cancer samples) were later used for testing. The
authors obtained 98% accuracy after building the tree with three different peaks (245 Da, 434 Da,
and 649 Da). The major issue in this technique when GAs return large numbers of features the
DT become large and difficult to understand.
In 2004, Mohamad et al. [36] proposed a new model for applying a GA to seek and identify
potential informative features using an SVM classifier. Experimental results on a breast cancer
dataset (which contained 200 samples for training and 77 samples for testing) and a leukemia
cancer dataset (which contained 38 samples for training and 34 samples for testing) showed the
usefulness of the proposed approach for low- and high-dimension data. The authors obtained 82%
accuracy for the breast cancer dataset, with 8 features, and 100% accuracy for the leukemia
cancer dataset, with 50 features. In 2004, Li et al. [37] proposed a novel model used a GA for the
feature selection stage and an SVM method as a classifier. The MS dataset used included 91
control samples and 162 samples from patients with ovarian cancer. Both feature selection
approaches (filter and wrapper) were explored. The results showed 98% accuracy the proposed
model was applied with a filter approach.
In 2002, Petricoin et al. [38] used GA for feature selection with a cluster algorithm. The proposed
algorithm was applied to a training set containing 50 ovarian cancer samples and 66 control
samples. The authors obtained a sensitivity of 100%, a specificity of 95%, and a rounded
accuracy of 94%.In 2007 Shah and Kusiak [39] proposed a model using GA for feature selection
and DT and SVM as classifiers. They applied the proposed model to three different datasets for
ovarian cancer, prostate cancer, and lung cancer. The proposed model had high classification
accuracy when applied to the ovarian cancer and lung cancer dataset, such that it was able to
recognize the most significant features. Table1 below summarizes some of the relevant research
in this field that used genetic algorithm as feature selection for mass spectrum data.
After we review some studies that using GAs for feature selection in the analysis of MS data we
found that most approaches obtained a very good accuracy results. However, there are some
major challenges. For example, there is no guarantee that GAs will always simultaneously find
the best solution and in the same time the minimum number of discernment features. When a GA
8. 22 Computer Science & Information Technology (CS & IT)
obtains a large number of features, there will be problems using certain classifiers, such as DTs.
In such cases, DTs may become very large, complex, and difficult for experts to understand.
Some researchers have tried to solve this problem by adding constraints to the GA. This was the
case in [39], in which the authors repeated the selection process when the number of selected
features was more than 100; however, this process took a long time. Moreover, in [35], the
authors added a constant to the fitness function to help it select the fewest number of features
possible. However, the constant did not always work in obtaining a minimal number of features.
Table.1. Some of the research using GAs as features selection for analysis MS data
Author(s)
Year
disease
Data
Feature
Selection
Mothed
DataMining
Algorithm
Result
Reynès et
al. [35]
2009
Ovarian
Cancer
253 ovarian cancer serum
samples.
162 samples from patients
with ovarian cancer and 91
samples from healthy
patients.
GeneticAlgorithm
DT
98%
Accuracy
Mohamad
et al. [36]
2004
Breast
Cancer
200 training samples and
77 test samples.
SVM
82%
Accuracy.
Leukemia
Cancer 38 training samples and 34
test samples.
100%
Accuracy.
Li et al. [37] 2004
Ovarian
Cancer
253 ovarian cancer serum
samples.
162 samples from patients
with ovarian cancer and 91
samples from healthy
patients.
SVM
98%
Accuracy
Petricoin et
al. [38]
2002
Ovarian
Cancer
216 ovarian cancer serum
samples.
100 training samples and
116 test samples.
Cluster
94%
Accuracy
9. Computer Science & Information Technology (CS & IT) 23
Shah and
Kusiak [39]
2007
Ovarian
Cancer
253 serum samples.
135 training samples and
118 test samples.
DT
and
SVM
DT:
94.07%
Accuracy
SVM:
97.46%
Accuracy.
Prostate
Cancer
136 serum samples.
102 training samples and
34 test samples.
DT:
55.88%
Accuracy
SVM:
67.65%
Accuracy.
Lung
Cancer
181 serum samples.
32 training samples and 149
test samples.
DT:
81.88%
Accuracy
SVM:
98.66%
Accuracy.
After excluding all 100% accurate results due to the high chance of over-fitting, we found that the
best accuracy achieved was 98.66%, which was obtained by the SVM classifier. Thus, we seek to
obtain a better accuracy than this one, while simultaneously building a classifier that is easy to
understand. We propose the use of a rule-based classifier, which can be understandable even
when GAs return large numbers of features. This is because a rules-based classifier is easier to
understandable than a DT, especially with higher numbers of features. Finally, we also seek to
obtain higher classifier accuracy than that achieved by the SVM.
B. Rule-Based Classifier models for MS Data
Several machine-learning classifiers, such as DTs, SVMs, and K-nearest neighbor classifiers,
have been used to successfully classify MS data. These have all achieved high predictive
accuracy. However, the black-box nature of these classifiers presents major issues for developers
[40] [41]. By contrast, the IF-THEN rule-based classifier can obtain satisfactory predictive
accuracy, while also being easier to describe and interpret by humans than other classifiers, due to
its readable IF-THEN rule structure [42]. The challenge is the extraction of a small, accurate and
easy-to-interpret sets of IF-THEN rules from high-dimensional MS data. In the following, we will
review various studies that have used IF-THEN rule classifiers to classify of MS data. We will
then discuss these papers in order to provide a simple introduction for the development of this
type of classifier.
In 2006, Ressom et al. [41] proposed a novel classifier for classifying MS data using a fuzzy IF-
THEN rule-based structure. For feature selection, the authors used ant colony optimization
10. 24 Computer Science & Information Technology (CS & IT)
(ACO) with an SVM. They hoped that the combination of these two methods in the feature
selection step would improve the quality of the potential biomarker identification and build an
accurate fuzzy IF-THEN rules classifier. The authors collected 150 serum samples of
hepatocellular carcinoma (HCC) diseases that were taken from Egypt between 2000 and 2002. Of
these, 78 samples were taken from patients with HCC, and 72 samples were taken from normal
individuals. After they preprocessed the samples, the authors selected 100 samples randomly as a
training set, including 50 samples from the HCC patients and 50 samples from the healthy
individuals. The remaining samples (28 from the HCC patients and 22 from healthy individuals)
were used as a testing set for performance evaluation. The authors applied a combination of ACO
and SVM to extract useful biomarkers in the feature selection stage. They found six m/z
candidate biomarkers, as follows: 1863.4-1871.3, 2528.7- 2535.5, 933.6-938.2, 1737.1-1744.6,
4085.6-4097.9, and 1378.9-1381.2 Da. These six m/z candidate biomarkers were used as inputs to
the IF-THEN rules classifier. The prediction accuracy of this classifier was estimated using a
four-fold cross-validation method. Then, the authors used the ACO algorithm to select four rules
from among the 4095 candidate rules extracted from the training dataset with the candidate
biomarkers. The IF-THEN rules distinguished HCC patients from controls in the testing dataset
with 91% sensitivity and 89% specificity.
Assareh and Moradi [43] proposed a model that used a t-test to select the best features and a IF-
THEN rules classifier to classify the MS datasets. The dataset was for ovarian cancer, and it was
made available to the public through the American National Cancer Institute (NCI) website. The
ovarian cancer dataset contained 253 samples, of which 91 samples came from healthy
individuals and 162 came from ovarian cancers patients. Before addressing these datasets, the
authors used preprocessing to clean the datasets to enhance the classifier’s performance. They
binned all of the M/Z points as candidate biomarkers and applied a t-test to select the best
candidate biomarkers. The t-test eliminated the biomarkers that were locally correlated, since
these could correspond to the same peptide. The authors found three m/z candidate biomarkers.
The proposed method achieved acceptable accuracy (86.93%) compared to two classification
methods: LDA (74.24%) and KNN (68.18%).
In 2011, Wang and Palade [44] proposed a new Multi-Objective Evolutionary Algorithms-based
Interpretable Fuzzy (MOEAIF) model. This model used Fuzzy C-Mean Clustering-based
Enhanced Gene Selection (FCCEGS) for feature selection with fuzzy IF-THEN rules to analyze
high-dimensional data, such as microarray gene expressions and MS data. The proposed model
was evaluated on proteomics mass spectroscopy data from an ovarian cancer dataset containing
253 samples (91 from healthy individuals and 162 from ovarian cancer patients). Some
preprocessing steps were applied to the dataset. The authors extracted eight fuzzy IF-THEN rules
from the dataset (average rule length of two) using six candidate biomarkers. The candidate
biomarker MZ6880.2 and the feature MZ18871.5 played important roles in most of the rules.
This proposed MOEAIF model achieved 63.75% accuracy. Table 2 below summarizes some of
the relevant research in this field.
In reviewing the various research papers using rule-based classifier to analyze MS data, we found
that the research related to these rule-based classifiers was still very active. Various researchers
had tried to improve the black-box problem of most classifiers while simultaneously achieving
high predictive accuracy. Each paper proposed a model for obtaining a certain number of IF-
THEN rules that would be easy for experts to understand and manipulate. However, the major
challenge is improving rule accuracy by finding the best set of features. Several authors have
11. Computer Science & Information Technology (CS & IT) 25
attempted to use different feature selection methods; however, up to our knowledge, none has
achieved a higher classification accuracy.
Table 2. Research using IF-THEN rules as classifiers for the analysis of MS data.
4. GENETIC-RULE-BASED CLASSIFIER MODEL FOR MS DATA (GRC-
MS): A PROPOSED APPROACH
Given MS datasets of any diseases, the GRC-MSmodel has the following input and output:
Input: MS data obtain from controls (healthy individuals) and patients.
Output: A set of rules expressed as: I⇒C, where I refers to a set of features or biomarkers and C
refers to a class label (i.e., healthy or patient).
Author(s)
Year
Diseases
Data
Features
Selection
Method
DataMining
Algorithm
Result
Ressom
et al.
[41]
2006 HCC
150 serum samples of
HCC diseases
78 samples from
patients with HCC and
72 samples from healthy
patients
ACO-SVM
algorithm
IF-THENRule-Based
91%
sensitivity
and 89%
specificity
Assareh
and
Moradi
[43] 2007
Ovarian
cancer
253 ovarian cancer
serum samples.
162 samples from
patients with ovarian
cancer and 91 samples
from healthy patients
T-test
86.93%
Accuracy
Wang
and
Palade
[44]
2011 Ovarian
cancer
253 ovarian cancer
serum samples.
162 samples from
patients with ovarian
cancers and 91 samples
from normal.
FuzzyC-Mean
Clusteringbased
EnhancedGene
Selectionmethod
(FCCEGS)
63.75 %
Accuracy
12. 26 Computer Science & Information Technology (CS & IT)
Figure 3. Steps of the GRC-MS model
The steps of the GRC-MSmodel are shown in Figure 3. The details of each step are explored in
the following subsections:
STEP 1: Preprocess Raw MS Data
Each point on a spectrum is represented by two measurements: m/z and the intensity value.
Sometimes, these points are affected or distorted by noise. Thus, preprocessing is needed to clean
the MS data of noise and contaminants [9]. In addition, the preprocessing step must reduce or
decrease the dimensions of the spectrum; this is important later for obtaining an efficient
algorithm [33]. In this model, to correct the m/z and intensity values, we use the following steps:
(A) Reduce Noise and Amount of Data and (B) Make Spectra Comparable.
A. Reduce Noise and Amount of Data
To remove a chemical noise baseline from a spectrum without harming the data is a challenging
problem, since the wrong baseline correction may damage the spectrum, resulting in the wrong
peak shape, peak position, or peak width [10]. We will use a function to estimate a low-frequency
baseline. Then, we will subtract this baseline from the spectrum. Figures 4 show how the function
corrects the baseline. These examples were taken from real dataset (ovarian cancer dataset) before
and after the baseline’s removal.
13. Computer Science & Information Technology (CS & IT) 27
Figure 4. (A)Before baseline correction and (B) After baseline correction.
To remove electrical noise, it is important to know that spectra usually contain a combination of
noises and signals. Thus, a spectrum must be de-noised to improve the validity and precision of
the observed m/z values of the spectrum peaks. To accomplish this, we use Lowess smoothing
and polynomial filters.
B. Make Spectra Comparable
Normalization of spectra is needed to make MS data independent of experimental differences.
Normalization enables us to compare different samples, since the peak values of different
spectrum fractions may be incomparable [19]. In this model, we will use the direct normalization
function to calculate a re-scaled intensity value as needed. In addition, to make spectra
comparable, peak alignment determines which peaks from the different spectra samples
correspond to the same peak. For this, we use a sample alignment function that allows us to use a
dynamic programming algorithm to assign the observed peaks in each spectrogram to the
common mass/charge reference vector, if needed.
STEP 2: Use Genetic Algorithms for Features Selection
After the data preprocessing, we implement a feature selection stage, which seeks to achieve
better understanding of the important features of the MS data in order to improve the
classification phase later. In our model, we use GAs, which try to find optimal search solutions
for problems with large datasets. Running on MS data, GAs attempt to find small sets of
biomarkers that separate patient cases from control cases. This set of biomarkers, or features, is
called a chromosome, such that every biomarker corresponds to a biological sample’s
14. 28 Computer Science & Information Technology (CS & IT)
measurements at a given m/z value (Masse). Each chromosome is evaluate by a fitness function
that attempts to find the best chromosome (set of biomarkers) for separating patients from
controls. GA follows the steps outlined below:
A. Encoding Solutions (choose from initial chromosome, generation, and population)
Each “chromosome” (i.e., mathematical entity, not biological) consists of d different biomarkers
or features (called genes) that are initially randomly selected from all features (since most studies
used all of the MS data as features after the preprocessing steps).
B. Determine Fitness of Population
The fitness value of each chromosome is determined by the chromosome’s ability to classify the
training set samples into patient and control groups. In our model, we will use to compute fitness
values:
Fitness value = a posteriori probability + Error rate of a linear classifier.
Note: Repeat from Step C to Step G until terminated.
C. Selection Operator (select parents from population)
The chromosome with the best fitness value is entered into the next generation, and the remaining
positions are filled according to the relative fitness of the chromosomes in the parent generation
(probabilistically). There are many methods for selecting the best chromosomes; we are use the
roulette wheel selection method, in which the parents are selected according to their fitness.
Chromosomes with greater fitness will be selected more times. Thus, the better a chromosome’s
fitness score, the greater its chances of being selected will be.
D. Crossover Operator (perform crossover on parents to create the new population)
The crossover can be applied to either single or double points. Each gene has an equal chance of
coming from either parent. Our model use single-point and fraction crossovers to determine the
fraction of the next generation population created by the crossover function.
E. Mutation Operator (perform mutation of population)
When a chromosome is chosen for transmission to the next generation, a small number of genes
are randomly selected for mutation (with probabilities between 0 and 1). Once the number of
genes in the chromosome to be mutated has been determined, these genes are randomly selected
and replaced with genes that are not already in the chromosome. In our model, we use uniform
mutation.
F. Determine the Fitness of the New Population.
G. Check for Termination Criteria.
The process is terminate when a stopping criterion, such as a specific number of high
chromosomes, a maximum number of generations, or a fitness value of 100%, is obtained. We
15. Computer Science & Information Technology (CS & IT) 29
use the average relative change in the best fitness function value over generations is less than or
equal certain value or maximum number of generations is reached.
H. Frequent Masses Analysis
Frequency with which masses were select is then analyze. Then, using different number of
masses form top frequency masses many times to dement best number of masses set which gives
best rules accuracy.
STEP 3: Build an IF-THEN Rule-based Classifier
The IF-THEN rule-based classifier is built from training data using only the top selected features.
Then, the IF-THEN rule-based classifier is used to predict the class label (i.e., healthy or patient)
for the MS test data. The IF-THEN classification rule is as follows:
R: IF condition (C), THEN Class (C).
Example.
R1: “If biomarker 1 is less than threshold 1 and biomarker 2 is greater than threshold 2 and
biomarker 3 is less than threshold 3, then the sample belongs to the patient group.”
R2 is “If biomarker 1 is greater than threshold 1 and biomarker 2 is less than threshold 2, then the
sample belongs to the healthy group.”
The LHS represent the rule condition; it is a conjunction of feature tests (biomarkers).
The RHS denotes the rule consequent or the class label (healthy or patient).
In our work, we will build an IF-THEN rule-based classifier from a DT. In comparing the IF-
THEN rule-based classifier with the decision tree, we found that the IF-THEN rule-based
classifier was easier for humans to understand, especially when the DT was very huge. Then, we
will assess each IF-THEN rule using rule coverage and accuracy. The Rule Ordering Scheme
(i.e., Rule-Based Ordering) will then be apply. In this scheme, rule priorities are determined
beforehand, and a decision list is built. This list is order according to rule quality (accuracy and
coverage). The match rule that appears at the beginning of the list has the highest priority. In the
event that no rule is satisfied by X, a default rule will be define for a default class, based on the
training set. This class then becomes the majority class of the MS sample, encompassing all
instances that are not cover by rules.
5. CASE STUDY AND RESULTS
In order to test and evaluate the accuracy of oGRC-MS model and to ensure that its rules are
understandable, we apply the GRC-MS model to real data using MATLAB® software.
5.1 Dataset
We rely on open-source an MS dataset of ovarian cancer that is available to public through the
clinical proteomics program of the National Cancer Institute (NCI) website(http://home.ccr.
cancer.gov/ncifdaproteomics/ppatterns.asp). This dataset is labeled “Ovarian 8-7-02”. The WCX2
protein chip was used to produce this dataset. To generate the spectrum from the samples, the
16. 30 Computer Science & Information Technology (CS & IT)
upgraded PBSII SELDI-TOF mass spectrometer was used. The dataset includes 162 ovarian
cancer patients and 91 control (healthy) patients. The produced spectrum can be represented by a
curved shape, in which the x-axis shows the m/z ratio (the ratio of the weight of a molecule to its
charge) and the y-axis represents the intensity of the same molecule as a measure of the amount
of that molecule. These datasets include peak intensity measurements at 15,154 points, as defined
by the corresponding m/z values in the range of 0 to 20,000 Da.
5.2 Experimental Setup and Results
The following steps areapply by the GRC-MSmodel to the previous dataset:
1) Import MS data (raw data), using the xlsread or importdata function to load the data from an
Excel® file. In Excel, the data are represented as discrete values, such that the rows show the m/z
ratios and the columns represent the samples. The cells (the intersections of rows and columns)
represented each molecule’s intensity as a measure of the amount of that molecule in the sample.
After this step is finished, we have two variables loaded into MATLAB (MZ and Y). MZ is the
mass/charge vector, while Y is the intensity value for all 216 patients (control and cancer).
2) Preprocess the MS data to remove all forms of noise and all artifacts introduced to the data by
applying the following functions in the following order:
• msbackadj function.
• mslowess function.
• mssgolay function.
• msnorm function.
In addition, a grouping vector is created including the type of each spectrogram and the indexing
vector. This “labelling” will aid in any further analysis on this dataset.
3) Run Genetic Algorithm.
a)Create a Fitness Function for the Genetic Algorithm. In our case, the genetic algorithm tests
small subsets of m/z values using the fitness function and then determines which m/z values to
pass on to or remove from subsequent generations. The fitness function (biogafit) is passed to the
genetic algorithm solver using a function handle. It maximizes the reparability of two classes
using a linear combination of a posteriori probabilities and linear classifier error rates.
Fitness value = a posteriori probability + Error rate of a linear classifier
b) Set Genetic Algorithm Options. The GA function uses an options structure to store the
algorithm parameters used to perform minimizations with the GAs. The gaoptimset function
creates this options structure. The parameter values set for the GA are as follows:
Population size: [50 100 150 200].
Maximum number of generations: [50 100 150 200].
Number of features: [1-10].
Probability of crossover: [0.5 0.6 0.7 0.8].
Probability of mutation: [0.02 0.05 0.1].
@selectionroulette.
@crossoversinglepoint.
@mutationuniform.
17. Computer Science & Information Technology (CS & IT) 31
c) Run GA to Find the Best Discriminative Features. We using the (ga) to start the GA
function to decide the best feature values. We run the GA function with different times for all
cases as a filter selection approach with DT. Then, we compute the DT correction rate (accuracy),
the DT error rate, the DT sensitivity, and the DT specificity using 10-fold cross-validation. We
also compute run time. Then, we compare the results to choice best accuracy trees. Table 3 lists
the best GAs result along with their parameters. For example, in the first line we achieve 99.2
accuracy when using 200 population size, 50 generations, 0.7 crossover rate, 0.02 mutation Rate
and only uses two features.The best results appears at (Table 3).
Table 3. Best GA results.
4) Frequent Masses Analysis
Using the parameters in the previous table (Table 3), we obtain 42 different masses that give us
the best accuracy results. Figure 6 shows the analysis of the frequencies with which the masses
are selected, where mass 8073.585 and 244.3685 appear 10 times giving the best accuracy result.
18. 32 Computer Science & Information Technology (CS & IT)
Figure 6. Masses analysis
5) Build multiple DTs From the Training Dataset Using Only Top MZ Values and Extract
Frequent Rules.
This process involves built multiple DTs using different number of masses from the top
frequency masses every times. Then, determine the most frequent rule in these trees for each
number of masses. Steps below from A to J explain this process for each different number of
masses from top two to top ten.For example, Using only the top two m/z values to build multiple
DTs (x1=8073.5852 m/z and x2= 437.0239 m/z), which are the values extracted as top two
features from the previous step. Then extract frequent rules from the multiple DTs that built by
using the training dataset and compute the average coverage and accuracy of each rule using the
test dataset. Note that we apply holdout validation 100 times, randomly reserve two-thirds of the
dataset for training to build multiple DTs, and extract most frequent rule. The remaining one-third
of the dataset is used for testing, the average coverage and accuracy are computed for the most
frequent rules every time.
R1: IF MZ (437.0239) >= 1.22269 THEN Class = Cancer.
R2: IF MZ (437.0239) < 1.22269 and MZ (8073.5852) < 0.29102 THEN Class = Cancer.
R3: IF MZ (437.0239) < 1.22269 and MZ (8073.5852) >= 0.29102 THEN Class = Normal.
Last, build a decision list using accuracy values.
Table 4.Rules accuracy values
Rule Average Coverage Percentage Average Accuracy Percentage
R1 100 95.74
R2 100 38.35
R3 100 97.62
Overall
(R1+R2+R3)
100 98.80
19. Computer Science & Information Technology (CS & IT) 33
Table 5.Decision list using accuracy values
6. DISCUSSION
The results show that the GRC-MS classifier model achieves very good results when applied to
the analysis of ovarian cancer datasets with different numbers of features or masses that used in
the model (Table 6). We observed that 437.0239,244.36855, 8073.5852 and 793.30944 m/z were
significantly discriminative masses that can be potential biomarkers for ovarian cancer. Table 7
lists the frequently occurring masses that play important roles in most of the rules.
Table 6. The GRC-MS classifier results.
Table 7. Frequently occurring masses that play important roles in most of the rules
In Table 8,shows that our GRC-MS classifier model provides highly competitive accuracy
(99.7%) when compared to other existing classifier models, when applied to an ovarian cancer
dataset. In addition, our model also provides highly comprehensible rules that facilitate the
translation of raw data into easy-to-understand knowledge that can help experts.
20. 34 Computer Science & Information Technology (CS & IT)
Table 8. Results of some existing classifier models
7. CONCLUSION AND FUTURE WORK
Many studies have sought to increase the accuracy of diagnoses by analyzing MS data and
finding biomarkers. Some of these studies have proposed approaches capable of high accuracy,
sensitivity, and specificity, while other studies have failed to obtain satisfactory results. One
major issue remains: How can an accurate model that avoids the “black box” limitation be built?
The “black box” produces such problems as a lack of knowledge flow between the system and the
expert. To address this problem and build a model capable of yielding accurate diagnoses that are
easy for experts to understand, we used a ruled-based technique to build a classifier model to
analyze MS data. Recently, significant attention has been paid to the use of rule-based
classification techniques because of their unique ability to provide meaningful outcomes.
In addition, we apply a GA in the feature selection stage to increase the quality and accuracy of
the p GRC-MS classifier model. In previous research, excellent results have been obtained
through the combination of GA with different types of classifiers. In order to test the validity,
accuracy, and performance of the GRC-MS model, we conducted an experimental study using
open-source databases. In this experiment, we first applied several preprocessing steps to prepare
the MS data for the GRC-MS model. These steps included reducing the noise in the data and the
amount of data, identifying and extracting peaks, and normalizing and aligning the data. We
found that the GRC-MS classifier model enhance the accuracy and meaningfulness of the MS
data analysis results. As a future work, we aim to apply the GRC-MS model to another MS
dataset or other high-dimension dataset, such as a microarray gene expression dataset. We also
aim to develop more effective fitness functions for the GA.
REFERENCES
[1] H. Fernández, “Comparison of MALDI-TOF mass spectrometry data preprocessing techniques and
their effect in sample classification.”
[2] M. Durairaj and V. Ranjani, “Data mining applications in healthcare sector a study,” International
Journal of Scientific & Technology Research, vol. 2, pp. 29-35, 2013.
21. Computer Science & Information Technology (CS & IT) 35
[3] Mass Spectrometry. (2015, Feb. 15). [Online]. Available:
http://www.premierbiosoft.com/tech_notes/mass-spectrometry.html
[4] E. D. Hoffman and V. Stroobant, Mass Spectrometry: Principles and Applications. Belgium, John
Wiley & Sons Ltd., 2007.
[5] P. Veltri, “Algorithms and tools for analysis and management of mass spectrometry data,” Journal of
Briefings in Bioinformatics, vol. 9, pp. 144-155, 2008.
[6] M. Cannataro, P. H. Guzzi, T. Mazza, G. Tradigo, and P. Veltri, “Preprocessing of mass spectrometry
proteomics data on the grid,” in Proc. 18th IEEE Symp. on Computer-Based Medical Systems, 2005,
pp. 549-554.
[7] S. Bachmayer, “Preprocessing of mass spectrometry data in the field of proteomics,” M.S. thesis,
University of Helsinki, Finland, pp. 8-13, 2007.
[8] J. Zhang, E. Gonzalez, T. Hestilow, W. Haskins, and Y. Huang, “Review of peak detection
algorithms in liquid-chromatography-mass spectrometry,” Journal of Current Genomics, vol. 10, p.
388-401, 2009.
[9] R. Kandaa and R. Glendinning, “Mass spectrometry for environmental and wastewater monitoring,”
Journal of Spectroscopy Europe, vol. 23, pp. 15-27, 2011.
[10] M. Katajamaa and M. Orešič, “Data processing for mass spectrometry-based metabolomics,” Journal
of Chromatography A, vol. 1158, pp. 318-328, 2007.
[11] M. A. Rogers, P. Clarke, J. Noble, N. P. Munro, A. Paul, P. J. Selby, and R. E. Banks, “Proteomic
profiling of urinary proteins in renal cancer by surface enhanced laser desorption ionization and
neural-network analysis identification of key issues affecting potential clinical utility,” Journal of
Cancer Research, vol. 63, pp. 6971-6983, 2003.
[12] Y. Saeys, I. Inza, and P. Larrañaga, “A review of feature selection techniques in bioinformatics,”
Journal of Bioinformatics, vol. 23, pp. 2507-2517, 2007.
[13] D. Ward et al., “Identification of serum biomarkers for colon cancer by proteomic analysis,” British
Journal of Cancer, vol. 94, pp. 1898-1905, 2006.
[14] E. F. Petricoin et al., “Use of proteomic patterns in serum to identify ovarian cancer,” The Lancet,
vol. 359, pp. 572-577, 2002.
[15] G. Ge and G. W. Wong, “Classification of premalignant pancreatic cancer mass-spectrometry data
using decision tree ensembles,” Journal of BMC Bioinformatics, vol. 9, pp. 275-287, 2008.
[16] P. Yang and Z. Zhang, “A clustering based hybrid system for mass spectrometry data analysis,”
Journal of Pattern Recognition in Bioinformatics, pp. 98-109, 2008.
[17] C. Yang, Z. He, and W. Yu, “Comparison of public peak detection algorithms for MALDI mass
spectrometry data analysis,” Journal of BMC Bioinformatics, vol. 10, pp. 4-14, 2009.
[18] “Smoothing,” (2015, Feb. 22). [Online]. Available:
http://www.wavemetrics.com/products/IGORPro/dataanalysis/signalprocessing/smoothing.htm.
[19] J. Prados, A. Kalousis, J. C. Sanchez, L. Allard, O. Carrette, and M. Hilario, “Mining mass spectra for
diagnosis and biomarker discovery of cerebral accidents,” Journal of Proteomics, vol. 4, pp. 2320-
2332, 2004.
[20] A. Thomas, G. D. Tourassi, A. S. Elmaghraby, R. Valdes Jr, and S. A. Jortani, “Data mining in
proteomic mass spectrometry,” Journal of Clinical Proteomics, vol. 2, pp. 13-32, 2006.
[21] T. N. Vu and K. Laukens, “Getting your peaks in line: A review of alignment methods for NMR
spectral data,” Journal of Metabolites, vol. 3, pp. 259-276, 2013.
[22] Y. Su et al., “Diagnosis of gastric cancer using decision tree classification of mass spectral data,”
Journal of Cancer Science, vol. 98, pp. 37-43, 2007.
[23] I. Inza, P. Larrañaga, R. Blanco, and A. J. Cerrolaza, "Filter versus wrapper gene selection approaches
in DNA microarray domains," Artificial Intelligence in Medicine, vol. 31, pp. 91-103, 2004.
[24] R. Blanco, P. Larranaga, I. Inza, and B. Sierra, "Gene selection for cancer classification using
wrapper approaches," International Journal of Pattern Recognition and Artificial Intelligence, vol. 18,
pp. 1373-1390, 2004.
[25] R. Díaz-Uriarte and S. A. De Andres, "Gene selection and classification of microarray data using
random forest," BMC Bioinformatics, vol. 7, p. 3, 2006.
[26] S. Ma and J. Huang, "Regularized ROC method for disease classification and biomarker selection
with microarray data," Bioinformatics, vol. 21, pp. 4356-4362, 2005.
22. 36 Computer Science & Information Technology (CS & IT)
[27] F. Gullo, G. Ponti, A. Tagarelli, G. Tradigo, and P. Veltri, “A time series approach for clustering
mass spectrometry data,” Journal of Computational Science, vol. 3, pp. 344-355, 2012.
[28] A. Vlahou, J. O. Schorge, B. W. Gregory, and R. L. Coleman, “Diagnosis of ovarian cancer using
decision tree classification of mass spectral data,” Journal of Biomedicine and Biotechnology, vol. 5,
pp. 391-404, 2003.
[29] Y. Su et al., “Diagnosis of gastric cancer using decision tree classification of mass spectral data,”
Journal of Cancer Science, vol. 98, pp. 37-43, 2007.
[30] Y. D. Chen, S. Zheng, J.-K. Yu, and X. Hu, “Artificial neural networks analysis of surface-enhanced
laser desorption/ionization mass spectra of serum protein pattern distinguishes colorectal cancer from
healthy population,” Journal of Clinical Cancer Research, vol. 10, pp. 8380-8385, 2004.
[31] J. Zheng, “A comparison of naïve Bayes and logistic regression classifiers for mass spectrometry
data,” Journal of Proteomics & Bioinformatics, 2007.
[32] M. Wagner, D. Naik, and A. Pothen, “Protocols for disease classification from mass spectrometry
data,” Journal of Proteomics, vol. 3, pp. 1692-1698, 2003.
[33] J. Han, M. Kamber, and J. Pei, Data Mining: Concepts and Techniques. San Francisco, CA, Morgan
Kaufmann Publishers Inc., 2011.
[34] E. F. Petricoin et al., “Use of proteomic patterns in serum to identify ovarian cancer,” Journal of
Mechanisms of Disease, vol. 359, pp. 572-577, 2002.
[35] C. Reynès, R. Sabatier, N. Molinari, and S. Lehmann, "A new genetic algorithm in proteomics:
Feature selection for SELDI-TOF data," Computational Statistics & Data Analysis, vol. 52, pp. 4380-
4394, 2008.
[36] M. S. Mohamad, S. Deris, S. Yatim, and M. Othman, "Feature selection method using genetic
algorithm for the classification of small and high dimension data," in Proc. of the 1st Int. Symposium
on Information and Communication Technology, 2004, pp. 13-16.
[37] L. Li et al., "Data mining techniques for cancer detection using serum proteomic profiling," Artificial
Intelligence in Medicine, vol. 32, pp. 71-83, 2004.
[38] E. F. Petricoin et al., “Use of proteomic patterns in serum to identify ovarian cancer,” Journal of
Mechanisms of Disease, vol. 359, pp. 572-577, 2002.
[39] S. Shah and A. Kusiak, "Cancer gene search with data-mining and genetic algorithms," Computers in
Biology and Medicine, vol. 37, pp. 251-261, 2007.
[40] Z. Wang and V. Palade, "Building interpretable fuzzy models for high dimensional data analysis in
cancer diagnosis," BMC Genomics, vol. 12, p. S5, 2011.
[41] H. W. Ressom et al., "Biomarker identification and rule extraction from mass spectral serum
profiles," in proc IEEE Symp. Computational Intelligence and Bioinformatics and Computational
Biology, 2006, pp. 1-7.
[42] J. M. Sorace and M. Zhan, "A data review and re-assessment of ovarian cancer serum proteomic
profiling," BMC Bioinformatics, vol. 4, p. 24-35, 2003.
[43] A. Assareh and M. H. Moradi, "Extracting efficient fuzzy if-then rules from mass spectra of blood
samples to early diagnosis of ovarian cancer," in Computational Intelligence and Bioinformatics and
Computational Biology, 2007. CIBCB'07. IEEE Symposium on, 2007, pp. 502-506.
[44] Z. Wang and V. Palade, "Building interpretable fuzzy models for high dimensional data analysis in
cancer diagnosis," BMC Genomics, vol. 12, p. S5, 2011.