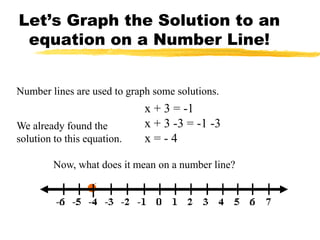
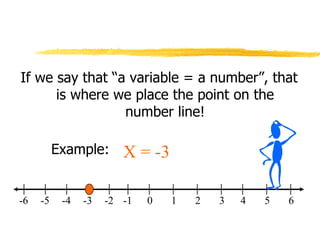
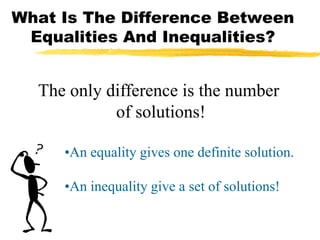
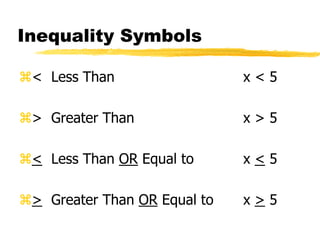
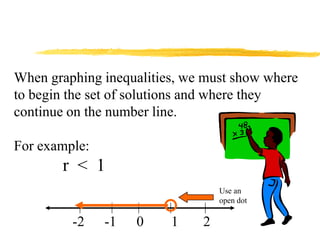
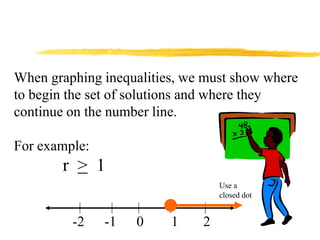
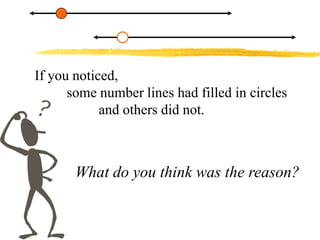
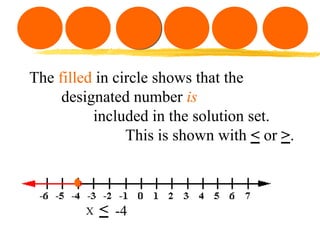
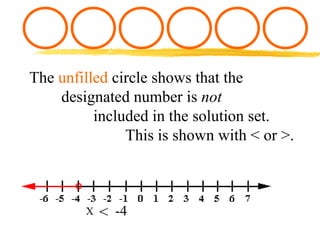
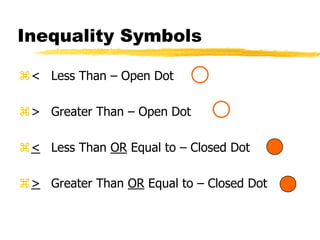
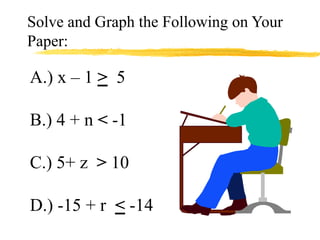
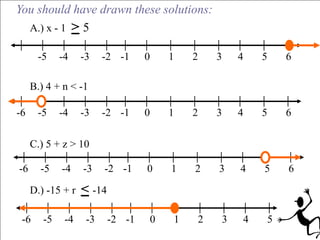
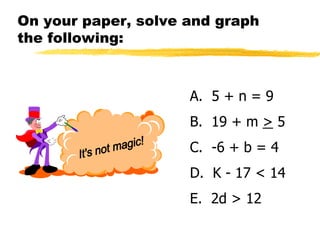
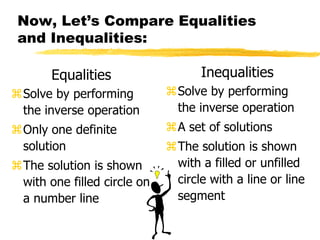
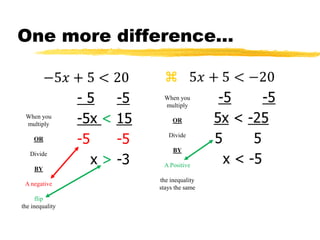
Graphing Equations and
     Inequalities
POD
Distribute
1) 5(-6b + 6)
2) -6(4r – 4)
Combine Like Terms
3) -30x + 30 + 5x
Solve
4) 5v + 5(-6v + 6) = -6(4v – 4)
5v + 5(-6v + 6) = -6(4v – 4)
Essential Questions:
What is an inequality?

 How can I graph solutions
 of equations and inequalities
 on a number line?
Let’s Graph the Solution to an
 equation on a Number Line!


Number lines are used to graph some solutions.
                             x + 3 = -1
We already found the         x + 3 -3 = -1 -3
solution to this equation.   x=-4

         Now, what does it mean on a number line?
If we say that “a variable = a number”, that
      is where we place the point on the
                 number line!

          Example:      X = -3

-6   -5    -4   -3   -2 -1   0   1   2   3   4   5   6
What Is The Difference Between
 Equalities And Inequalities?


  The only difference is the number
            of solutions!

     •An equality gives one definite solution.

     •An inequality give a set of solutions!
Inequality Symbols

< Less Than                  x<5

> Greater Than               x>5

< Less Than OR Equal to      x<5

> Greater Than OR Equal to   x>5
If we say that x > 6,
aren’t we stating that x can be
  any amount greater than 6?
    What are some examples??
How Do We View A Set Of
Solutions On A Number Line?


        Let’s find out!
When graphing inequalities, we must show where
to begin the set of solutions and where they
continue on the number line.

For example:
       r < 1
                                  Use an
                                  open dot

         -2    -1   0    1    2
When graphing inequalities, we must show where
to begin the set of solutions and where they
continue on the number line.

For example:
       r > 1
                                  Use a
                                  closed dot


         -2    -1   0    1    2
If you noticed,
      some number lines had filled in circles
            and others did not.


       What do you think was the reason?
The filled in circle shows that the
     designated number is
          included in the solution set.
                This is shown with < or >.


        X   < -4
The unfilled circle shows that the
    designated number is not
          included in the solution set.
               This is shown with < or >.


        X   < -4
Inequality Symbols

< Less Than – Open Dot

> Greater Than – Open Dot

< Less Than OR Equal to – Closed Dot

> Greater Than OR Equal to – Closed Dot
Solve and Graph the Following on Your
Paper:

A.) x – 1 > 5

B.) 4 + n < -1

C.) 5+ z > 10

D.) -15 + r < -14
You should have drawn these solutions:
  A.) x - 1 > 5

      -5     -4    -3    -2 -1     0    1    2    3    4    5    6

     B.) 4 + n < -1

-6    -5     -4    -3    -2 -1     0    1    2    3    4    5    6

     C.) 5 + z > 10

-6     -5    -4    -3    -2 -1     0    1    2    3    4    5    6

     D.) -15 + r   < -14

 -6     -5    -4    -3     -2 -1    0    1    2    3    4    5
On your paper, solve and graph
the following:


                     A. 5 + n = 9
                     B. 19 + m > 5
                     C. -6 + b = 4
                     D. K - 17 < 14
                     E. 2d > 12
Now, Let’s Compare Equalities
 and Inequalities:

       Equalities                  Inequalities
Solve by performing         Solve by performing
 the inverse operation        the inverse operation
Only one definite           A set of solutions
 solution                    The solution is shown
The solution is shown        with a filled or unfilled
 with one filled circle on    circle with a line or line
 a number line                segment
One more difference…

                   
                  When you
                  multiply
 When you
                      OR
 multiply
                    Divide
     OR
                      BY
   Divide
                  A Positive
     BY
                 the inequality
 A negative
                 stays the same
      flip
the inequality
Vocabulary

  •Number line

  •Solution

  •Inverse Operation

  •Equality

  •Inequality
Remember:


Perform the
   inverse operation
      to solve for a variable!

Graphing inequalities edmodo 10 16-2012

  • 1.
  • 2.
    POD Distribute 1) 5(-6b +6) 2) -6(4r – 4) Combine Like Terms 3) -30x + 30 + 5x Solve 4) 5v + 5(-6v + 6) = -6(4v – 4)
  • 3.
    5v + 5(-6v+ 6) = -6(4v – 4)
  • 4.
    Essential Questions: What isan inequality?  How can I graph solutions of equations and inequalities on a number line?
  • 5.
    Let’s Graph theSolution to an equation on a Number Line! Number lines are used to graph some solutions. x + 3 = -1 We already found the x + 3 -3 = -1 -3 solution to this equation. x=-4 Now, what does it mean on a number line?
  • 6.
    If we saythat “a variable = a number”, that is where we place the point on the number line! Example: X = -3 -6 -5 -4 -3 -2 -1 0 1 2 3 4 5 6
  • 7.
    What Is TheDifference Between Equalities And Inequalities? The only difference is the number of solutions! •An equality gives one definite solution. •An inequality give a set of solutions!
  • 8.
    Inequality Symbols < LessThan x<5 > Greater Than x>5 < Less Than OR Equal to x<5 > Greater Than OR Equal to x>5
  • 9.
    If we saythat x > 6, aren’t we stating that x can be any amount greater than 6? What are some examples??
  • 10.
    How Do WeView A Set Of Solutions On A Number Line? Let’s find out!
  • 11.
    When graphing inequalities,we must show where to begin the set of solutions and where they continue on the number line. For example: r < 1 Use an open dot -2 -1 0 1 2
  • 12.
    When graphing inequalities,we must show where to begin the set of solutions and where they continue on the number line. For example: r > 1 Use a closed dot -2 -1 0 1 2
  • 13.
    If you noticed, some number lines had filled in circles and others did not. What do you think was the reason?
  • 14.
    The filled incircle shows that the designated number is included in the solution set. This is shown with < or >. X < -4
  • 15.
    The unfilled circleshows that the designated number is not included in the solution set. This is shown with < or >. X < -4
  • 16.
    Inequality Symbols < LessThan – Open Dot > Greater Than – Open Dot < Less Than OR Equal to – Closed Dot > Greater Than OR Equal to – Closed Dot
  • 17.
    Solve and Graphthe Following on Your Paper: A.) x – 1 > 5 B.) 4 + n < -1 C.) 5+ z > 10 D.) -15 + r < -14
  • 18.
    You should havedrawn these solutions: A.) x - 1 > 5 -5 -4 -3 -2 -1 0 1 2 3 4 5 6 B.) 4 + n < -1 -6 -5 -4 -3 -2 -1 0 1 2 3 4 5 6 C.) 5 + z > 10 -6 -5 -4 -3 -2 -1 0 1 2 3 4 5 6 D.) -15 + r < -14 -6 -5 -4 -3 -2 -1 0 1 2 3 4 5
  • 19.
    On your paper,solve and graph the following: A. 5 + n = 9 B. 19 + m > 5 C. -6 + b = 4 D. K - 17 < 14 E. 2d > 12
  • 20.
    Now, Let’s CompareEqualities and Inequalities: Equalities Inequalities Solve by performing Solve by performing the inverse operation the inverse operation Only one definite A set of solutions solution The solution is shown The solution is shown with a filled or unfilled with one filled circle on circle with a line or line a number line segment
  • 21.
    One more difference…  When you multiply When you OR multiply Divide OR BY Divide A Positive BY the inequality A negative stays the same flip the inequality
  • 22.
    Vocabulary •Numberline •Solution •Inverse Operation •Equality •Inequality
  • 23.
    Remember: Perform the inverse operation to solve for a variable!