3. Toothpick Patterns
1st
2nd
3rd
4th
Number of boxes
(x, input, independent variable)
1
2
3
4
20
50
Number of toothpicks
(y, output, dependent variable)
4
7
10
13
61
151 301
Unit rate of change (pattern): +3
Function: y = 3x + 1
100
4. Toothpick Patterns
1st
2nd
3rd
4th
Number of boxes
(x, input, independent variable)
1
2
3
4
20
50
Number of toothpicks
(y, output, dependent variable)
3
5
7
9
41
101 201
Unit rate of change (pattern): +2
Function: y = 2x + 1
100
5. POD 5 Dec
• Does the table below represent a function?
• What is the independent variable?
# of
boxes
1
2
• What is the dependent variable?
3
• Can you write a rule for the table? 4
5
# of
toothpicks
4
7
10
13
16
9. Linear Functions
Your smart phone plan costs 35 dollars a month, plus 10 dollars per
GB of data used. Fill out a table, create a graph, and write an equation
to model the money you will spend each month on your phone.
Table
Graph
GBs of
Data
0
1
45
2
55
3
65
4
75
5
85
6
95
7
Unit rate of
change:
+10
Total
Cost
35
105
Total
Cost
Equation:
y = 10x + 35
GBs of Data
10. Linear Functions
You want to ship math textbooks from Singapore. They cost 45 dollars
each, plus 25 dollars total for shipping. Fill out a table, create a graph,
and write an equation to model the cost of the textbooks.
Graph
Table
Books
Cost
1
70
2
115
3
160
4
205
5
250
6
295
7
340
8
385
Unit Rate of
Change:
+45
Total
Cost
Equation:
y = 45x + 25
Books
11. Linear Functions
A taxi service charges an initial three dollar fee, plus two dollars per
mile driven. Fill out a table, create a graph, and write an equation to
model the cost of the taxi service.
Graph
Table
Miles
Cost
0
3
1
5
2
7
3
9
4
11
5
13
6
15
7
17
Unit Rate of
Change:
+2
Total
Cost
Equation:
y = 2x + 3
Miles
Editor's Notes
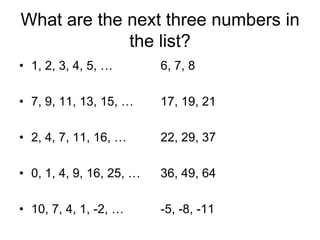
Discuss patterns; students will identify the next three numbers quickly, but they may have trouble describing the pattern. Some sequences have more than one pattern.
Ask students to identify the pattern.
Review Toothpick activity.
Review toothpick activity.
Spend some time discussing dependent and independent variables, and labeling the graph. Also a good time to review discrete and continuous data.