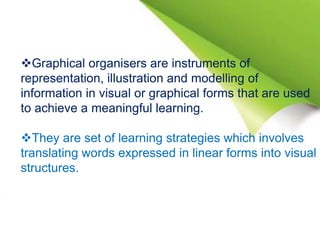
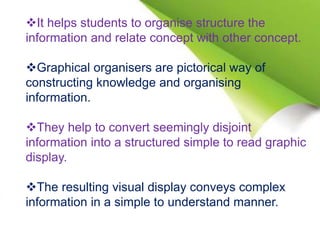
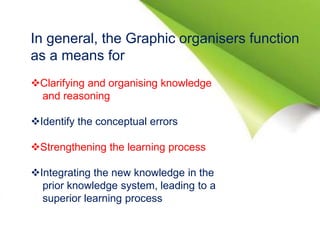
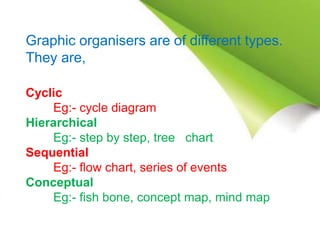
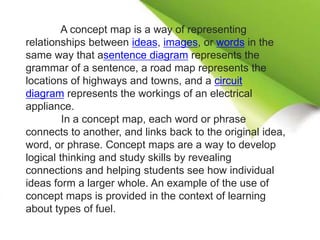
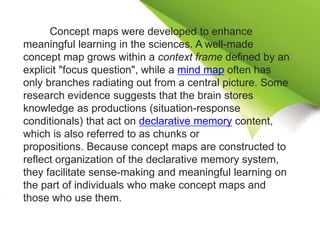
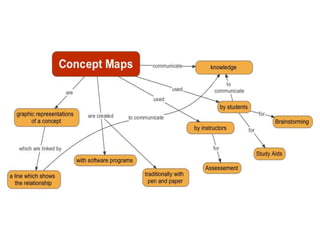
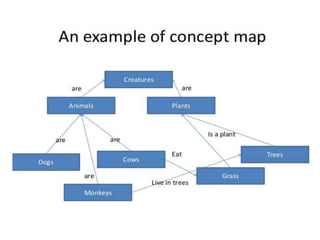
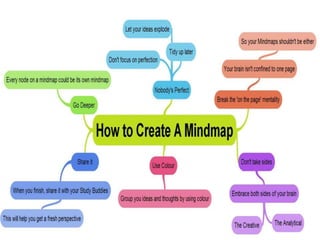
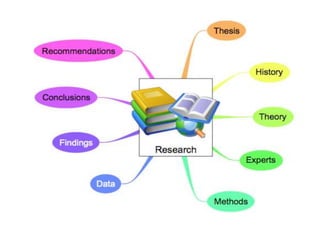
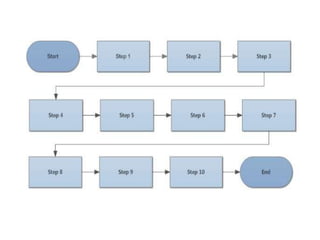
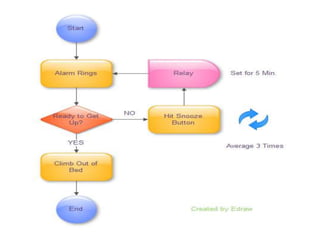
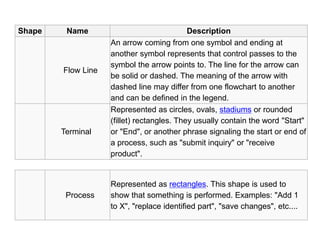
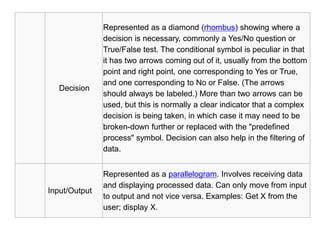
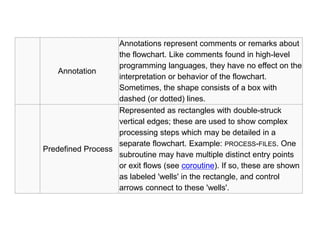
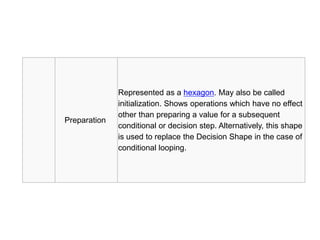
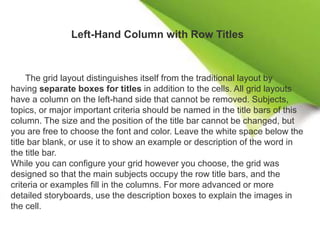
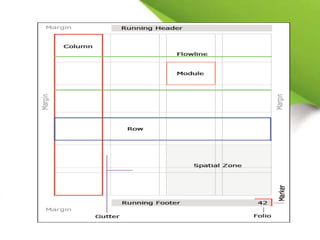
SlideShare a Scribd company logo
1 of 46
Graphic
Organisers
Graphical organisers are instruments of
representation, illustration and modelling of
information in visual or graphical forms that are used
to achieve a meaningful learning.
They are set of learning strategies which involves
translating words expressed in linear forms into visual
structures.
It helps students to organise structure the
information and relate concept with other concept.
Graphical organisers are pictorical way of
constructing knowledge and organising
information.
They help to convert seemingly disjoint
information into a structured simple to read graphic
display.
The resulting visual display conveys complex
information in a simple to understand manner.
In general, the Graphic organisers function
as a means for
Clarifying and organising knowledge
and reasoning
Identify the conceptual errors
Strengthening the learning process
Integrating the new knowledge in the
prior knowledge system, leading to a
superior learning process
Graphic organisers are of different types.
They are,
Cyclic
Eg:- cycle diagram
Hierarchical
Eg:- step by step, tree chart
Sequential
Eg:- flow chart, series of events
Conceptual
Eg:- fish bone, concept map, mind map
Concept map
A concept map or conceptual diagram is
a diagram that depicts suggested relationships
between concepts. It is a graphical tool that instructional
designers, engineers, technical writers, and others use to
organize and structure knowledge.
A concept map typically represents ideas and
information as boxes or circles, which it connects with
labeled arrows in a downward-branching hierarchical
structure. The relationship between concepts can be
articulated in linking phrases such as causes, requires,
or contributes to.
The technique for visualizing these relationships
among different concepts is called concept mapping.
Concept maps define the ontology of computer
systems, for example with the object-role
modeling or Unified Modeling Language formalism.
A concept map is a way of representing
relationships between ideas, images, or words in the
same way that asentence diagram represents the
grammar of a sentence, a road map represents the
locations of highways and towns, and a circuit
diagram represents the workings of an electrical
appliance.
In a concept map, each word or phrase
connects to another, and links back to the original idea,
word, or phrase. Concept maps are a way to develop
logical thinking and study skills by revealing
connections and helping students see how individual
ideas form a larger whole. An example of the use of
concept maps is provided in the context of learning
about types of fuel.
Concept maps were developed to enhance
meaningful learning in the sciences. A well-made
concept map grows within a context frame defined by an
explicit "focus question", while a mind map often has
only branches radiating out from a central picture. Some
research evidence suggests that the brain stores
knowledge as productions (situation-response
conditionals) that act on declarative memory content,
which is also referred to as chunks or
propositions. Because concept maps are constructed to
reflect organization of the declarative memory system,
they facilitate sense-making and meaningful learning on
the part of individuals who make concept maps and
those who use them.
The technique of concept mapping was developed by Joseph
D. Novak and his research team at Cornell University in the 1970s as a
means of representing the emerging science knowledge of students. It has
subsequently been used as a tool to increase meaningful learning in the
sciences and other subjects as well as to represent the expert knowledge
of individuals and teams in education, government and business. Concept
maps have their origin in the learning movement called constructivism. In
particular, constructivists hold that learners actively construct knowledge.
Novak's work is based on the cognitive theories of David Ausubel, who
stressed the importance of prior knowledge in being able to learn
(or assimilate) new concepts: "The most important single factor influencing
learning is what the learner already knows. Ascertain this and teach
accordingly."
Novak taught students as young as six years old to make concept maps to
represent their response to focus questions such as "What is water?" "What
causes the seasons?" In his book Learning How to Learn, Novak states that a
"meaningful learning involves the assimilation of new concepts and
propositions into existing cognitive structures."
Various attempts have been made to conceptualize the process of creating
concept maps. Ray McAleese, in a series of articles, has suggested that
mapping is a process of off-loading. In this 1998 paper, McAleese draws on
the work of Sowa and a paper by Sweller & Chandler. In essence, McAleese
suggests that the process of making knowledge explicit,
using nodes and relationships, allows the individual to become aware of what
they know and as a result to be able to modify what they know. Maria Birbili
applies that same idea to helping young children learn to think about what
they know. The concept of the knowledge arena is suggestive of a virtual
space where learners may explore what they know and what they do not
know.
Uses
Concept maps are used to stimulate the generation of ideas,
and are believed to aid creativity. Concept mapping is also
sometimes used for brain-storming. Although they are often
personalized and idiosyncratic, concept maps can be used to
communicate complex ideas.
Formalized concept maps are used in software design, where a
common usage isUnified Modeling Language diagramming
amongst similar conventions and development methodologies.
Concept mapping can also be seen as a first step in ontology-
building, and can also be used flexibly to represent formal
argument.
Concept maps are widely used in education and business.
Uses include:
Note taking and summarizing gleaning key concepts, their relationships and
hierarchy from documents and source materials
New knowledge creation: e.g., transforming tacit knowledge into an
organizational resource, mapping team knowledge
Institutional knowledge preservation (retention), e.g., eliciting and mapping
expert knowledge of employees prior to retirement
Collaborative knowledge modeling and the transfer of expert knowledge
Facilitating the creation of shared vision and shared understanding within a
team or organization
Instructional design: concept maps used as Ausubelian "advance organizers"
that provide an initial conceptual frame for subsequent information and learning.
Training: concept maps used as Ausubelian "advanced organizers" to represent
the training context and its relationship to their jobs, to the organization's strategic
objectives, to training goals.
Communicating complex ideas and arguments
Examining the symmetry of complex ideas and arguments and associated
terminology
Detailing the entire structure of an idea, train of thought, or line of argument
(with the specific goal of exposing faults, errors, or gaps in one's own reasoning)
for the scrutiny of others.
Enhancing metacognition (learning to learn, and thinking about knowledge)
Improving language ability
Assessing learner understanding of learning objectives, concepts, and the
relationship among those concepts
Lexicon development.
Mind map
A mind map is a diagram used to visually organize
information. A mind map is hierarchical and shows relationships
among pieces of the whole. It is often created around a single
concept, drawn as an image in the center of a blank page, to which
associated representations of ideas such as images, words and
parts of words are added. Major ideas are connected directly to the
central concept, and other ideas branch out from those.
Mind maps can be drawn by hand, either as "rough notes" during a
lecture, meeting or planning session, for example, or as higher
quality pictures when more time is available. Mind maps are
considered to be a type of spider diagram. A similar concept in the
1970s was "idea sun bursting"
Origins
Although the term "mind map" was first popularized by British popular
psychology author and television personality Tony Buzan, the use of diagrams
that visually "map" information using branching and radial maps traces back
centuries. These pictorial methods record knowledge and model systems, and
have a long history in learning, brainstorming, memory, visual thinking,
and problem solving by educators, engineers, psychologists, and others. Some
of the earliest examples of such graphical records were developed by Porphyry
of Tyros, a noted thinker of the 3rd century, as he graphically visualized the
conceptcategories of Aristotle. Philosopher Ramon Llull (1235–1315) also used
such techniques.
The semantic network was developed in the late 1950s as a theory to
understand human learning and developed further by Allan M. Collins and M.
Ross Quillian during the early 1960s. Mind maps are similar in radial structure
to concept maps, developed by learning experts in the 1970s, but differ in that
the former are simplified by focusing around a single central key concept.
Mind map guidelines
Buzan suggests the following guidelines for creating mind maps:
•Start in the center with an image of the topic, using at least 3 colors.
•Use images, symbols, codes, and dimensions throughout your mind map.
•Select key words and print using upper or lower case letters.
•Each word/image is best alone and sitting on its own line.
•The lines should be connected, starting from the central image. The lines
become thinner as they radiate out from the center.
•Make the lines the same length as the word/image they support.
•Use multiple colors throughout the mind map, for visual stimulation and
also for encoding or grouping.
•Develop your own personal style of mind mapping.
•Use emphasis and show associations in your mind map.
•Keep the mind map clear by using radial hierarchy or outlines to embrace
your branches.
Uses
As with other diagramming tools, mind maps can be used
to generate, visualize, structure, and classify ideas, and as an aid
to studying and organizing information, solving problems, making decisions,
and writing.
Mind maps have many applications in personal, family, educational,
and business situations, including notetaking, brainstorming (wherein ideas are
inserted into the map radially around the center node, without the implicit
prioritization that comes from hierarchy or sequential arrangements, and
wherein grouping and organizing is reserved for later stages), summarizing, as
a mnemonic technique, or to sort out a complicated idea. Mind maps are also
promoted as a way to collaborate in color pen creativity sessions.
In addition to these direct use cases, data retrieved from mind maps can be
used to enhance several other applications; for instance expert search
systems, search engines and search and tag query recommender. To do so,
mind maps can be analysed with classic methods of information retrieval to
classify a mind map's author or documents that are linked from within the mind
map.
Flow chart
A flowchart is a type of diagram that uses
an algorithm, workflow or process, showing the
steps as boxes of various kinds, and their order
by connecting them with arrows. This
diagrammatic representation illustrates a solution
model to a given problem. Flowcharts are used in
analyzing, designing, documenting or managing a
process or program in various fields.
Flowcharts are used in designing and documenting simple processes or
programs. Like other types of diagrams, they help visualize what is going on and
thereby help understand a process, and perhaps also find flaws, bottlenecks, and
other less-obvious features within it. There are many different types of flowcharts,
and each type has its own repertoire of boxes and notational conventions. The two
most common types of boxes in a flowchart are:
•a processing step, usually called activity, and denoted as a rectangular box
•a decision, usually denoted as a diamond.
A flowchart is described as "cross-functional" when the page is divided into
different swimlanes describing the control of different organizational units. A
symbol appearing in a particular "lane" is within the control of that organizational
unit. This technique allows the author to locate the responsibility for performing an
action or making a decision correctly, showing the responsibility of each
organizational unit for different parts of a single process.
Flowcharts depict certain aspects of processes and they are usually
complemented by other types of diagram. For instance, Kaoru
Ishikawa defined the flowchart as one of the seven basic tools of quality
control, next to the histogram,Pareto chart, check sheet, control chart, cause-
and-effect diagram, and the scatter diagram. Similarly, in UML, a standard
concept-modeling notation used in software development, the activity
diagram, which is a type of flowchart, is just one of many different diagram
types.
Nassi-Shneiderman diagrams and Drakon-charts are an alternative notation
for process flow.
Common alternative names include: flowchart, process flowchart, functional
flowchart, process map, process chart, functional process chart, business
process model, process model, process flow diagram, work flow diagram,
business flow diagram. The terms "flowchart" and "flow chart" are used
interchangeably.
The underlying graph structure of a flow chart is a flow graph, which abstracts
away node types, their contents and other ancillary information.
Types
Sterneckert (2074703) suggested that flowcharts can be modeled
from the perspective of different user groups (such as managers,
system analysts and clerks) and that there are four general types:
•Document flowcharts, showing controls over a document-flow
through a system
•Data flowcharts, showing controls over a data-flow in a system
•System flowcharts, showing controls at a physical or resource level
•Program flowchart, showing the controls in a program within a
system
Notice that every type of flowchart focuses on some kind of control,
rather than on the particular flow itself.
However, there are several of these classifications. For example,
Andrew Veronis (1978) named three basic types of flowcharts:
the system flowchart, thegeneral flowchart, and the detailed
flowchart. That same year Marilyn Bohl (1978) stated "in practice, two
kinds of flowcharts are used in solution planning:system
flowcharts and program flowcharts...". More recently Mark A. Fryman
(2001) stated that there are more differences: "Decision flowcharts, logic
flowcharts, systems flowcharts, product flowcharts, and process
flowcharts are just a few of the different types of flowcharts that are used
in business and government".
In addition, many diagram techniques exist that are similar to flowcharts
but carry a different name, such as UML activity diagrams.
Building blocks
Common Shapes
The following are some of the commonly used shapes used in
flowcharts. Generally, flowcharts flow from top to bottom and left to
right.
Shape Name Description
Flow Line
An arrow coming from one symbol and ending at
another symbol represents that control passes to the
symbol the arrow points to. The line for the arrow can
be solid or dashed. The meaning of the arrow with
dashed line may differ from one flowchart to another
and can be defined in the legend.
Terminal
Represented as circles, ovals, stadiums or rounded
(fillet) rectangles. They usually contain the word "Start"
or "End", or another phrase signaling the start or end of
a process, such as "submit inquiry" or "receive
product".
Process
Represented as rectangles. This shape is used to
show that something is performed. Examples: "Add 1
to X", "replace identified part", "save changes", etc....
Decision
Represented as a diamond (rhombus) showing where a
decision is necessary, commonly a Yes/No question or
True/False test. The conditional symbol is peculiar in that
it has two arrows coming out of it, usually from the bottom
point and right point, one corresponding to Yes or True,
and one corresponding to No or False. (The arrows
should always be labeled.) More than two arrows can be
used, but this is normally a clear indicator that a complex
decision is being taken, in which case it may need to be
broken-down further or replaced with the "predefined
process" symbol. Decision can also help in the filtering of
data.
Input/Output
Represented as a parallelogram. Involves receiving data
and displaying processed data. Can only move from input
to output and not vice versa. Examples: Get X from the
user; display X.
Annotation
Annotations represent comments or remarks about
the flowchart. Like comments found in high-level
programming languages, they have no effect on the
interpretation or behavior of the flowchart.
Sometimes, the shape consists of a box with
dashed (or dotted) lines.
Predefined Process
Represented as rectangles with double-struck
vertical edges; these are used to show complex
processing steps which may be detailed in a
separate flowchart. Example: PROCESS-FILES. One
subroutine may have multiple distinct entry points
or exit flows (see coroutine). If so, these are shown
as labeled 'wells' in the rectangle, and control
arrows connect to these 'wells'.
Preparation
Represented as a hexagon. May also be called
initialization. Shows operations which have no effect
other than preparing a value for a subsequent
conditional or decision step. Alternatively, this shape
is used to replace the Decision Shape in the case of
conditional looping.
On-Page
Connector
Generally represented with a circle, showing where
multiple control flows converge in a single exit flow. It will
have more than one arrow coming into it, but only one
going out. In simple cases, one may simply have an arrow
point to another arrow instead. These are useful to
represent an iterative process (what in Computer Science
is called a loop). A loop may, for example, consist of a
connector where control first enters, processing steps, a
conditional with one arrow exiting the loop, and one going
back to the connector. For additional clarity, wherever two
lines accidentally cross in the drawing, one of them may
be drawn with a small semicircle over the other, showing
that no connection is intended.
Off-Page
Connector
Represented as a home plate-shaped pentagon. Similar to
the on-page connector except allows for placing a
connector that connects to another page.
Other Shapes
A typical flowchart from older basic computer science textbooks
may have the following kinds of symbols:
Labeled connectors
Represented by an identifying label inside a circle. Labeled
connectors are used in complex or multi-sheet diagrams to substitute
for arrows. For each label, the "outflow" connector must always be
unique, but there may be any number of "inflow" connectors. In this
case, a junction in control flow is implied.
Concurrency symbol
Represented by a double transverse line with any number of
entry and exit arrows. These symbols are used whenever two or
more control flows must operate simultaneously. The exit flows are
activated concurrently, when all of the entry flows have reached the
concurrency symbol. A concurrency symbol with a single entry flow is
a fork; one with a single exit flow is a join.
Grid
Storyboard That has a few different layouts available for
your storyboards. The grid layout is a format option that
compares items across two axes. Grids are often the best
choice for storyboards with lots of information, because
grids are organized in a matrix. For simpler comparisons, we
suggest you use a T-Chart.
Grids Help You:
•Organize Information
•Compare Multiple Characteristics of a Topic
or Topics
•Create Graphic Organizers for Reading
•Make Visual Tables
Left-Hand Column with Row Titles
The grid layout distinguishes itself from the traditional layout by
having separate boxes for titles in addition to the cells. All grid layouts
have a column on the left-hand side that cannot be removed. Subjects,
topics, or major important criteria should be named in the title bars of this
column. The size and the position of the title bar cannot be changed, but
you are free to choose the font and color. Leave the white space below the
title bar blank, or use it to show an example or description of the word in
the title bar.
While you can configure your grid however you choose, the grid was
designed so that the main subjects occupy the row title bars, and the
criteria or examples fill in the columns. For more advanced or more
detailed storyboards, use the description boxes to explain the images in
the cell.
THANK YOU- Sarath K C
- intradesigners4321@gmail.com

More Related Content

What's hot

Pipe Conecpt Map
Pipe Conecpt MapPipe Conecpt Map
Pipe Conecpt Mappipe
 
Concept mapping, Simulation, Gradation
Concept mapping, Simulation, GradationConcept mapping, Simulation, Gradation
Concept mapping, Simulation, Gradationmathsvidhya2014
 
Concept map workshop AEME 2014
Concept map workshop AEME 2014Concept map workshop AEME 2014
Concept map workshop AEME 2014drmukhtiarbaig
 
Social Studies Concepts Maps
Social Studies Concepts MapsSocial Studies Concepts Maps
Social Studies Concepts MapsGEVD
 
Intro to concept maps v3 march 2012
Intro to concept maps v3 march 2012Intro to concept maps v3 march 2012
Intro to concept maps v3 march 2012Andre Daniels
 
Presentation1 psycholiguistics
Presentation1 psycholiguisticsPresentation1 psycholiguistics
Presentation1 psycholiguisticsMilad Abdosamee
 
Graphic inquiry
Graphic inquiryGraphic inquiry
Graphic inquiryJenn Alevy
 
Schema Learning Theory Comparative Organizer
Schema Learning Theory Comparative OrganizerSchema Learning Theory Comparative Organizer
Schema Learning Theory Comparative OrganizerAli Serrioz
 
Teaching by guiding_cognitive_processes_during_learning
Teaching by guiding_cognitive_processes_during_learningTeaching by guiding_cognitive_processes_during_learning
Teaching by guiding_cognitive_processes_during_learningLearning_Instruction
 
J Weeks9831563 Task4
J Weeks9831563 Task4J Weeks9831563 Task4
J Weeks9831563 Task4jenw
 

What's hot (17)

Pipe Conecpt Map
Pipe Conecpt MapPipe Conecpt Map
Pipe Conecpt Map
 
Concept mapping, Simulation, Gradation
Concept mapping, Simulation, GradationConcept mapping, Simulation, Gradation
Concept mapping, Simulation, Gradation
 
Concept map workshop AEME 2014
Concept map workshop AEME 2014Concept map workshop AEME 2014
Concept map workshop AEME 2014
 
Concept map
Concept mapConcept map
Concept map
 
Social Studies Concepts Maps
Social Studies Concepts MapsSocial Studies Concepts Maps
Social Studies Concepts Maps
 
Intro to concept maps v3 march 2012
Intro to concept maps v3 march 2012Intro to concept maps v3 march 2012
Intro to concept maps v3 march 2012
 
Presentation1 psycholiguistics
Presentation1 psycholiguisticsPresentation1 psycholiguistics
Presentation1 psycholiguistics
 
ONLINE ASSIGNMENT
ONLINE ASSIGNMENT ONLINE ASSIGNMENT
ONLINE ASSIGNMENT
 
Graphic inquiry
Graphic inquiryGraphic inquiry
Graphic inquiry
 
Visual tools for teaching science in colleges
Visual tools for teaching  science in collegesVisual tools for teaching  science in colleges
Visual tools for teaching science in colleges
 
Gestalt
GestaltGestalt
Gestalt
 
Jclarke using visual_organizers_to_focus_on_thinking1
Jclarke using visual_organizers_to_focus_on_thinking1Jclarke using visual_organizers_to_focus_on_thinking1
Jclarke using visual_organizers_to_focus_on_thinking1
 
Schema Learning Theory Comparative Organizer
Schema Learning Theory Comparative OrganizerSchema Learning Theory Comparative Organizer
Schema Learning Theory Comparative Organizer
 
Social Studies
Social StudiesSocial Studies
Social Studies
 
Teaching by guiding_cognitive_processes_during_learning
Teaching by guiding_cognitive_processes_during_learningTeaching by guiding_cognitive_processes_during_learning
Teaching by guiding_cognitive_processes_during_learning
 
J Weeks9831563 Task4
J Weeks9831563 Task4J Weeks9831563 Task4
J Weeks9831563 Task4
 
Graphic organizer
Graphic organizerGraphic organizer
Graphic organizer
 

Similar to GRAPHIC ORGANISER

concept mapping
concept mappingconcept mapping
concept mappinganoop kp
 
A MIND MAP THE TOOL OF COGNITION
A MIND MAP  THE TOOL OF COGNITIONA MIND MAP  THE TOOL OF COGNITION
A MIND MAP THE TOOL OF COGNITIONAmanda Summers
 
Mind Maps and Graphic Organizers.pptx
Mind Maps and Graphic Organizers.pptxMind Maps and Graphic Organizers.pptx
Mind Maps and Graphic Organizers.pptxSyedaSalmaBatool
 
Social Studies Concepts Maps
Social Studies Concepts MapsSocial Studies Concepts Maps
Social Studies Concepts Mapscamilo
 
Concept mapping, mind mapping and argumentmapping what are .docx
Concept mapping, mind mapping and argumentmapping what are .docxConcept mapping, mind mapping and argumentmapping what are .docx
Concept mapping, mind mapping and argumentmapping what are .docxpatricke8
 
Teaching With Thinking Graphics
Teaching With Thinking GraphicsTeaching With Thinking Graphics
Teaching With Thinking Graphicsjgentile
 
Concept And Mind Mapping
Concept And Mind MappingConcept And Mind Mapping
Concept And Mind MappingAndrea Mercado
 
Concept mapping: Inspiration
Concept mapping: InspirationConcept mapping: Inspiration
Concept mapping: InspirationBessie Zhong
 
Concept map ppt
Concept map pptConcept map ppt
Concept map pptconactarti
 
An Experimental Study On The Effectiveness Of Mind-Mapping
An Experimental Study On The Effectiveness Of Mind-MappingAn Experimental Study On The Effectiveness Of Mind-Mapping
An Experimental Study On The Effectiveness Of Mind-MappingMichele Thomas
 
Concept map
Concept mapConcept map
Concept mapkavaratu
 
C:\Fakepath\Social Studies[1]
C:\Fakepath\Social Studies[1]C:\Fakepath\Social Studies[1]
C:\Fakepath\Social Studies[1]campocorrales
 

Similar to GRAPHIC ORGANISER (20)

concept mapping
concept mappingconcept mapping
concept mapping
 
A MIND MAP THE TOOL OF COGNITION
A MIND MAP  THE TOOL OF COGNITIONA MIND MAP  THE TOOL OF COGNITION
A MIND MAP THE TOOL OF COGNITION
 
Mind Maps and Graphic Organizers.pptx
Mind Maps and Graphic Organizers.pptxMind Maps and Graphic Organizers.pptx
Mind Maps and Graphic Organizers.pptx
 
Social Studies Concepts Maps
Social Studies Concepts MapsSocial Studies Concepts Maps
Social Studies Concepts Maps
 
Concept mapping, mind mapping and argumentmapping what are .docx
Concept mapping, mind mapping and argumentmapping what are .docxConcept mapping, mind mapping and argumentmapping what are .docx
Concept mapping, mind mapping and argumentmapping what are .docx
 
Meda5400ConceptMapping
Meda5400ConceptMappingMeda5400ConceptMapping
Meda5400ConceptMapping
 
Assignment
AssignmentAssignment
Assignment
 
Assignment
AssignmentAssignment
Assignment
 
Assignment
AssignmentAssignment
Assignment
 
concept maping 2.pdf
concept maping 2.pdfconcept maping 2.pdf
concept maping 2.pdf
 
Teaching With Thinking Graphics
Teaching With Thinking GraphicsTeaching With Thinking Graphics
Teaching With Thinking Graphics
 
Concept Mapping
Concept MappingConcept Mapping
Concept Mapping
 
Concept And Mind Mapping
Concept And Mind MappingConcept And Mind Mapping
Concept And Mind Mapping
 
Concept mapping: Inspiration
Concept mapping: InspirationConcept mapping: Inspiration
Concept mapping: Inspiration
 
Concept map ppt
Concept map pptConcept map ppt
Concept map ppt
 
ICM Concept Map
ICM Concept Map ICM Concept Map
ICM Concept Map
 
Concept maps
Concept maps Concept maps
Concept maps
 
An Experimental Study On The Effectiveness Of Mind-Mapping
An Experimental Study On The Effectiveness Of Mind-MappingAn Experimental Study On The Effectiveness Of Mind-Mapping
An Experimental Study On The Effectiveness Of Mind-Mapping
 
Concept map
Concept mapConcept map
Concept map
 
C:\Fakepath\Social Studies[1]
C:\Fakepath\Social Studies[1]C:\Fakepath\Social Studies[1]
C:\Fakepath\Social Studies[1]
 

More from SARATH K C

Global warming
Global warmingGlobal warming
Global warmingSARATH K C
 
Land pollution
Land pollutionLand pollution
Land pollutionSARATH K C
 
Mixture Seperation
Mixture SeperationMixture Seperation
Mixture SeperationSARATH K C
 
WIKI, BLOG, FORUM
WIKI, BLOG, FORUMWIKI, BLOG, FORUM
WIKI, BLOG, FORUMSARATH K C
 
TOOLS AND TECHNIQUES
TOOLS AND TECHNIQUESTOOLS AND TECHNIQUES
TOOLS AND TECHNIQUESSARATH K C
 
National Policy
National PolicyNational Policy
National PolicySARATH K C
 

More from SARATH K C (8)

Global warming
Global warmingGlobal warming
Global warming
 
Land pollution
Land pollutionLand pollution
Land pollution
 
Air polllt
Air pollltAir polllt
Air polllt
 
Acid rain
Acid rainAcid rain
Acid rain
 
Mixture Seperation
Mixture SeperationMixture Seperation
Mixture Seperation
 
WIKI, BLOG, FORUM
WIKI, BLOG, FORUMWIKI, BLOG, FORUM
WIKI, BLOG, FORUM
 
TOOLS AND TECHNIQUES
TOOLS AND TECHNIQUESTOOLS AND TECHNIQUES
TOOLS AND TECHNIQUES
 
National Policy
National PolicyNational Policy
National Policy
 

Recently uploaded

Final demo Grade 9 for demo Plan dessert.pptx
Final demo Grade 9 for demo Plan dessert.pptxFinal demo Grade 9 for demo Plan dessert.pptx
Final demo Grade 9 for demo Plan dessert.pptxAvyJaneVismanos
 
Presiding Officer Training module 2024 lok sabha elections
Presiding Officer Training module 2024 lok sabha electionsPresiding Officer Training module 2024 lok sabha elections
Presiding Officer Training module 2024 lok sabha electionsanshu789521
 
call girls in Kamla Market (DELHI) 🔝 >༒9953330565🔝 genuine Escort Service 🔝✔️✔️
call girls in Kamla Market (DELHI) 🔝 >༒9953330565🔝 genuine Escort Service 🔝✔️✔️call girls in Kamla Market (DELHI) 🔝 >༒9953330565🔝 genuine Escort Service 🔝✔️✔️
call girls in Kamla Market (DELHI) 🔝 >༒9953330565🔝 genuine Escort Service 🔝✔️✔️9953056974 Low Rate Call Girls In Saket, Delhi NCR
 
Biting mechanism of poisonous snakes.pdf
Biting mechanism of poisonous snakes.pdfBiting mechanism of poisonous snakes.pdf
Biting mechanism of poisonous snakes.pdfadityarao40181
 
Alper Gobel In Media Res Media Component
Alper Gobel In Media Res Media ComponentAlper Gobel In Media Res Media Component
Alper Gobel In Media Res Media ComponentInMediaRes1
 
Paris 2024 Olympic Geographies - an activity
Paris 2024 Olympic Geographies - an activityParis 2024 Olympic Geographies - an activity
Paris 2024 Olympic Geographies - an activityGeoBlogs
 
History Class XII Ch. 3 Kinship, Caste and Class (1).pptx
History Class XII Ch. 3 Kinship, Caste and Class (1).pptxHistory Class XII Ch. 3 Kinship, Caste and Class (1).pptx
History Class XII Ch. 3 Kinship, Caste and Class (1).pptxsocialsciencegdgrohi
 
POINT- BIOCHEMISTRY SEM 2 ENZYMES UNIT 5.pptx
POINT- BIOCHEMISTRY SEM 2 ENZYMES UNIT 5.pptxPOINT- BIOCHEMISTRY SEM 2 ENZYMES UNIT 5.pptx
POINT- BIOCHEMISTRY SEM 2 ENZYMES UNIT 5.pptxSayali Powar
 
Pharmacognosy Flower 3. Compositae 2023.pdf
Pharmacognosy Flower 3. Compositae 2023.pdfPharmacognosy Flower 3. Compositae 2023.pdf
Pharmacognosy Flower 3. Compositae 2023.pdfMahmoud M. Sallam
 
Software Engineering Methodologies (overview)
Software Engineering Methodologies (overview)Software Engineering Methodologies (overview)
Software Engineering Methodologies (overview)eniolaolutunde
 
Employee wellbeing at the workplace.pptx
Employee wellbeing at the workplace.pptxEmployee wellbeing at the workplace.pptx
Employee wellbeing at the workplace.pptxNirmalaLoungPoorunde1
 
BASLIQ CURRENT LOOKBOOK LOOKBOOK(1) (1).pdf
BASLIQ CURRENT LOOKBOOK  LOOKBOOK(1) (1).pdfBASLIQ CURRENT LOOKBOOK  LOOKBOOK(1) (1).pdf
BASLIQ CURRENT LOOKBOOK LOOKBOOK(1) (1).pdfSoniaTolstoy
 
Computed Fields and api Depends in the Odoo 17
Computed Fields and api Depends in the Odoo 17Computed Fields and api Depends in the Odoo 17
Computed Fields and api Depends in the Odoo 17Celine George
 
भारत-रोम व्यापार.pptx, Indo-Roman Trade,
भारत-रोम व्यापार.pptx, Indo-Roman Trade,भारत-रोम व्यापार.pptx, Indo-Roman Trade,
भारत-रोम व्यापार.pptx, Indo-Roman Trade,Virag Sontakke
 
Science lesson Moon for 4th quarter lesson
Science lesson Moon for 4th quarter lessonScience lesson Moon for 4th quarter lesson
Science lesson Moon for 4th quarter lessonJericReyAuditor
 
Science 7 - LAND and SEA BREEZE and its Characteristics
Science 7 - LAND and SEA BREEZE and its CharacteristicsScience 7 - LAND and SEA BREEZE and its Characteristics
Science 7 - LAND and SEA BREEZE and its CharacteristicsKarinaGenton
 
Introduction to AI in Higher Education_draft.pptx
Introduction to AI in Higher Education_draft.pptxIntroduction to AI in Higher Education_draft.pptx
Introduction to AI in Higher Education_draft.pptxpboyjonauth
 
Organic Name Reactions for the students and aspirants of Chemistry12th.pptx
Organic Name Reactions  for the students and aspirants of Chemistry12th.pptxOrganic Name Reactions  for the students and aspirants of Chemistry12th.pptx
Organic Name Reactions for the students and aspirants of Chemistry12th.pptxVS Mahajan Coaching Centre
 
Mastering the Unannounced Regulatory Inspection
Mastering the Unannounced Regulatory InspectionMastering the Unannounced Regulatory Inspection
Mastering the Unannounced Regulatory InspectionSafetyChain Software
 

Recently uploaded (20)

Final demo Grade 9 for demo Plan dessert.pptx
Final demo Grade 9 for demo Plan dessert.pptxFinal demo Grade 9 for demo Plan dessert.pptx
Final demo Grade 9 for demo Plan dessert.pptx
 
Presiding Officer Training module 2024 lok sabha elections
Presiding Officer Training module 2024 lok sabha electionsPresiding Officer Training module 2024 lok sabha elections
Presiding Officer Training module 2024 lok sabha elections
 
call girls in Kamla Market (DELHI) 🔝 >༒9953330565🔝 genuine Escort Service 🔝✔️✔️
call girls in Kamla Market (DELHI) 🔝 >༒9953330565🔝 genuine Escort Service 🔝✔️✔️call girls in Kamla Market (DELHI) 🔝 >༒9953330565🔝 genuine Escort Service 🔝✔️✔️
call girls in Kamla Market (DELHI) 🔝 >༒9953330565🔝 genuine Escort Service 🔝✔️✔️
 
Biting mechanism of poisonous snakes.pdf
Biting mechanism of poisonous snakes.pdfBiting mechanism of poisonous snakes.pdf
Biting mechanism of poisonous snakes.pdf
 
Alper Gobel In Media Res Media Component
Alper Gobel In Media Res Media ComponentAlper Gobel In Media Res Media Component
Alper Gobel In Media Res Media Component
 
Paris 2024 Olympic Geographies - an activity
Paris 2024 Olympic Geographies - an activityParis 2024 Olympic Geographies - an activity
Paris 2024 Olympic Geographies - an activity
 
History Class XII Ch. 3 Kinship, Caste and Class (1).pptx
History Class XII Ch. 3 Kinship, Caste and Class (1).pptxHistory Class XII Ch. 3 Kinship, Caste and Class (1).pptx
History Class XII Ch. 3 Kinship, Caste and Class (1).pptx
 
POINT- BIOCHEMISTRY SEM 2 ENZYMES UNIT 5.pptx
POINT- BIOCHEMISTRY SEM 2 ENZYMES UNIT 5.pptxPOINT- BIOCHEMISTRY SEM 2 ENZYMES UNIT 5.pptx
POINT- BIOCHEMISTRY SEM 2 ENZYMES UNIT 5.pptx
 
Pharmacognosy Flower 3. Compositae 2023.pdf
Pharmacognosy Flower 3. Compositae 2023.pdfPharmacognosy Flower 3. Compositae 2023.pdf
Pharmacognosy Flower 3. Compositae 2023.pdf
 
Software Engineering Methodologies (overview)
Software Engineering Methodologies (overview)Software Engineering Methodologies (overview)
Software Engineering Methodologies (overview)
 
Employee wellbeing at the workplace.pptx
Employee wellbeing at the workplace.pptxEmployee wellbeing at the workplace.pptx
Employee wellbeing at the workplace.pptx
 
BASLIQ CURRENT LOOKBOOK LOOKBOOK(1) (1).pdf
BASLIQ CURRENT LOOKBOOK  LOOKBOOK(1) (1).pdfBASLIQ CURRENT LOOKBOOK  LOOKBOOK(1) (1).pdf
BASLIQ CURRENT LOOKBOOK LOOKBOOK(1) (1).pdf
 
Computed Fields and api Depends in the Odoo 17
Computed Fields and api Depends in the Odoo 17Computed Fields and api Depends in the Odoo 17
Computed Fields and api Depends in the Odoo 17
 
भारत-रोम व्यापार.pptx, Indo-Roman Trade,
भारत-रोम व्यापार.pptx, Indo-Roman Trade,भारत-रोम व्यापार.pptx, Indo-Roman Trade,
भारत-रोम व्यापार.pptx, Indo-Roman Trade,
 
9953330565 Low Rate Call Girls In Rohini Delhi NCR
9953330565 Low Rate Call Girls In Rohini  Delhi NCR9953330565 Low Rate Call Girls In Rohini  Delhi NCR
9953330565 Low Rate Call Girls In Rohini Delhi NCR
 
Science lesson Moon for 4th quarter lesson
Science lesson Moon for 4th quarter lessonScience lesson Moon for 4th quarter lesson
Science lesson Moon for 4th quarter lesson
 
Science 7 - LAND and SEA BREEZE and its Characteristics
Science 7 - LAND and SEA BREEZE and its CharacteristicsScience 7 - LAND and SEA BREEZE and its Characteristics
Science 7 - LAND and SEA BREEZE and its Characteristics
 
Introduction to AI in Higher Education_draft.pptx
Introduction to AI in Higher Education_draft.pptxIntroduction to AI in Higher Education_draft.pptx
Introduction to AI in Higher Education_draft.pptx
 
Organic Name Reactions for the students and aspirants of Chemistry12th.pptx
Organic Name Reactions  for the students and aspirants of Chemistry12th.pptxOrganic Name Reactions  for the students and aspirants of Chemistry12th.pptx
Organic Name Reactions for the students and aspirants of Chemistry12th.pptx
 
Mastering the Unannounced Regulatory Inspection
Mastering the Unannounced Regulatory InspectionMastering the Unannounced Regulatory Inspection
Mastering the Unannounced Regulatory Inspection
 

GRAPHIC ORGANISER

  • 2. Graphical organisers are instruments of representation, illustration and modelling of information in visual or graphical forms that are used to achieve a meaningful learning. They are set of learning strategies which involves translating words expressed in linear forms into visual structures.
  • 3. It helps students to organise structure the information and relate concept with other concept. Graphical organisers are pictorical way of constructing knowledge and organising information. They help to convert seemingly disjoint information into a structured simple to read graphic display. The resulting visual display conveys complex information in a simple to understand manner.
  • 4. In general, the Graphic organisers function as a means for Clarifying and organising knowledge and reasoning Identify the conceptual errors Strengthening the learning process Integrating the new knowledge in the prior knowledge system, leading to a superior learning process
  • 5. Graphic organisers are of different types. They are, Cyclic Eg:- cycle diagram Hierarchical Eg:- step by step, tree chart Sequential Eg:- flow chart, series of events Conceptual Eg:- fish bone, concept map, mind map
  • 7. A concept map or conceptual diagram is a diagram that depicts suggested relationships between concepts. It is a graphical tool that instructional designers, engineers, technical writers, and others use to organize and structure knowledge.
  • 8. A concept map typically represents ideas and information as boxes or circles, which it connects with labeled arrows in a downward-branching hierarchical structure. The relationship between concepts can be articulated in linking phrases such as causes, requires, or contributes to. The technique for visualizing these relationships among different concepts is called concept mapping. Concept maps define the ontology of computer systems, for example with the object-role modeling or Unified Modeling Language formalism.
  • 9. A concept map is a way of representing relationships between ideas, images, or words in the same way that asentence diagram represents the grammar of a sentence, a road map represents the locations of highways and towns, and a circuit diagram represents the workings of an electrical appliance. In a concept map, each word or phrase connects to another, and links back to the original idea, word, or phrase. Concept maps are a way to develop logical thinking and study skills by revealing connections and helping students see how individual ideas form a larger whole. An example of the use of concept maps is provided in the context of learning about types of fuel.
  • 10. Concept maps were developed to enhance meaningful learning in the sciences. A well-made concept map grows within a context frame defined by an explicit "focus question", while a mind map often has only branches radiating out from a central picture. Some research evidence suggests that the brain stores knowledge as productions (situation-response conditionals) that act on declarative memory content, which is also referred to as chunks or propositions. Because concept maps are constructed to reflect organization of the declarative memory system, they facilitate sense-making and meaningful learning on the part of individuals who make concept maps and those who use them.
  • 11.
  • 12.
  • 13. The technique of concept mapping was developed by Joseph D. Novak and his research team at Cornell University in the 1970s as a means of representing the emerging science knowledge of students. It has subsequently been used as a tool to increase meaningful learning in the sciences and other subjects as well as to represent the expert knowledge of individuals and teams in education, government and business. Concept maps have their origin in the learning movement called constructivism. In particular, constructivists hold that learners actively construct knowledge. Novak's work is based on the cognitive theories of David Ausubel, who stressed the importance of prior knowledge in being able to learn (or assimilate) new concepts: "The most important single factor influencing learning is what the learner already knows. Ascertain this and teach accordingly."
  • 14. Novak taught students as young as six years old to make concept maps to represent their response to focus questions such as "What is water?" "What causes the seasons?" In his book Learning How to Learn, Novak states that a "meaningful learning involves the assimilation of new concepts and propositions into existing cognitive structures." Various attempts have been made to conceptualize the process of creating concept maps. Ray McAleese, in a series of articles, has suggested that mapping is a process of off-loading. In this 1998 paper, McAleese draws on the work of Sowa and a paper by Sweller & Chandler. In essence, McAleese suggests that the process of making knowledge explicit, using nodes and relationships, allows the individual to become aware of what they know and as a result to be able to modify what they know. Maria Birbili applies that same idea to helping young children learn to think about what they know. The concept of the knowledge arena is suggestive of a virtual space where learners may explore what they know and what they do not know.
  • 15. Uses Concept maps are used to stimulate the generation of ideas, and are believed to aid creativity. Concept mapping is also sometimes used for brain-storming. Although they are often personalized and idiosyncratic, concept maps can be used to communicate complex ideas. Formalized concept maps are used in software design, where a common usage isUnified Modeling Language diagramming amongst similar conventions and development methodologies. Concept mapping can also be seen as a first step in ontology- building, and can also be used flexibly to represent formal argument. Concept maps are widely used in education and business.
  • 16. Uses include: Note taking and summarizing gleaning key concepts, their relationships and hierarchy from documents and source materials New knowledge creation: e.g., transforming tacit knowledge into an organizational resource, mapping team knowledge Institutional knowledge preservation (retention), e.g., eliciting and mapping expert knowledge of employees prior to retirement Collaborative knowledge modeling and the transfer of expert knowledge Facilitating the creation of shared vision and shared understanding within a team or organization
  • 17. Instructional design: concept maps used as Ausubelian "advance organizers" that provide an initial conceptual frame for subsequent information and learning. Training: concept maps used as Ausubelian "advanced organizers" to represent the training context and its relationship to their jobs, to the organization's strategic objectives, to training goals. Communicating complex ideas and arguments Examining the symmetry of complex ideas and arguments and associated terminology Detailing the entire structure of an idea, train of thought, or line of argument (with the specific goal of exposing faults, errors, or gaps in one's own reasoning) for the scrutiny of others. Enhancing metacognition (learning to learn, and thinking about knowledge) Improving language ability Assessing learner understanding of learning objectives, concepts, and the relationship among those concepts Lexicon development.
  • 19. A mind map is a diagram used to visually organize information. A mind map is hierarchical and shows relationships among pieces of the whole. It is often created around a single concept, drawn as an image in the center of a blank page, to which associated representations of ideas such as images, words and parts of words are added. Major ideas are connected directly to the central concept, and other ideas branch out from those. Mind maps can be drawn by hand, either as "rough notes" during a lecture, meeting or planning session, for example, or as higher quality pictures when more time is available. Mind maps are considered to be a type of spider diagram. A similar concept in the 1970s was "idea sun bursting"
  • 20. Origins Although the term "mind map" was first popularized by British popular psychology author and television personality Tony Buzan, the use of diagrams that visually "map" information using branching and radial maps traces back centuries. These pictorial methods record knowledge and model systems, and have a long history in learning, brainstorming, memory, visual thinking, and problem solving by educators, engineers, psychologists, and others. Some of the earliest examples of such graphical records were developed by Porphyry of Tyros, a noted thinker of the 3rd century, as he graphically visualized the conceptcategories of Aristotle. Philosopher Ramon Llull (1235–1315) also used such techniques. The semantic network was developed in the late 1950s as a theory to understand human learning and developed further by Allan M. Collins and M. Ross Quillian during the early 1960s. Mind maps are similar in radial structure to concept maps, developed by learning experts in the 1970s, but differ in that the former are simplified by focusing around a single central key concept.
  • 21. Mind map guidelines Buzan suggests the following guidelines for creating mind maps: •Start in the center with an image of the topic, using at least 3 colors. •Use images, symbols, codes, and dimensions throughout your mind map. •Select key words and print using upper or lower case letters. •Each word/image is best alone and sitting on its own line. •The lines should be connected, starting from the central image. The lines become thinner as they radiate out from the center. •Make the lines the same length as the word/image they support. •Use multiple colors throughout the mind map, for visual stimulation and also for encoding or grouping. •Develop your own personal style of mind mapping. •Use emphasis and show associations in your mind map. •Keep the mind map clear by using radial hierarchy or outlines to embrace your branches.
  • 22. Uses As with other diagramming tools, mind maps can be used to generate, visualize, structure, and classify ideas, and as an aid to studying and organizing information, solving problems, making decisions, and writing. Mind maps have many applications in personal, family, educational, and business situations, including notetaking, brainstorming (wherein ideas are inserted into the map radially around the center node, without the implicit prioritization that comes from hierarchy or sequential arrangements, and wherein grouping and organizing is reserved for later stages), summarizing, as a mnemonic technique, or to sort out a complicated idea. Mind maps are also promoted as a way to collaborate in color pen creativity sessions. In addition to these direct use cases, data retrieved from mind maps can be used to enhance several other applications; for instance expert search systems, search engines and search and tag query recommender. To do so, mind maps can be analysed with classic methods of information retrieval to classify a mind map's author or documents that are linked from within the mind map.
  • 23.
  • 24.
  • 26. A flowchart is a type of diagram that uses an algorithm, workflow or process, showing the steps as boxes of various kinds, and their order by connecting them with arrows. This diagrammatic representation illustrates a solution model to a given problem. Flowcharts are used in analyzing, designing, documenting or managing a process or program in various fields.
  • 27. Flowcharts are used in designing and documenting simple processes or programs. Like other types of diagrams, they help visualize what is going on and thereby help understand a process, and perhaps also find flaws, bottlenecks, and other less-obvious features within it. There are many different types of flowcharts, and each type has its own repertoire of boxes and notational conventions. The two most common types of boxes in a flowchart are: •a processing step, usually called activity, and denoted as a rectangular box •a decision, usually denoted as a diamond. A flowchart is described as "cross-functional" when the page is divided into different swimlanes describing the control of different organizational units. A symbol appearing in a particular "lane" is within the control of that organizational unit. This technique allows the author to locate the responsibility for performing an action or making a decision correctly, showing the responsibility of each organizational unit for different parts of a single process.
  • 28. Flowcharts depict certain aspects of processes and they are usually complemented by other types of diagram. For instance, Kaoru Ishikawa defined the flowchart as one of the seven basic tools of quality control, next to the histogram,Pareto chart, check sheet, control chart, cause- and-effect diagram, and the scatter diagram. Similarly, in UML, a standard concept-modeling notation used in software development, the activity diagram, which is a type of flowchart, is just one of many different diagram types. Nassi-Shneiderman diagrams and Drakon-charts are an alternative notation for process flow. Common alternative names include: flowchart, process flowchart, functional flowchart, process map, process chart, functional process chart, business process model, process model, process flow diagram, work flow diagram, business flow diagram. The terms "flowchart" and "flow chart" are used interchangeably. The underlying graph structure of a flow chart is a flow graph, which abstracts away node types, their contents and other ancillary information.
  • 29. Types Sterneckert (2074703) suggested that flowcharts can be modeled from the perspective of different user groups (such as managers, system analysts and clerks) and that there are four general types: •Document flowcharts, showing controls over a document-flow through a system •Data flowcharts, showing controls over a data-flow in a system •System flowcharts, showing controls at a physical or resource level •Program flowchart, showing the controls in a program within a system
  • 30. Notice that every type of flowchart focuses on some kind of control, rather than on the particular flow itself. However, there are several of these classifications. For example, Andrew Veronis (1978) named three basic types of flowcharts: the system flowchart, thegeneral flowchart, and the detailed flowchart. That same year Marilyn Bohl (1978) stated "in practice, two kinds of flowcharts are used in solution planning:system flowcharts and program flowcharts...". More recently Mark A. Fryman (2001) stated that there are more differences: "Decision flowcharts, logic flowcharts, systems flowcharts, product flowcharts, and process flowcharts are just a few of the different types of flowcharts that are used in business and government". In addition, many diagram techniques exist that are similar to flowcharts but carry a different name, such as UML activity diagrams.
  • 31. Building blocks Common Shapes The following are some of the commonly used shapes used in flowcharts. Generally, flowcharts flow from top to bottom and left to right.
  • 32.
  • 33.
  • 34. Shape Name Description Flow Line An arrow coming from one symbol and ending at another symbol represents that control passes to the symbol the arrow points to. The line for the arrow can be solid or dashed. The meaning of the arrow with dashed line may differ from one flowchart to another and can be defined in the legend. Terminal Represented as circles, ovals, stadiums or rounded (fillet) rectangles. They usually contain the word "Start" or "End", or another phrase signaling the start or end of a process, such as "submit inquiry" or "receive product". Process Represented as rectangles. This shape is used to show that something is performed. Examples: "Add 1 to X", "replace identified part", "save changes", etc....
  • 35. Decision Represented as a diamond (rhombus) showing where a decision is necessary, commonly a Yes/No question or True/False test. The conditional symbol is peculiar in that it has two arrows coming out of it, usually from the bottom point and right point, one corresponding to Yes or True, and one corresponding to No or False. (The arrows should always be labeled.) More than two arrows can be used, but this is normally a clear indicator that a complex decision is being taken, in which case it may need to be broken-down further or replaced with the "predefined process" symbol. Decision can also help in the filtering of data. Input/Output Represented as a parallelogram. Involves receiving data and displaying processed data. Can only move from input to output and not vice versa. Examples: Get X from the user; display X.
  • 36. Annotation Annotations represent comments or remarks about the flowchart. Like comments found in high-level programming languages, they have no effect on the interpretation or behavior of the flowchart. Sometimes, the shape consists of a box with dashed (or dotted) lines. Predefined Process Represented as rectangles with double-struck vertical edges; these are used to show complex processing steps which may be detailed in a separate flowchart. Example: PROCESS-FILES. One subroutine may have multiple distinct entry points or exit flows (see coroutine). If so, these are shown as labeled 'wells' in the rectangle, and control arrows connect to these 'wells'.
  • 37. Preparation Represented as a hexagon. May also be called initialization. Shows operations which have no effect other than preparing a value for a subsequent conditional or decision step. Alternatively, this shape is used to replace the Decision Shape in the case of conditional looping.
  • 38. On-Page Connector Generally represented with a circle, showing where multiple control flows converge in a single exit flow. It will have more than one arrow coming into it, but only one going out. In simple cases, one may simply have an arrow point to another arrow instead. These are useful to represent an iterative process (what in Computer Science is called a loop). A loop may, for example, consist of a connector where control first enters, processing steps, a conditional with one arrow exiting the loop, and one going back to the connector. For additional clarity, wherever two lines accidentally cross in the drawing, one of them may be drawn with a small semicircle over the other, showing that no connection is intended. Off-Page Connector Represented as a home plate-shaped pentagon. Similar to the on-page connector except allows for placing a connector that connects to another page.
  • 39. Other Shapes A typical flowchart from older basic computer science textbooks may have the following kinds of symbols: Labeled connectors Represented by an identifying label inside a circle. Labeled connectors are used in complex or multi-sheet diagrams to substitute for arrows. For each label, the "outflow" connector must always be unique, but there may be any number of "inflow" connectors. In this case, a junction in control flow is implied. Concurrency symbol Represented by a double transverse line with any number of entry and exit arrows. These symbols are used whenever two or more control flows must operate simultaneously. The exit flows are activated concurrently, when all of the entry flows have reached the concurrency symbol. A concurrency symbol with a single entry flow is a fork; one with a single exit flow is a join.
  • 40. Grid
  • 41. Storyboard That has a few different layouts available for your storyboards. The grid layout is a format option that compares items across two axes. Grids are often the best choice for storyboards with lots of information, because grids are organized in a matrix. For simpler comparisons, we suggest you use a T-Chart.
  • 42. Grids Help You: •Organize Information •Compare Multiple Characteristics of a Topic or Topics •Create Graphic Organizers for Reading •Make Visual Tables
  • 43. Left-Hand Column with Row Titles The grid layout distinguishes itself from the traditional layout by having separate boxes for titles in addition to the cells. All grid layouts have a column on the left-hand side that cannot be removed. Subjects, topics, or major important criteria should be named in the title bars of this column. The size and the position of the title bar cannot be changed, but you are free to choose the font and color. Leave the white space below the title bar blank, or use it to show an example or description of the word in the title bar. While you can configure your grid however you choose, the grid was designed so that the main subjects occupy the row title bars, and the criteria or examples fill in the columns. For more advanced or more detailed storyboards, use the description boxes to explain the images in the cell.
  • 44.
  • 45.
  • 46. THANK YOU- Sarath K C - intradesigners4321@gmail.com