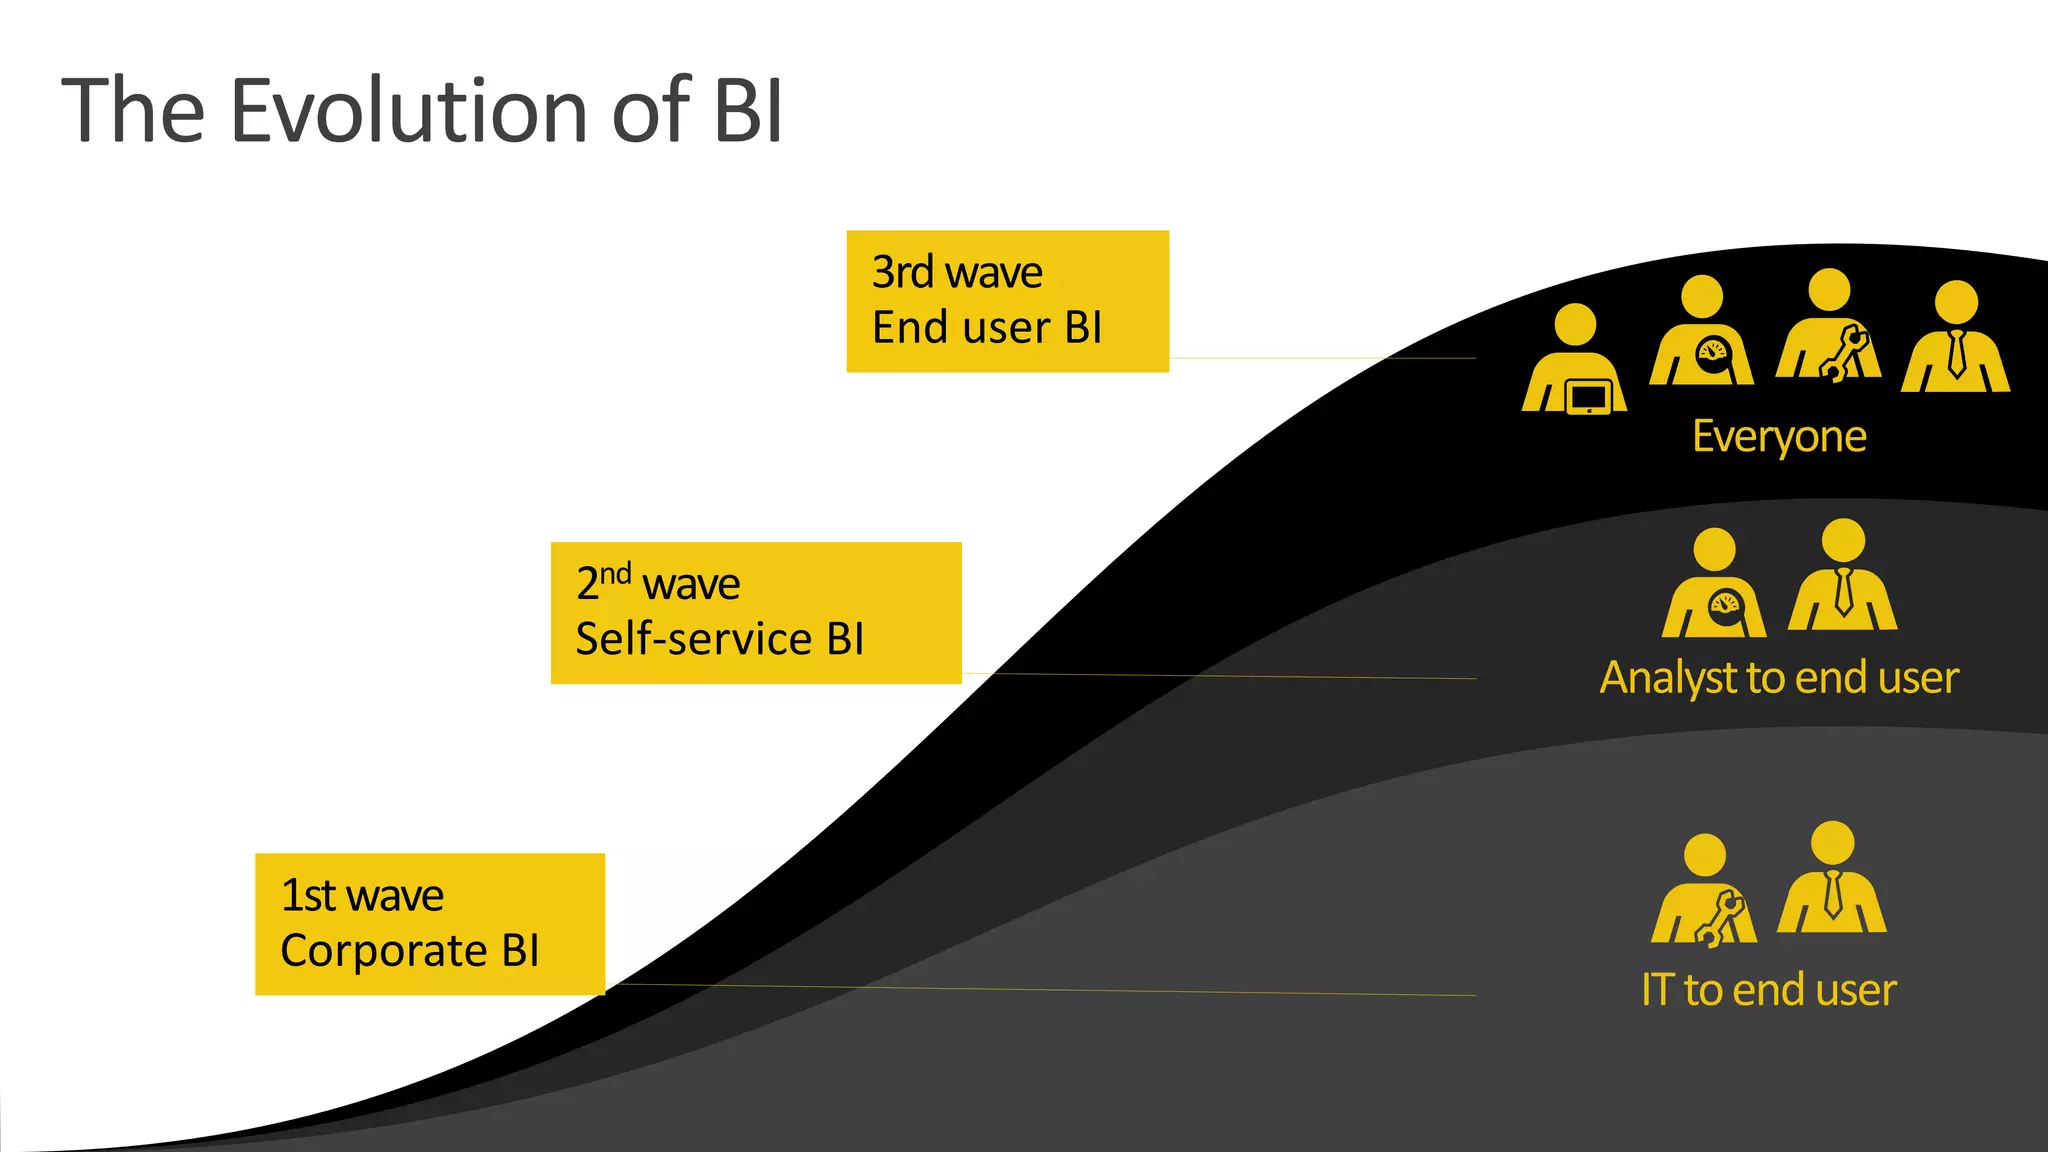
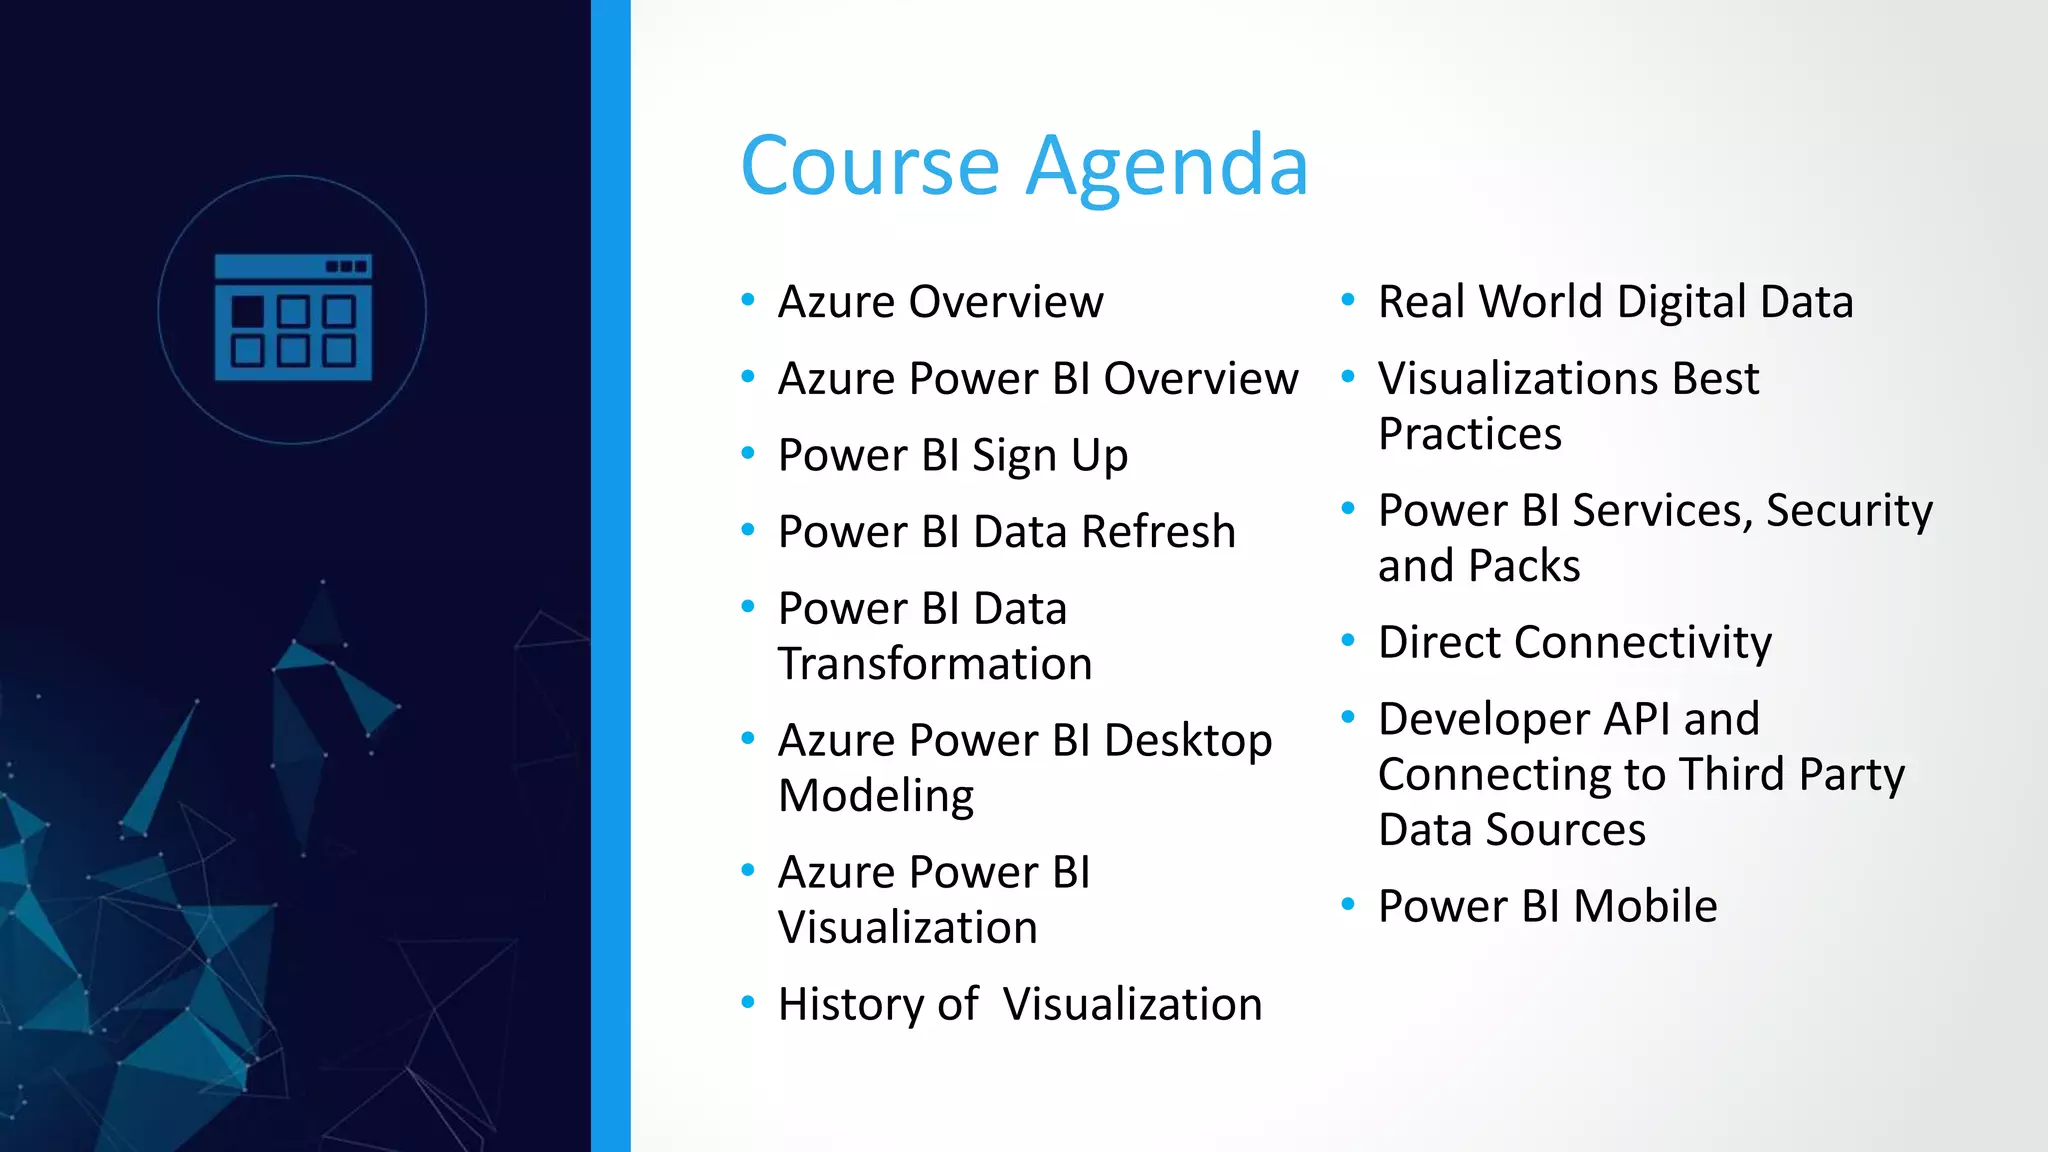
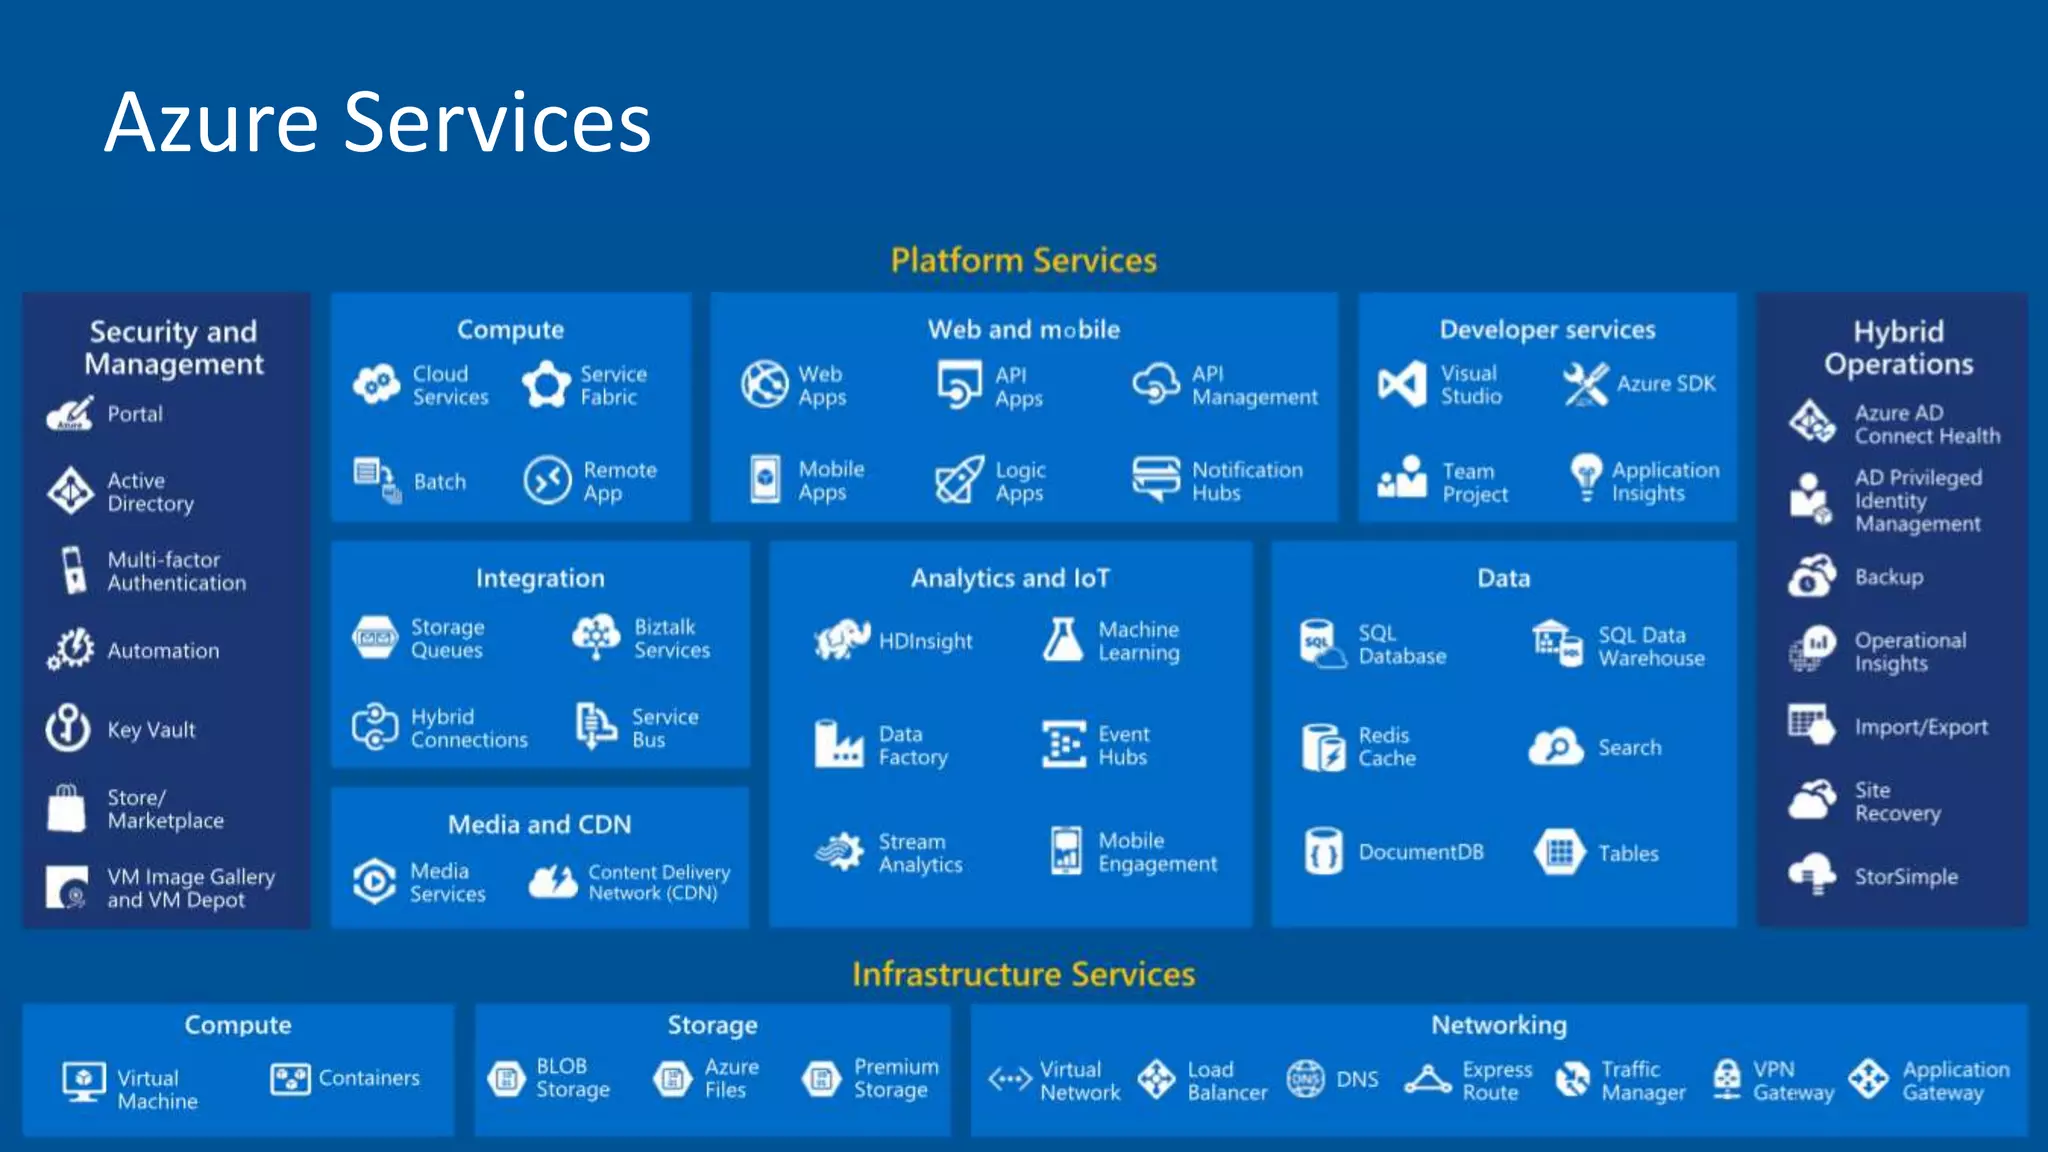
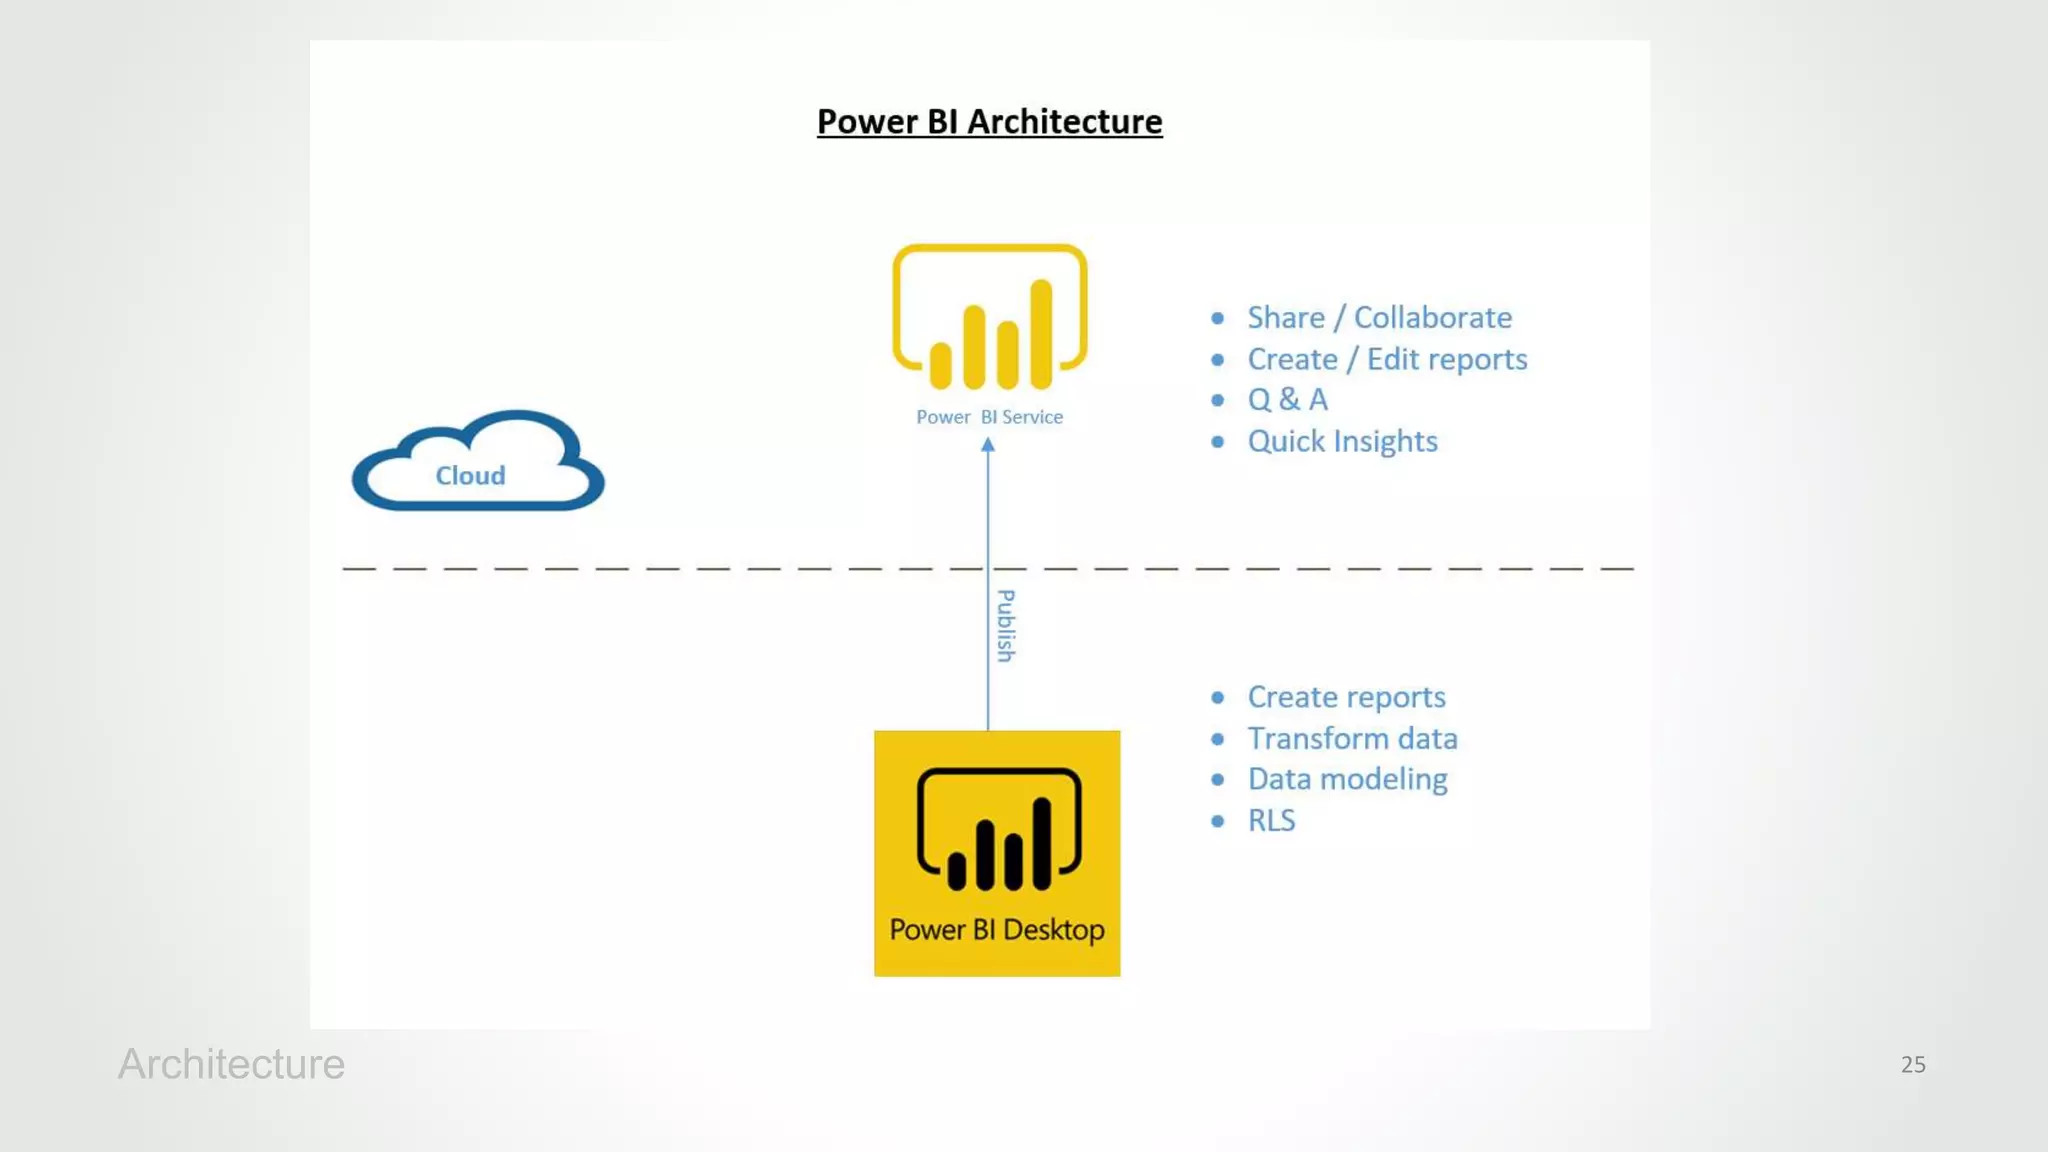
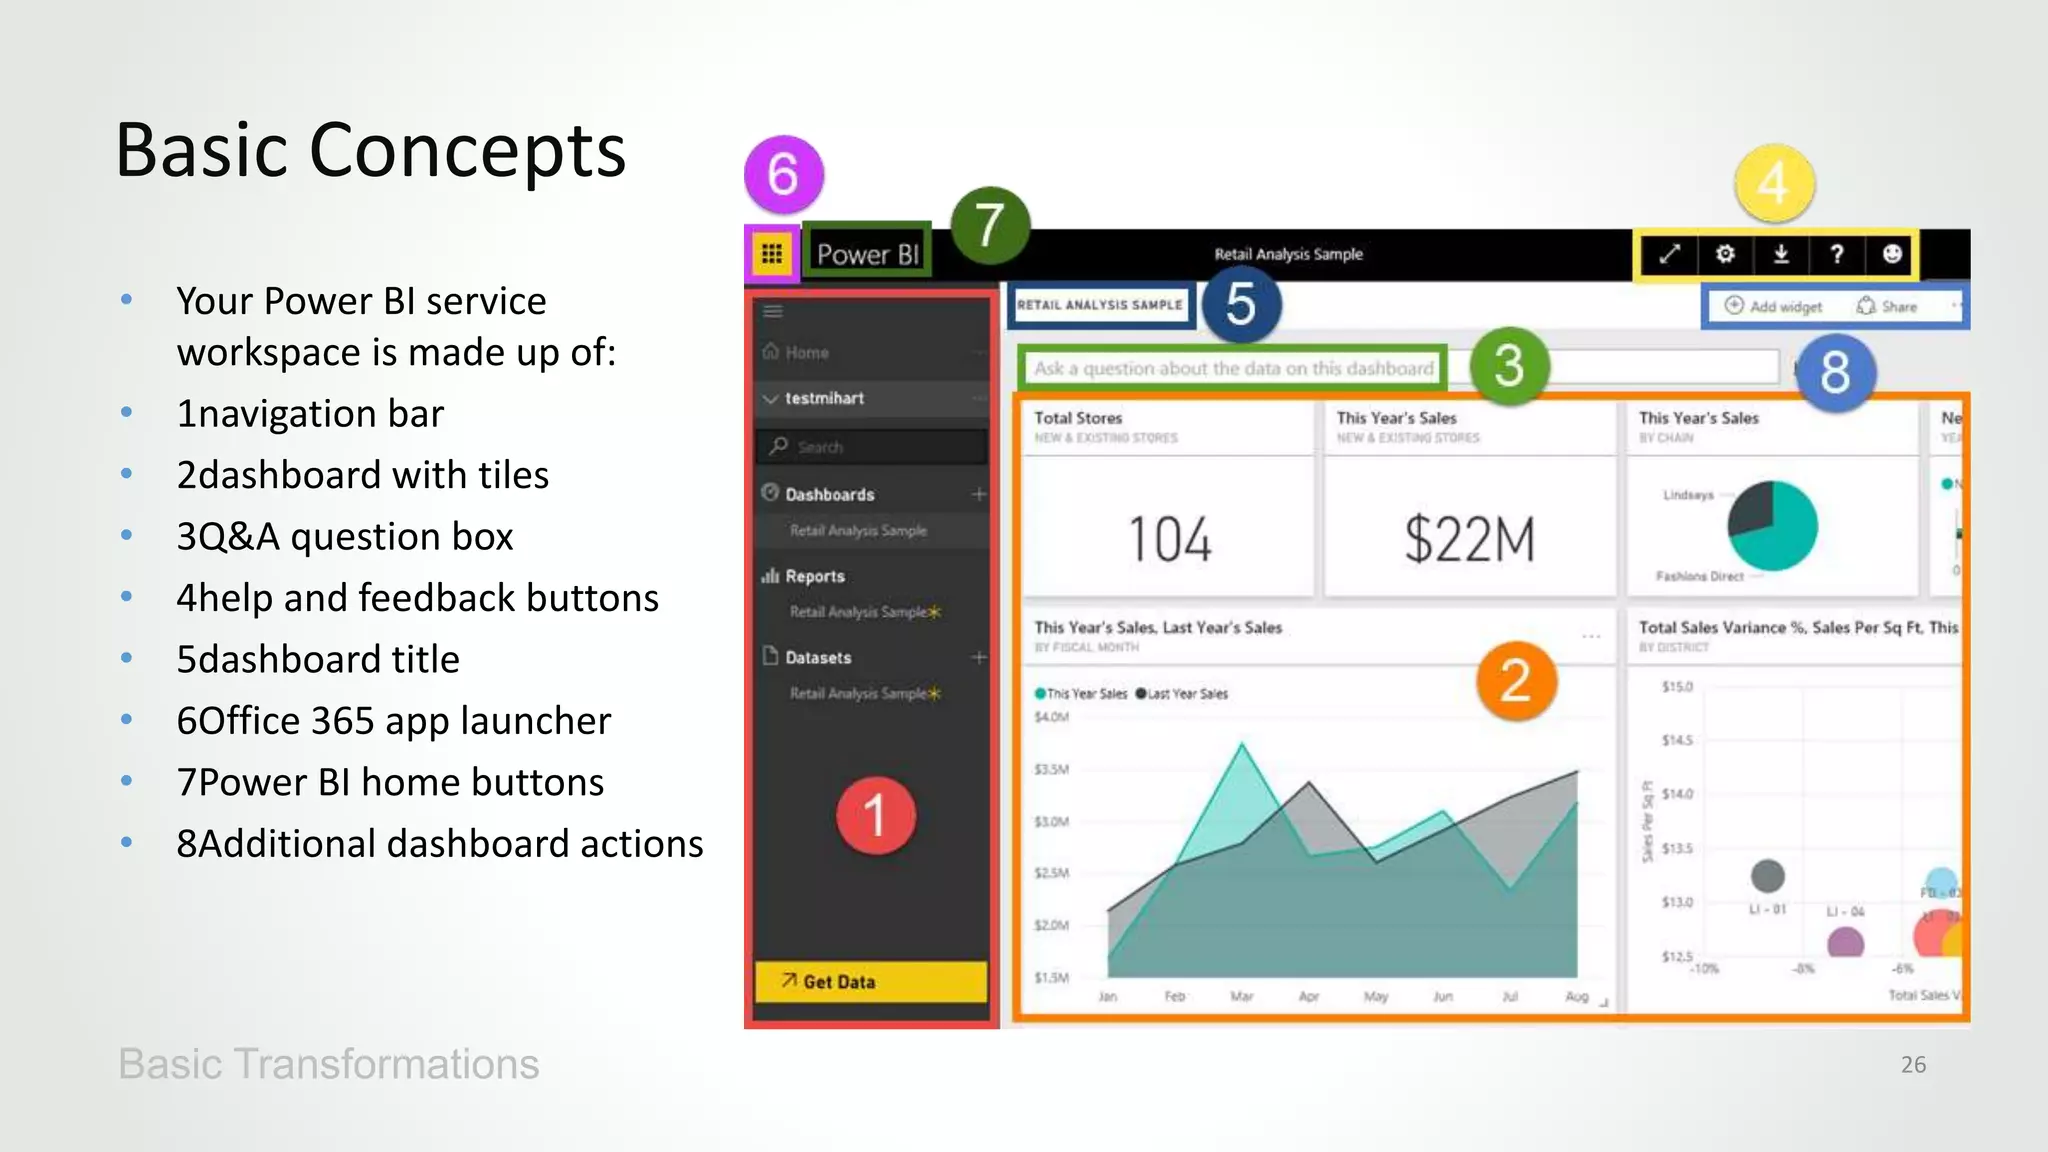
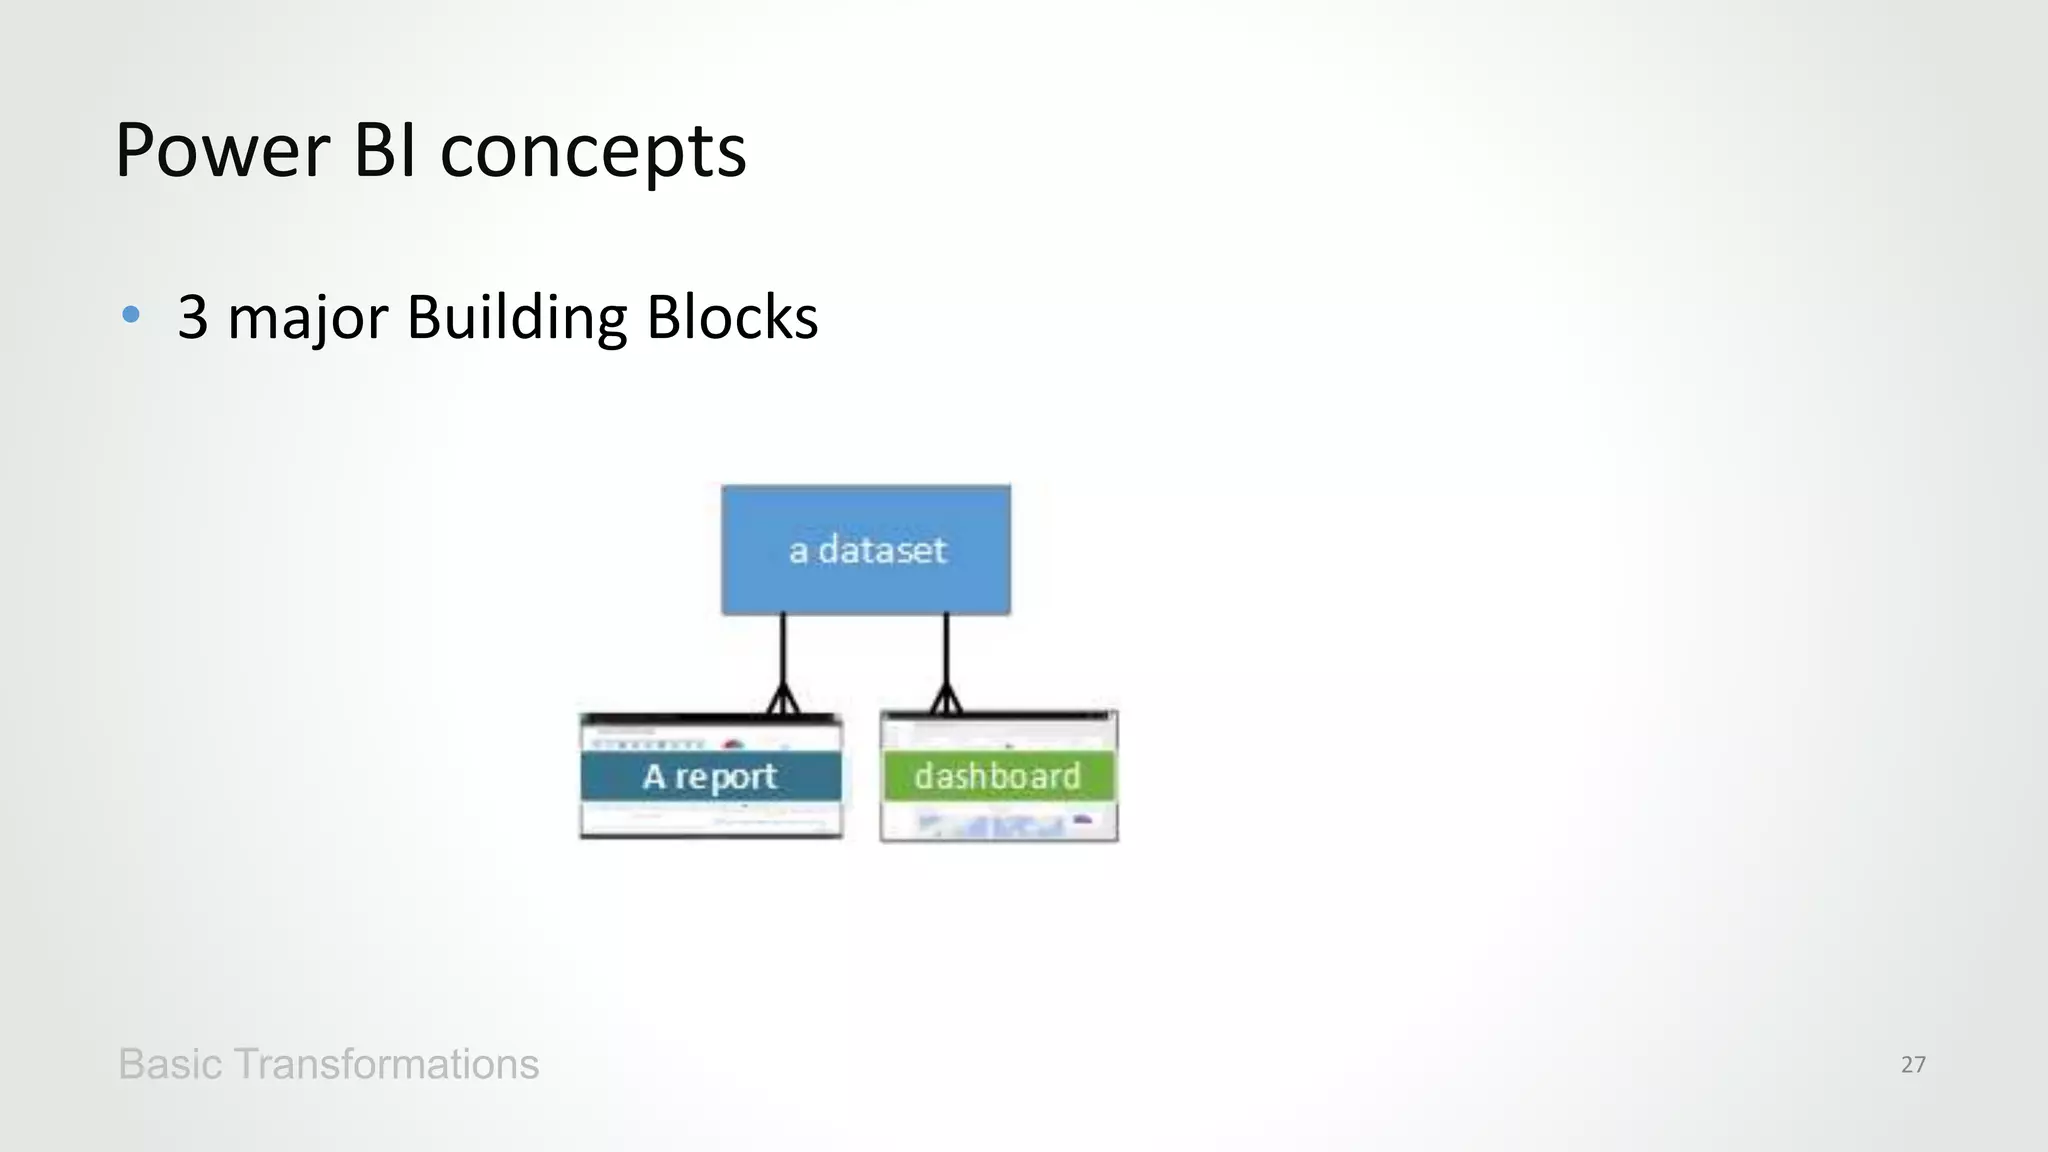
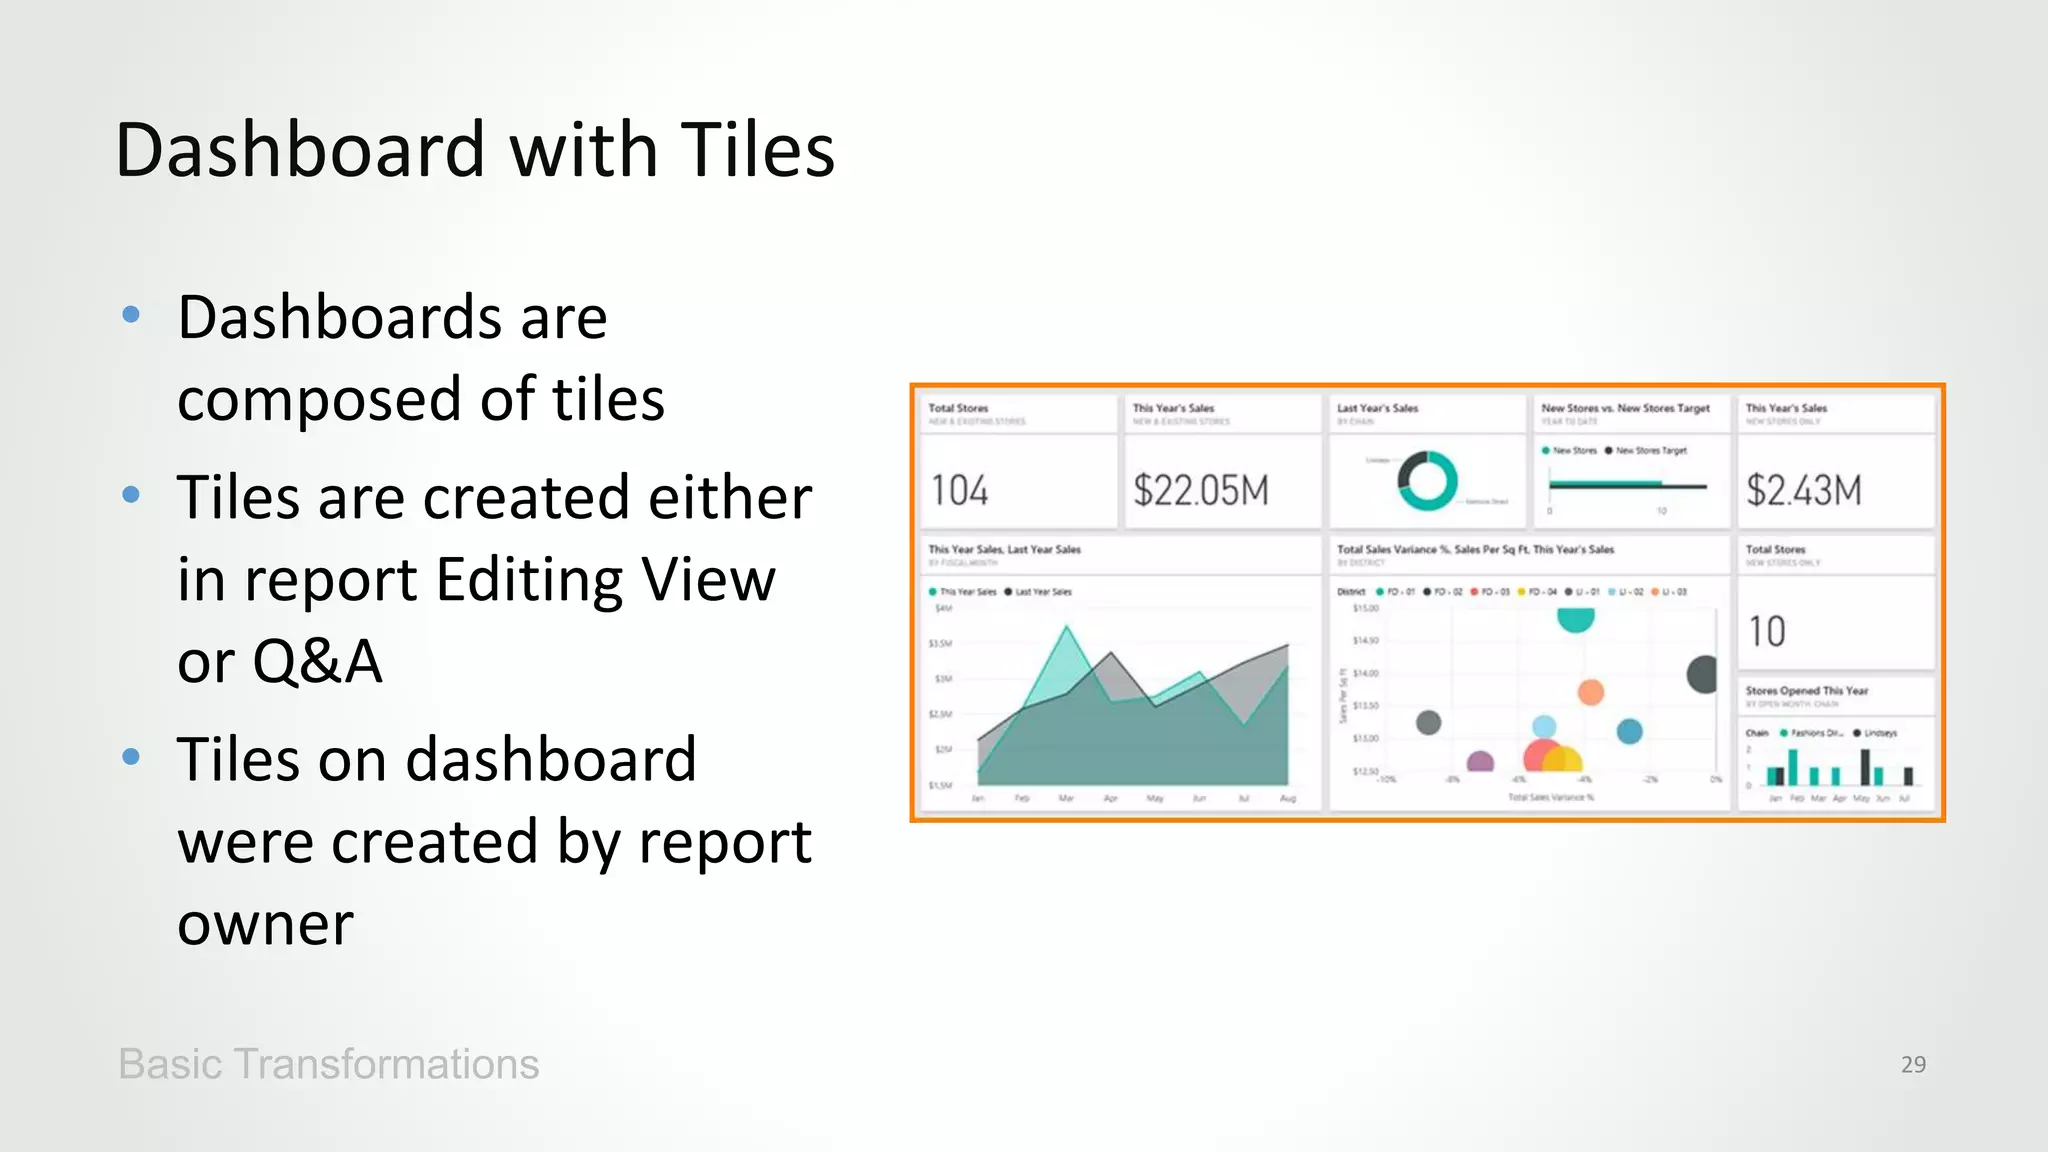
Cloud Computing
Welcome to Microsoft Azure for Power
BI Training!
Jeffrey Lipkowitz
Data Scientist
Jeffrey Lipkowitz
Data Scientist
• 10 Years High Tech Experience – IoT,
Internet, Business Intelligence, Machine
Learning
• Large Multinationals to Chicago Based
Startups.
• Graduate Degrees in Industrial
Management from Purdue University
And a masters in Analytics from
University of Chicago
Everyone
Analysttoenduser
ITtoenduser
2nd wave
Self-service BI
1stwave
Corporate BI
3rdwave
End user BI
The Evolution of BI
• Azure Overview
• Azure Power BI Overview
• Power BI Sign Up
• Power BI Data Refresh
• Power BI Data
Transformation
• Azure Power BI Desktop
Modeling
• Azure Power BI
Visualization
• History of Visualization
• Real World Digital Data
• Visualizations Best
Practices
• Power BI Services, Security
and Packs
• Direct Connectivity
• Developer API and
Connecting to Third Party
Data Sources
• Power BI Mobile
Course Agenda
SECTION 1
Azure Overview
What is the Cloud
What is the Cloud 7
8
Azure Active Directory Users
>500m
>250k
Active websites
Greater than
1,500,000
SQL Databases in Azure
>777
TRILLION
storage
transactions
per day
>80%Fortune 500
Use Azure
>13BILLION
authentications/wk
>1.5
TRILLION
messages/mo
processed by
Azure IoT
>1MILLION
Developers
registered with
Visual Studio
Online
Azure Services
Use prebuilt templates to build a personal Web site with technologies you know, or create a
commercial Web site that scales to serve millions of customers
Publish a Web Site
Publish a Web Site 12
Spin up an Azure HDInsight cluster with Apache Hadoop or Apache Spark
and process large data sets in parallel
Tame Big Data with Hadoop or Spark
Tame Big Data with Hadoop or Spark 13
Train a model with Azure Machine Learning and use that model to classify credit-card
transactions as fraudulent or not fraudulent
Perform Real-Time Fraud Detection
Perform Real-Time Fraud Detection 14
Feature Value
Name Bill Gates
Age 60
Gender Male
Amount $352.00
Purchased Software
Location Redmond, WA
Time 3:15 p.m.
… …
Combine Azure Event/IoT Hubs and Azure Stream Analytics
to analyze data streams from Internet-of-Things devices in real time
Process Data from IoT Devices
15
Use the Cognitive Services Face API to compare
faces, identify faces, search for similar faces, and more
Identify Faces in Photographs
16
Use the Cognitive Services Text Analytics API
to analyze sentiment in text files, Twitter feeds, and other sources
Perform Sentiment Analysis
Section Name here 17
Language DetectionTopic DetectionKey Phrase ExtractionSentiment Analysis
“Thanks to Text Analytics…we are able to incorporate guest sentiment into our
actionable guest feedback platform that delivers a comprehensive view of guest
satisfaction and server performance.”
— Al Pappa, Head of Business Intelligence, Ziosk
Deploy Dockerized apps to the Azure Container Service and run Docker
containers in the cloud, and use Docker Swarm or DC/OS for orchestration
Run Docker Containers
Run Docker Containers 18
Azure Portal
https://portal.azure.com
20
SECTION 2
Azure Power BI Overview
• https://azure.microsoft.com/en-
us/free/?b=17.01
• Good for $200 in Azure credits for one
month
• In the first hands-on lab, you will
activate your Azure Pass and associate it
with a Microsoft account
Azure Pass
Basic Transformations 22
*Gartner “Magic Quadrant for Business Intelligence and Analytics Platforms,” by Rita L. Sallam, Cindi Howson, Carlie J. Idoine, Thomas W. Oestreich, James Laurence Richardson, and Joao Tapadinhas February 16, 2017
This graphic was published by Gartner, Inc. as part of a larger research document and should be evaluated in the context of the entire document. The Gartner document is available upon request from Microsoft. Gartner does not endorse any vendor, product or service
depicted in its research publications, and does not advise technology users to select only those vendors with the highest ratings or other designation. Gartner research publications consist of the opinions of Gartner's research organization and should not be construed
as statements of fact. Gartner disclaims all warranties, expressed or implied, with respect to this research, including any warranties of merchantability or fitness for a particular purpose.
Any data, any way, anywhere
Power BI
Architecture 25
• Your Power BI service
workspace is made up of:
• 1navigation bar
• 2dashboard with tiles
• 3Q&A question box
• 4help and feedback buttons
• 5dashboard title
• 6Office 365 app launcher
• 7Power BI home buttons
• 8Additional dashboard actions
Basic Concepts
Basic Transformations 26
• 3 major Building Blocks
Power BI concepts
Basic Transformations 27
• Use the navbar to move between the
Power BI building blocks: dashboards,
reports, and datasets.c
Navigation Bar
Basic Transformations 28
• Dashboards are
composed of tiles
• Tiles are created either
in report Editing View
or Q&A
• Tiles on dashboard
were created by report
owner
Dashboard with Tiles
Basic Transformations 29
• Explore Data by asking questions
• Power BI will respond with the best answer
Q & A question Box
Basic Transformations 30
• 4.The icons in the top right corner are your resources for settings,
downloads, getting help, and providing feedback to the Power BI team. Select
the double arrow to open the dashboard in Full screen
• 5.It's not always easy to figure out which dashboard is active. The dashboard
title appears on the dashboard view page, on the Q&A page, in report Editing
View and report Reading View, and when you open a dataset.
• 6.Office 365 app launcher
• 7. Power BI Home
• 8. Options
Screen Layout
Basic Transformations 31

Microsoft Azure Power BI

  • 2.
    Cloud Computing Welcome toMicrosoft Azure for Power BI Training! Jeffrey Lipkowitz Data Scientist
  • 3.
    Jeffrey Lipkowitz Data Scientist •10 Years High Tech Experience – IoT, Internet, Business Intelligence, Machine Learning • Large Multinationals to Chicago Based Startups. • Graduate Degrees in Industrial Management from Purdue University And a masters in Analytics from University of Chicago
  • 4.
  • 5.
    • Azure Overview •Azure Power BI Overview • Power BI Sign Up • Power BI Data Refresh • Power BI Data Transformation • Azure Power BI Desktop Modeling • Azure Power BI Visualization • History of Visualization • Real World Digital Data • Visualizations Best Practices • Power BI Services, Security and Packs • Direct Connectivity • Developer API and Connecting to Third Party Data Sources • Power BI Mobile Course Agenda
  • 6.
  • 7.
    What is theCloud What is the Cloud 7
  • 8.
    8 Azure Active DirectoryUsers >500m >250k Active websites Greater than 1,500,000 SQL Databases in Azure >777 TRILLION storage transactions per day >80%Fortune 500 Use Azure >13BILLION authentications/wk >1.5 TRILLION messages/mo processed by Azure IoT >1MILLION Developers registered with Visual Studio Online
  • 10.
  • 12.
    Use prebuilt templatesto build a personal Web site with technologies you know, or create a commercial Web site that scales to serve millions of customers Publish a Web Site Publish a Web Site 12
  • 13.
    Spin up anAzure HDInsight cluster with Apache Hadoop or Apache Spark and process large data sets in parallel Tame Big Data with Hadoop or Spark Tame Big Data with Hadoop or Spark 13
  • 14.
    Train a modelwith Azure Machine Learning and use that model to classify credit-card transactions as fraudulent or not fraudulent Perform Real-Time Fraud Detection Perform Real-Time Fraud Detection 14 Feature Value Name Bill Gates Age 60 Gender Male Amount $352.00 Purchased Software Location Redmond, WA Time 3:15 p.m. … …
  • 15.
    Combine Azure Event/IoTHubs and Azure Stream Analytics to analyze data streams from Internet-of-Things devices in real time Process Data from IoT Devices 15
  • 16.
    Use the CognitiveServices Face API to compare faces, identify faces, search for similar faces, and more Identify Faces in Photographs 16
  • 17.
    Use the CognitiveServices Text Analytics API to analyze sentiment in text files, Twitter feeds, and other sources Perform Sentiment Analysis Section Name here 17 Language DetectionTopic DetectionKey Phrase ExtractionSentiment Analysis “Thanks to Text Analytics…we are able to incorporate guest sentiment into our actionable guest feedback platform that delivers a comprehensive view of guest satisfaction and server performance.” — Al Pappa, Head of Business Intelligence, Ziosk
  • 18.
    Deploy Dockerized appsto the Azure Container Service and run Docker containers in the cloud, and use Docker Swarm or DC/OS for orchestration Run Docker Containers Run Docker Containers 18
  • 19.
  • 20.
  • 21.
  • 22.
    • https://azure.microsoft.com/en- us/free/?b=17.01 • Goodfor $200 in Azure credits for one month • In the first hands-on lab, you will activate your Azure Pass and associate it with a Microsoft account Azure Pass Basic Transformations 22
  • 23.
    *Gartner “Magic Quadrantfor Business Intelligence and Analytics Platforms,” by Rita L. Sallam, Cindi Howson, Carlie J. Idoine, Thomas W. Oestreich, James Laurence Richardson, and Joao Tapadinhas February 16, 2017 This graphic was published by Gartner, Inc. as part of a larger research document and should be evaluated in the context of the entire document. The Gartner document is available upon request from Microsoft. Gartner does not endorse any vendor, product or service depicted in its research publications, and does not advise technology users to select only those vendors with the highest ratings or other designation. Gartner research publications consist of the opinions of Gartner's research organization and should not be construed as statements of fact. Gartner disclaims all warranties, expressed or implied, with respect to this research, including any warranties of merchantability or fitness for a particular purpose.
  • 24.
    Any data, anyway, anywhere Power BI
  • 25.
  • 26.
    • Your PowerBI service workspace is made up of: • 1navigation bar • 2dashboard with tiles • 3Q&A question box • 4help and feedback buttons • 5dashboard title • 6Office 365 app launcher • 7Power BI home buttons • 8Additional dashboard actions Basic Concepts Basic Transformations 26
  • 27.
    • 3 majorBuilding Blocks Power BI concepts Basic Transformations 27
  • 28.
    • Use thenavbar to move between the Power BI building blocks: dashboards, reports, and datasets.c Navigation Bar Basic Transformations 28
  • 29.
    • Dashboards are composedof tiles • Tiles are created either in report Editing View or Q&A • Tiles on dashboard were created by report owner Dashboard with Tiles Basic Transformations 29
  • 30.
    • Explore Databy asking questions • Power BI will respond with the best answer Q & A question Box Basic Transformations 30
  • 31.
    • 4.The iconsin the top right corner are your resources for settings, downloads, getting help, and providing feedback to the Power BI team. Select the double arrow to open the dashboard in Full screen • 5.It's not always easy to figure out which dashboard is active. The dashboard title appears on the dashboard view page, on the Q&A page, in report Editing View and report Reading View, and when you open a dataset. • 6.Office 365 app launcher • 7. Power BI Home • 8. Options Screen Layout Basic Transformations 31

Editor's Notes

  • #2 Cover Option2
  • #5 The way business intelligence is used in organization has changed significantly over the years. One way of understanding these changes is using the analogy of these three waves of BI: In the early days of BI, organizations would typically have a team or person handling all the requests for insights from the business. This model is not very scalable, and it can take a long time for the answer to get back to the user. By the time it does, a new question probably has already come up. To solve for this lack of scalability and gap between BI team and end users, the second approach to BI was to get BI capabilities in the hands of analysts, who understand the business and are able to support decisions with analytics. With Power BI, we want to enable everyone in the organization to analyze their data, ask the questions will help them run their business better, and act based on the insights they find.
  • #7 Section Beginning (Dark Color Option )
  • #8 This is the structure of bullet points in a lecture
  • #9 This is the structure of bullet points in a lecture
  • #10 This is the structure of bullet points in a lecture
  • #11 This is the structure of bullet points in a lecture
  • #13 This is the structure of bullet points in a lecture
  • #14 This is the structure of bullet points in a lecture
  • #15 This is the structure of bullet points in a lecture
  • #16 This is the structure of bullet points in a lecture
  • #17 This is the structure of bullet points in a lecture
  • #18 This is the structure of bullet points in a lecture
  • #19 This is the structure of bullet points in a lecture
  • #21 This is the structure of bullet points in a lecture
  • #22 Section Beginning (Dark Color Option )
  • #23 This is the structure of bullet points in a lecture
  • #24 Execution and Vision
  • #25 The explosion of data permeating all organizations is pivoting the way we interact with data and the way we seek to draw intelligence from this vast – and often untapped – potential. Consider that by 2020 there will be 50 zetabytes of data – this is 20,000 times the total amount of data that existed in the world less than three decades before. And for most organizations, this data often resides on-premise, in the Microsoft cloud or another – such as Office 365, Dynamics 365, Salesforce, Marketo and others. Or it may reside in both the cloud and on-premise [i.e. hybrid]…making it challenging to access and draw actionable insights from the data.   With Power BI there’s no need to move your data; we’ll meet you where you are…as a business intelligence and analytics SaaS service, Power BI equips business users to directly connect with and gain insights from their business data. Harness data from Excel spreadsheets, on-premises data sources, big data, streaming data, and cloud services – it doesn’t matter what type of data you want or where it lives, Power BI allows you to connect to hundreds of data sources. We’ve developed content packs that deliver a curated experience with pre-built dashboards for popular SaaS services to get you up and running quickly. And Power BI delivers unmatched, unique ways for users to experience their data with speed and agility: Live dashboards that maintain a real time pulse on the business and provide critical insights… Custom visuals that bring data to life and surface intelligence hidden in the sea of data… Natural language query that enables uses to simply ask questions of their data in an intuitive way… Whether in the office or on-the-go, Power BI also provides anywhere access to insights with dashboards accessible via the desktop, web or across mobile devices.   Perhaps most importantly, with Power BI you can leverage world-class data analytics capabilities from historical data sets, but it also delivers the ability to see your data as it’s happening right now…no longer looking in the rear-view mirror. The notion of transitioning from historical intelligence, to real time insights and ultimately to enable action is propelling modern BI and accelerating the evolution of Power BI… This means equipping users to take action where and when needed… For example, Power BI seamlessly integrates with Microsoft business apps like Dynamics 365 and Office 365, equipping users with insight directly within the Microsoft apps they use every day. And with Power BI Embedded, organizations also have the flexibility to infuse third party apps with the same intelligence… Lastly, integrating intelligence at the point of action leads to automation within systems that trigger commands based on preset thresholds…further operationalizing business insight throughout an organization.  
  • #26 This is the structure of bullet points in a lecture
  • #27 This is the structure of bullet points in a lecture
  • #28 This is the structure of bullet points in a lecture
  • #29 This is the structure of bullet points in a lecture
  • #30 This is the structure of bullet points in a lecture
  • #31 This is the structure of bullet points in a lecture
  • #32 This is the structure of bullet points in a lecture