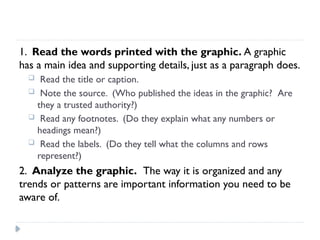
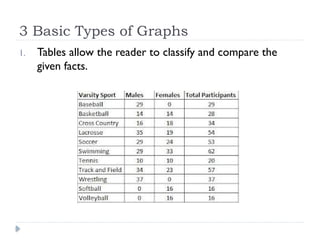
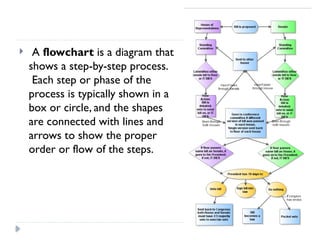
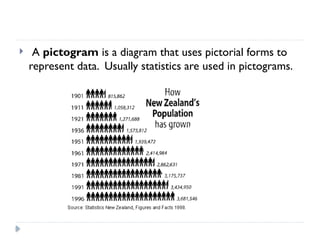
Interpreting Charts and Graphs
RDNG 0361
Reading Charts and Graphs
 Reading comprehension involves more than just reading
words. Authors also use visual images such as
photographs, cartoons, and graphics to relay ideas.
 Graphics give a great deal of information in a smaller
space than it would take to write the ideas in the form of
words. The following suggestions will help you
understand the general format of a graphic.
1. Read the words printed with the graphic. A graphic
has a main idea and supporting details, just as a paragraph does.
 Read the title or caption.
 Note the source. (Who published the ideas in the graphic? Are
they a trusted authority?)
 Read any footnotes. (Do they explain what any numbers or
headings mean?)
 Read the labels. (Do they tell what the columns and rows
represent?)
2. Analyze the graphic. The way it is organized and any
trends or patterns are important information you need to be
aware of.
3 Basic Types of Graphs
1. Tables allow the reader to classify and compare the
given facts.
3 Basic Types of Graphs
2. Graphs show the relationship between two or more
sets of ideas. The most common types of graphs you
will come across in your reading are line graphs, bar
graphs, and pie charts.
Most Common Types of Graphs
 Line graphs plot two or more sets of facts on vertical and
horizontal axes.
 A bar graph presents a set of bars. Each bar stands for
a specific quantity, amount or measurement. Seeing the
bars together allows us to compare the quantity
represented by each bar.
 A pie chart shows a whole group as a circle and divides
the circle into smaller units that look like slices of a pie.
Each smaller slice is a part, percentage, or fraction of the
whole. Pie graphs are used to show proportions and the
importance of each smaller unit in relation to the whole.
3 Basic Types of Graphs
3. Diagrams are graphics that explain in detail the
relationships between the parts of an idea to the whole
idea. Diagrams include flowcharts, pictograms, and
drawings.
 A flowchart is a diagram that
shows a step-by-step process.
Each step or phase of the
process is typically shown in a
box or circle, and the shapes
are connected with lines and
arrows to show the proper
order or flow of the steps.
 A pictogram is a diagram that uses pictorial forms to
represent data. Usually statistics are used in pictograms.
 A drawing is an artist's illustration of a process or idea.
The drawing shows the relationships among all the details
in the picture. Often these drawings are dependent on the
accompanying text, and an effective reader must move back
and forth between the drawing and text for full
understanding.
Importance of Charts and Graphs
 Textbook space is at a premium. An author would
not include a chart or graphic if it wasn't important.
So, if you want to be a strong reader and increase
your comprehension, do not skip over the graphic,
charts, and tables. They contain important
information, and you need to read them carefully and
ask yourself, "How does the information shown in the
chart, graphic, or table support the material I am
reading?"

Interpreting charts and graphs, diagrams,

  • 1.
    Interpreting Charts andGraphs RDNG 0361
  • 2.
    Reading Charts andGraphs  Reading comprehension involves more than just reading words. Authors also use visual images such as photographs, cartoons, and graphics to relay ideas.  Graphics give a great deal of information in a smaller space than it would take to write the ideas in the form of words. The following suggestions will help you understand the general format of a graphic.
  • 3.
    1. Read thewords printed with the graphic. A graphic has a main idea and supporting details, just as a paragraph does.  Read the title or caption.  Note the source. (Who published the ideas in the graphic? Are they a trusted authority?)  Read any footnotes. (Do they explain what any numbers or headings mean?)  Read the labels. (Do they tell what the columns and rows represent?) 2. Analyze the graphic. The way it is organized and any trends or patterns are important information you need to be aware of.
  • 4.
    3 Basic Typesof Graphs 1. Tables allow the reader to classify and compare the given facts.
  • 5.
    3 Basic Typesof Graphs 2. Graphs show the relationship between two or more sets of ideas. The most common types of graphs you will come across in your reading are line graphs, bar graphs, and pie charts.
  • 6.
    Most Common Typesof Graphs  Line graphs plot two or more sets of facts on vertical and horizontal axes.
  • 7.
     A bargraph presents a set of bars. Each bar stands for a specific quantity, amount or measurement. Seeing the bars together allows us to compare the quantity represented by each bar.
  • 8.
     A piechart shows a whole group as a circle and divides the circle into smaller units that look like slices of a pie. Each smaller slice is a part, percentage, or fraction of the whole. Pie graphs are used to show proportions and the importance of each smaller unit in relation to the whole.
  • 9.
    3 Basic Typesof Graphs 3. Diagrams are graphics that explain in detail the relationships between the parts of an idea to the whole idea. Diagrams include flowcharts, pictograms, and drawings.
  • 10.
     A flowchartis a diagram that shows a step-by-step process. Each step or phase of the process is typically shown in a box or circle, and the shapes are connected with lines and arrows to show the proper order or flow of the steps.
  • 11.
     A pictogramis a diagram that uses pictorial forms to represent data. Usually statistics are used in pictograms.
  • 12.
     A drawingis an artist's illustration of a process or idea. The drawing shows the relationships among all the details in the picture. Often these drawings are dependent on the accompanying text, and an effective reader must move back and forth between the drawing and text for full understanding.
  • 13.
    Importance of Chartsand Graphs  Textbook space is at a premium. An author would not include a chart or graphic if it wasn't important. So, if you want to be a strong reader and increase your comprehension, do not skip over the graphic, charts, and tables. They contain important information, and you need to read them carefully and ask yourself, "How does the information shown in the chart, graphic, or table support the material I am reading?"