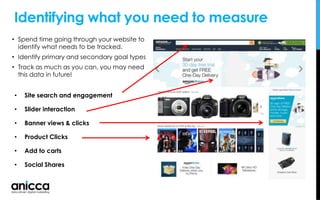
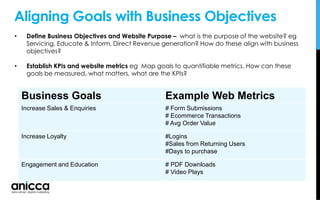
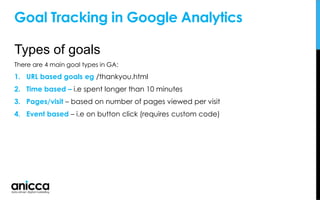
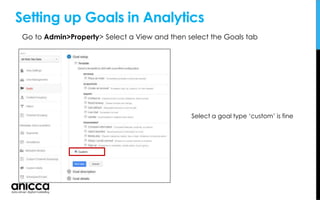
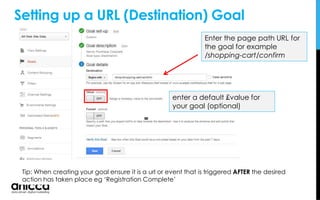
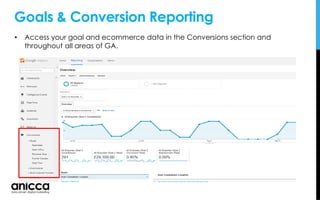
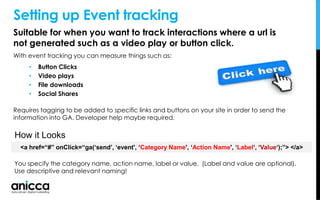
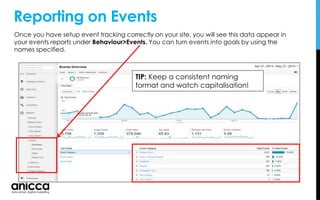
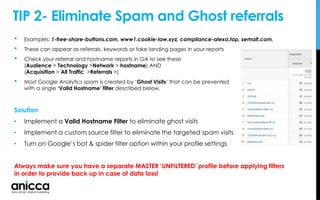
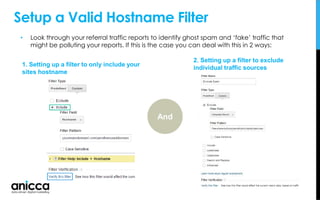
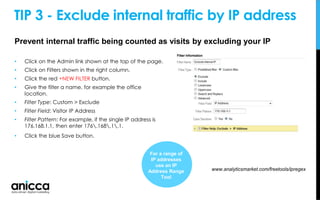
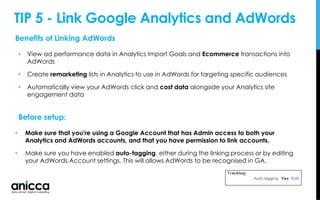
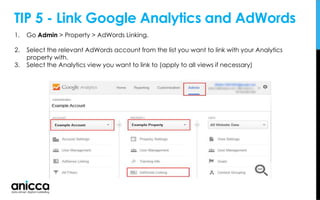
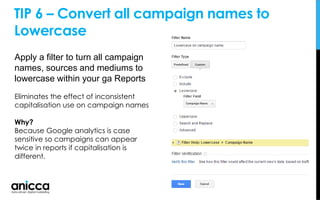
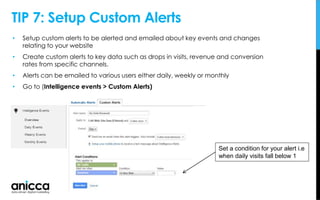
You’ll want to track that!
Top Tips for Google Analytics
Presented by Ed Truman
Head of Analytics
Anicca Digital
/edtruman
Tracking Basics:
Are You Tracking what you need?
1. Goals
2. Events
3. Ecommerce Revenue
You should be using at least one of these reporting metrics:
Setting up Goals For Your Website
Why?
• Because Google Analytics won’t tell you how your business is doing without
them!
• It makes Google Analytics much more relevant to your business
• Allows you to find out how your website is helping your business
• Allows you to measure the effectiveness of your marketing channels
• Attribute credit and ROI to different channels
• Better understand user behaviour and which audiences convert
Bottom Line: Whatever your website - you
need goals!
Goal Tracking in Google Analytics
Goal Examples:
• Leads
• Trial signups
• Account creations
• Newsletter signups
• White paper downloads
• Ebook downloads
• Add to cart
• Blog Viewed
Identifying what you need to measure
• Site search and engagement
• Slider interaction
• Banner views & clicks
• Product Clicks
• Add to carts
• Social Shares
• Spend time going through your website to
identify what needs to be tracked.
• Identify primary and secondary goal types
• Track as much as you can, you may need
this data in future!
Aligning Goals with Business Objectives
• Define Business Objectives and Website Purpose – what is the purpose of the website? eg
Servicing, Educate & Inform, Direct Revenue generation? How do these align with business
objectives?
• Establish KPIs and website metrics eg Map goals to quantifiable metrics. How can these
goals be measured, what matters, what are the KPIs?
Business Goals Example Web Metrics
Increase Sales & Enquiries # Form Submissions
# Ecommerce Transactions
# Avg Order Value
Increase Loyalty #Logins
#Sales from Returning Users
#Days to purchase
Engagement and Education # PDF Downloads
# Video Plays
Goal Tracking in Google Analytics
Types of goals
There are 4 main goal types in GA:
1. URL based goals eg /thankyou.html
2. Time based – i.e spent longer than 10 minutes
3. Pages/visit – based on number of pages viewed per visit
4. Event based – i.e on button click (requires custom code)
Setting up Goals in Analytics
Select a goal type ‘custom’ is fine
Go to Admin>Property> Select a View and then select the Goals tab
Setting up a URL (Destination) Goal
• Give your goal a name and the goal type ‘Destination’
Tip: When creating your goal ensure it is a url or event that is triggered AFTER the desired
action has taken place eg ‘Registration Complete’
Enter the page path URL for
the goal for example
/shopping-cart/confirm
enter a default £value for
your goal (optional)
Setting up a URL (Destination) Goal
Goals & Conversion Reporting
• Access your goal and ecommerce data in the Conversions section and
throughout all areas of GA.
Suitable for when you want to track interactions where a url is
not generated such as a video play or button click.
With event tracking you can measure things such as:
• Button Clicks
• Video plays
• File downloads
• Social Shares
Requires tagging to be added to specific links and buttons on your site in order to send the
information into GA. Developer help maybe required.
Setting up Event tracking
You specify the category name, action name, label or value. (Label and value are optional).
Use descriptive and relevant naming!
<a href=“#” onClick=“ga(‘send’, ‘event', ‘Category Name', ‘Action Name', ‘Label‘, ‘Value‘);”> </a>
How it Looks
Reporting on Events
Once you have setup event tracking correctly on your site, you will see this data appear in
your events reports under Behaviour>Events. You can turn events into goals by using the
names specified.
TIP: Keep a consistent naming
format and watch capitalisation!
Creating an Event based Goal
Once you have setup your on-
page events, you can configure
event based goals based on the
event details you setup.
Enter Event Details (must
match or contain the event
details setup on page)
Creating goals from events
allows greater usage and
reporting flexibility and is highly
recommended.
UTM Tracking For Custom Campaigns
IMPORTANT! Add UTM tags to all campaign links
from social media ads, bing ads, email
campaigns, and documents to accurately see
where your traffic is coming from in GA.
Include the following:
Utm_Source = eg Facebook,
Utm_Medium = eg cpc (aka paid)
Utm_Campaign Name = Summer 20% Offer
Failure to not include UTM tracking will result in
campaign information not being passed and
source data not accurately being identified in
GA.
Use our free utm builder
tool!
http://anicca.co.uk/technical/tools-
and-technology/url-builder/
• Setup Ecommerce tracking to track Transactions and Revenue through your website.
• Requires Ecommerce tracking code on cart pages!
• Essential for reporting Revenue and ROI on campaigns!
Report on Revenue (Ecommerce Tracking)
Activate Ecommerce reporting within
your account Ecommerce Settings
Ecommerce Tracking Code – How it Looks
Setup Google Analytics to collect transaction data using special JavaScript tags placed on your thank
you page or checkout receipt page. This is how the code should look in analytics.js markup.
Item Data
https://developers.google.com/analytics/devguides/collection/analyticsjs/enhanced-ecommerce#transaction
Transaction Data
Loads the ecommerce plugin
Sends Transaction to Google
Regular GA Code
Going one step further with Enhanced
Ecommerce
Setting up Enhanced Ecommerce allows you to capture more data beyond that of basic transaction
data and allows you to gain a much deeper insight into shopper behaviour and product performance on
your website.
Use Enhanced Ecommerce to measure :
• Purchases and the complete checkout process
• Product Clicks and Views
• Viewing product details.
• Impressions and clicks of internal promotions.
• Adds and removals from shopping cart
• Checkout progression
• Purchases and refunds.
• Coupon code redemption
Requires Additional tracking
code setup
Using GA to Identify Barriers to
Conversion on Your Website
Performance by Device
• See what % of your visitors come from Mobile or Tablet.
• Compare engagement and conversion rates across different devices
• Are you providing a good mobile experience?
• Access the mobile overview report (Audience > Mobile)
Note: If you have a separate mobile site you may want to setup a separate profile to report on this
data
44% of visits from
mobile
Lower conversion rates
from mobile (Typical)
Performance by Model & Screen Size
• Compare web performance on different screen sizes and mobile types
• View by device brand, operating system, screen resolution, Service provider
• Review visit durations and conversion rates to identify possible issues!
32% mobile traffic from iphone
1366x768 Most common screen size
Conversion Rate Split by Browser & Device
This helps you identify any
technical or UX issues for specific
browser and/or devices. If your
website doesn’t work properly with
the device/browser a visitor uses,
they won’t buy! Any issues
identified here are low-hanging
fruits.
Segments applied
Secondary dimension
applied
Bonus: Conversion Rate by Browser Type
• Use motion charts to visually help segment data much better than the standard charting in
Google Analytics.
• The following example is exploring e-commerce conversion rate over time segmented by
browser type.
Go to > Audiences > technology> browser & os
• Right away, I noticed that Firefox took a big dip in October 2013. By applying an advanced
filter this to this report, I was very able to quickly isolate the conversion rate in Firefox.
Identify High Bounce Landing Pages
• Use the landing pages report to see which pages visitors arrive on.
• Are people arriving on the pages you expect them to arrive on?
• Do users who land on your page end up converting?
• Check for high bounce rate and poor converting pages
Go to > Behaviour > Site Content>Landing Pages
Bonus Tip: You can use comparison view to view pages that
have above average bounce rates for your site.
Identify High Bounce Landing Pages
Organic Landing Pages – with segment
• By applying a custom segment we can see data just for that segment i.e ‘Organic’
traffic, Mobile traffic etc.
• This report will show you which pages visitors from search engines land on
• Note: Google offers limited keyword information about the search terms used by
visitors to find your site.
apply An organic segment to
see top organic landing
pages
Poor conversion =
opportunity for
improvement
Is Page Speed killing Conversion?
• Identify pages with slow page load times (above 3 seconds) that may be affecting
conversion rates and SEO
• View site speed for different devices, browsers, and geographic areas to find where
improvement opportunities exist
• TIP: Use Avg. Document Content Loaded Time to give you an accurate reflection of how
long it takes before the actual content loads to the user
Faster pages = higher conversion rates! =
GREATER SUCCESS
Site Search Reporting
• See the most searched for products that users type in on your website
• See which pages users were on when they started their search and the pages they went on to.
• Identify the searches and pages where people exit (exit page)
• See the queries with the highest conversion rates
• Can be useful for identify possible issues with navigation or product or content availability.
Go to Behaviour > Site Search (Requires Setup)
You can setup site search tracking to track what people search
for whilst on your site.
• Go Admin the tab
• Click the web property that contains the view for which you
want to set up Site Search.
• Use the View menu to select the view you want.
• Click the View Settings sub-tab.
• Under Site Search Settings, select Do Track Site Search.
• In the Query Parameter field, enter the word or words that
designate an internal query parameter, such as "term, search,
query, s, q".
• Sometimes the word is just a letter, such as "s" or "q". Enter up to
five parameters, separated by commas.
For information about identifying query parameters,
see Identifying Search and Query Parameters for Your Site.
Setup Site Search Tracking
Measure Checkout Abandonment
Use Goal Funnels to see how visitors progress through your form or
checkout process!
Understand where
abandonment occurs and
what your cart to conversion
rate is
Access Report from
(Conversions >Goals>Funnel
Visualization)
Works for any sequential step
Process:
• Checkout Steps
• Form Completion Steps
• Website Category
progression
How to Setup A Goal Goal Funnel
If you have a defined step by step
journey users take, you can setup goal
funnels to see how visitors travelled
through a funnel towards a Goal.
STEPS:
1. Create a destination Goal
2. Toggle the funnel switch to
on
3. Enter the page steps prior to
the main goal url
Note: Funnels are only possible with URL
based goals!
1
3
2
Abandonment Using Behaviour Flow Report
• Use the behaviour flow report to see the path users take from your landing pages in
order to identify exit and abandon points.
• Are users taking the paths you want them to take?
Tip: Best used with segment applied
Go to > Behaviour > Site
Content>Landing Pages
Tip: click to isolate specific paths
Customising Your Reports
• Allows you to gather your content into common themes to create a more
meaningful analysis of your data.
• Group by page type, web section or language type and more!
• Requires setup!
Use Content Grouping for Section Analysis
The Apparel section is our top
entrance section to the site!
Content Grouping Setup
Go Admin > View > Content grouping within Google Analytics
Group pages using rule definitions i.e ‘url contains…’
Content Grouping For Section Navigation
Great for seeing see how
users navigate from section to
section
Content Grouping For Visitor Flow
• Use content grouping within your Behaviour Flow reports (Behaviour > Behaviour Flow)
• Apply different segments to see the most common paths for different user types
Segment for non converters applied
Sales Funnel Report (Custom Report)
• Setup a custom report based on your conversion funnel aligned against dimensions such as
device, browser, traffic source
• Incorporate custom goal data side by side
• Helps you quickly identify what stage of the funnel users may be having issues
BRING IN YOUR GOAL DATA
• Go to >Customization tab to
get started
• Setup a custom report that
brings in key goal metrics split
by different dimensions
• Technical dimensions such as
browser, screen resolution,
device type are good metrics
to use
Build A Custom Sales Funnel Report
Build a Day of Week Report (custom)
• Build and Configure your own reports and views
• Schedule Reports to be emailed to you
• More comprehensive than dashboards
• Go to >Customization tab to get started
• Select Day of Week Name as your primary dimension
Review conversion rates &
volumes for each day!
Apply segments to your reports
Get User Demographic
and interest insights
Audience> Demographics
Audience>Interests
Enable Interest and Demographic Reports
STEP 2: Select the Admin tab and Navigate to the
account and property where you want to use
Demographic and Interests data.
In the PROPERTY column, click Property Settings.
• Under Advertising Features, set Enable
Demographics and Interests Reports to ON.
STEP 1: Select the Admin tab and navigate to
the account and property for which you want to
enable these features.
In the Property column, click Tracking Info, then
click Data Collection.
Blog Reporting
Question: How many users visited my blog last month?
This is actually trickier than it should be, here’s one way:
Apply a custom segment based on your pages that include the page path of your blog eg
/blog
Bingo! This tells me how many users accessed my blog during their
visit at somepoint! Note: This is different to Pageviews.
44% of visits
accessed my blog
• Create a user segment based on users who landed on a blog page.
• With the segment applied. Go to the conversions report to see how many
conversions stemmed from users who entered on blog pages at somepoint.
Does my blog convert visitors?
Advanced Page Tracking For Blog
• Page Title,
• Page Topic,
• Page Author
• Blog Read rate % (Reads/ pageviews )
• Social Share rate % (Shares / pageviews)
• Comment Rate % (Comments / pageviews)
• Leads and conversions generated
Key Metrics
Track more than just page views(sessions). Get
detailed page reporting using custom metrics and
custom dimensions.
Requires
Technical
Setup!
Note: A single page View proceeded by
an exit will result in a bounced visit.
Advanced Blog Insights - Reporting
Example of pulling together custom metrics into a custom report
Schedule Custom Reports
• Once you have created custom reports you can choose to have it emailed to you
at a time of your choosing
• Click the email tab on your report to set this up
Build & Schedule Custom Dashboards
• Configure your own custom data within a single dashboard. Go to > Dashboards section and go to
+New Dashboard
• Add up to 12 widgets including graphs and data
• Allows you to export and setup regular scheduled email reports
Multi-Channel Funnels
Understanding the paths to conversion
Understanding How Analytics Attributes
Credit
• Google Analytics by default uses a ‘Last Non-Direct Click’ when attributing conversion value in non-Multi-
Channel Funnels reports.
• The Last Non-Direct Click model ignores direct traffic and attributes 100% of the conversion value to the
last channel that the customer clicked through from before buying or converting.
100%
AdWords
Visit 1
Email
Visit 2
Organic
Visit 3
Direct
Visit 4
Purchase!
Why Multi-Channel Funnel Reporting?
• Because different channels work together to drive conversions on your website
• Because you want to know the channels that assist in conversions
• Use the Multi-Channel reports to see the role of channels that played a role in driving conversions
on your website
• Go to Conversions > Multi-channel funnels
This shows the overlap between
channels that work together to drive
conversions!
Assisted Conversions
If the assist ratio is above 1 the
channel assists more than closes
Assisted conversions give you a fuller picture and enable you to see what’s actually driving
sales and how users find you. Here you can see how different marketing channels work
together to create sales and conversions.
Go to Conversion > Multichannel Funnels > Assisted Conversion
Analyse REAL Channel Contribution
• Look beyond last click and assign credit and revenue to first click!
• Because Google uses a last (non-direct) click attribution model as standard!
• Use the Model Comparison Tool report to assign credit on a First Click basis!
• Go to Conversions > Attribution > Model Comparison Tool
50% Difference
in Conversion
Value for Paid!
GA’s default attribution model
Setup & Configuration Top Tips
When setting up views in Google Analytics it is
good practice to setup at least 2 views:
1. A Master ‘Filtered’ View (with all your filters applied)
2. A RAW ‘Unfiltered’ Data Profile (No filters applied)
3. A Test Profile – For testing before putting live
• This will provide a back up to your reports in case a
mistake is made with a particular filter and data loss
occurs, or if you want to see the effect filters are having.
• When trying out new filters and settings it is often useful to
experiment using a third ‘test view’ in the first instance.
TIP 1 - Setup Multiple Profiles (Views)
TIP 2- Eliminate Spam and Ghost referrals
• Examples: 1-free-share-buttons.com, www1.cookie-law.xyz, compliance-alexa.top, semalt.com,
• These can appear as referrals, keywords or fake landing pages in your reports
• Check your referral and hostname reports in GA to see these
(Audience > Technology >Network > hostname) AND
(Acquisition > All Traffic >Referrals >)
• Most Google Analytics spam is created by ‘Ghost Visits‘ that can be prevented
with a single ‘Valid Hostname’ filter described below.
Solution
• Implement a Valid Hostname Filter to eliminate ghost visits
• Implement a custom source filter to eliminate the targeted spam visits
• Turn on Google’s bot & spider filter option within your profile settings
Always make sure you have a separate MASTER ‘UNFILTERED’ profile before applying filters
in order to provide back up in case of data loss!
Setup a Valid Hostname Filter
• Look through your referral traffic reports to identify ghost spam and ‘fake’ traffic that
might be polluting your reports. If this is the case you can deal with this in 2 ways:
1. Setting up a filter to only include your
sites hostname
2. Setting up a filter to exclude
individual traffic sources
And
TIP 3 - Exclude internal traffic by IP address
• Click on the Admin link shown at the top of the page.
• Click on Filters shown in the right column.
• Click the red +NEW FILTER button.
• Give the filter a name, for example the office
location.
• Filter Type: Custom > Exclude
• Filter Field: Visitor IP Address
• Filter Pattern: For example, if the single IP address is
176.168.1.1, then enter 176.168.1.1.
• Click the blue Save button.
www.analyticsmarket.com/freetools/ipregex
For a range of
IP addresses
use an IP
Address Range
Tool
Prevent internal traffic being counted as visits by excluding your IP
Prevent specific domains such as third-party gateways from being
recognized as referral traffic sources AND STEALING CREDIT FOR
CONVERSIONS in GA
• Referral exclusions prevent customers from being counted in new session and as a referral when they return
to your order confirmation page after checking out on the third-party site.
• Manually specify domains you don’t want to be classified as referral traffic such as sagepay.com as well as
your own domain!
• (Go to Admin > Properties > Referral Exclusions)
• Note – This does not block traffic it merely strips out the referral source. Use a separate filter if you want to
exclude these visits entering your reports entirely (not recommended).
TIP 4 - Use Referral Exclusions Lists
Benefits of Linking AdWords
• View ad performance data in Analytics Import Goals and Ecommerce transactions into
AdWords
• Create remarketing lists in Analytics to use in AdWords for targeting specific audiences
• Automatically view your AdWords click and cost data alongside your Analytics site
engagement data
Before setup:
• Make sure that you're using a Google Account that has Admin access to both your
Analytics and AdWords accounts, and that you have permission to link accounts.
• Make sure you have enabled auto-tagging, either during the linking process or by editing
your AdWords Account settings. This will allows AdWords to be recognised in GA.
TIP 5 - Link Google Analytics and AdWords
1. Go Admin > Property > AdWords Linking.
2. Select the relevant AdWords account from the list you want to link with your Analytics
property with.
3. Select the Analytics view you want to link to (apply to all views if necessary)
TIP 6 – Convert all campaign names to
Lowercase
Apply a filter to turn all campaign
names, sources and mediums to
lowercase within your ga Reports
Eliminates the effect of inconsistent
capitalisation use on campaign names
Why?
Because Google analytics is case
sensitive so campaigns can appear
twice in reports if capitalisation is
different.
TIP 7: Setup Custom Alerts
• Setup custom alerts to be alerted and emailed about key events and changes
relating to your website
• Create custom alerts to key data such as drops in visits, revenue and conversion
rates from specific channels.
• Alerts can be emailed to various users either daily, weekly or monthly
• Go to (Intelligence events > Custom Alerts)
Set a condition for your alert i.e
when daily visits fall below 1
Thankyou
Ed Truman
ed@anicca.co.uk
/edtruman

Top Tips For Google Analytics - Oct 2016

  • 1.
    You’ll want totrack that! Top Tips for Google Analytics Presented by Ed Truman Head of Analytics Anicca Digital /edtruman
  • 2.
    Tracking Basics: Are YouTracking what you need?
  • 3.
    1. Goals 2. Events 3.Ecommerce Revenue You should be using at least one of these reporting metrics:
  • 4.
    Setting up GoalsFor Your Website Why? • Because Google Analytics won’t tell you how your business is doing without them! • It makes Google Analytics much more relevant to your business • Allows you to find out how your website is helping your business • Allows you to measure the effectiveness of your marketing channels • Attribute credit and ROI to different channels • Better understand user behaviour and which audiences convert Bottom Line: Whatever your website - you need goals!
  • 5.
    Goal Tracking inGoogle Analytics Goal Examples: • Leads • Trial signups • Account creations • Newsletter signups • White paper downloads • Ebook downloads • Add to cart • Blog Viewed
  • 6.
    Identifying what youneed to measure • Site search and engagement • Slider interaction • Banner views & clicks • Product Clicks • Add to carts • Social Shares • Spend time going through your website to identify what needs to be tracked. • Identify primary and secondary goal types • Track as much as you can, you may need this data in future!
  • 7.
    Aligning Goals withBusiness Objectives • Define Business Objectives and Website Purpose – what is the purpose of the website? eg Servicing, Educate & Inform, Direct Revenue generation? How do these align with business objectives? • Establish KPIs and website metrics eg Map goals to quantifiable metrics. How can these goals be measured, what matters, what are the KPIs? Business Goals Example Web Metrics Increase Sales & Enquiries # Form Submissions # Ecommerce Transactions # Avg Order Value Increase Loyalty #Logins #Sales from Returning Users #Days to purchase Engagement and Education # PDF Downloads # Video Plays
  • 8.
    Goal Tracking inGoogle Analytics Types of goals There are 4 main goal types in GA: 1. URL based goals eg /thankyou.html 2. Time based – i.e spent longer than 10 minutes 3. Pages/visit – based on number of pages viewed per visit 4. Event based – i.e on button click (requires custom code)
  • 9.
    Setting up Goalsin Analytics Select a goal type ‘custom’ is fine Go to Admin>Property> Select a View and then select the Goals tab
  • 10.
    Setting up aURL (Destination) Goal • Give your goal a name and the goal type ‘Destination’
  • 11.
    Tip: When creatingyour goal ensure it is a url or event that is triggered AFTER the desired action has taken place eg ‘Registration Complete’ Enter the page path URL for the goal for example /shopping-cart/confirm enter a default £value for your goal (optional) Setting up a URL (Destination) Goal
  • 12.
    Goals & ConversionReporting • Access your goal and ecommerce data in the Conversions section and throughout all areas of GA.
  • 13.
    Suitable for whenyou want to track interactions where a url is not generated such as a video play or button click. With event tracking you can measure things such as: • Button Clicks • Video plays • File downloads • Social Shares Requires tagging to be added to specific links and buttons on your site in order to send the information into GA. Developer help maybe required. Setting up Event tracking You specify the category name, action name, label or value. (Label and value are optional). Use descriptive and relevant naming! <a href=“#” onClick=“ga(‘send’, ‘event', ‘Category Name', ‘Action Name', ‘Label‘, ‘Value‘);”> </a> How it Looks
  • 14.
    Reporting on Events Onceyou have setup event tracking correctly on your site, you will see this data appear in your events reports under Behaviour>Events. You can turn events into goals by using the names specified. TIP: Keep a consistent naming format and watch capitalisation!
  • 15.
    Creating an Eventbased Goal Once you have setup your on- page events, you can configure event based goals based on the event details you setup. Enter Event Details (must match or contain the event details setup on page) Creating goals from events allows greater usage and reporting flexibility and is highly recommended.
  • 16.
    UTM Tracking ForCustom Campaigns IMPORTANT! Add UTM tags to all campaign links from social media ads, bing ads, email campaigns, and documents to accurately see where your traffic is coming from in GA. Include the following: Utm_Source = eg Facebook, Utm_Medium = eg cpc (aka paid) Utm_Campaign Name = Summer 20% Offer Failure to not include UTM tracking will result in campaign information not being passed and source data not accurately being identified in GA. Use our free utm builder tool! http://anicca.co.uk/technical/tools- and-technology/url-builder/
  • 17.
    • Setup Ecommercetracking to track Transactions and Revenue through your website. • Requires Ecommerce tracking code on cart pages! • Essential for reporting Revenue and ROI on campaigns! Report on Revenue (Ecommerce Tracking) Activate Ecommerce reporting within your account Ecommerce Settings
  • 18.
    Ecommerce Tracking Code– How it Looks Setup Google Analytics to collect transaction data using special JavaScript tags placed on your thank you page or checkout receipt page. This is how the code should look in analytics.js markup. Item Data https://developers.google.com/analytics/devguides/collection/analyticsjs/enhanced-ecommerce#transaction Transaction Data Loads the ecommerce plugin Sends Transaction to Google Regular GA Code
  • 19.
    Going one stepfurther with Enhanced Ecommerce Setting up Enhanced Ecommerce allows you to capture more data beyond that of basic transaction data and allows you to gain a much deeper insight into shopper behaviour and product performance on your website. Use Enhanced Ecommerce to measure : • Purchases and the complete checkout process • Product Clicks and Views • Viewing product details. • Impressions and clicks of internal promotions. • Adds and removals from shopping cart • Checkout progression • Purchases and refunds. • Coupon code redemption Requires Additional tracking code setup
  • 20.
    Using GA toIdentify Barriers to Conversion on Your Website
  • 21.
    Performance by Device •See what % of your visitors come from Mobile or Tablet. • Compare engagement and conversion rates across different devices • Are you providing a good mobile experience? • Access the mobile overview report (Audience > Mobile) Note: If you have a separate mobile site you may want to setup a separate profile to report on this data 44% of visits from mobile Lower conversion rates from mobile (Typical)
  • 22.
    Performance by Model& Screen Size • Compare web performance on different screen sizes and mobile types • View by device brand, operating system, screen resolution, Service provider • Review visit durations and conversion rates to identify possible issues! 32% mobile traffic from iphone 1366x768 Most common screen size
  • 23.
    Conversion Rate Splitby Browser & Device This helps you identify any technical or UX issues for specific browser and/or devices. If your website doesn’t work properly with the device/browser a visitor uses, they won’t buy! Any issues identified here are low-hanging fruits. Segments applied Secondary dimension applied
  • 24.
    Bonus: Conversion Rateby Browser Type • Use motion charts to visually help segment data much better than the standard charting in Google Analytics. • The following example is exploring e-commerce conversion rate over time segmented by browser type. Go to > Audiences > technology> browser & os • Right away, I noticed that Firefox took a big dip in October 2013. By applying an advanced filter this to this report, I was very able to quickly isolate the conversion rate in Firefox.
  • 25.
    Identify High BounceLanding Pages • Use the landing pages report to see which pages visitors arrive on. • Are people arriving on the pages you expect them to arrive on? • Do users who land on your page end up converting? • Check for high bounce rate and poor converting pages Go to > Behaviour > Site Content>Landing Pages
  • 26.
    Bonus Tip: Youcan use comparison view to view pages that have above average bounce rates for your site. Identify High Bounce Landing Pages
  • 27.
    Organic Landing Pages– with segment • By applying a custom segment we can see data just for that segment i.e ‘Organic’ traffic, Mobile traffic etc. • This report will show you which pages visitors from search engines land on • Note: Google offers limited keyword information about the search terms used by visitors to find your site. apply An organic segment to see top organic landing pages Poor conversion = opportunity for improvement
  • 28.
    Is Page Speedkilling Conversion? • Identify pages with slow page load times (above 3 seconds) that may be affecting conversion rates and SEO • View site speed for different devices, browsers, and geographic areas to find where improvement opportunities exist • TIP: Use Avg. Document Content Loaded Time to give you an accurate reflection of how long it takes before the actual content loads to the user Faster pages = higher conversion rates! = GREATER SUCCESS
  • 29.
    Site Search Reporting •See the most searched for products that users type in on your website • See which pages users were on when they started their search and the pages they went on to. • Identify the searches and pages where people exit (exit page) • See the queries with the highest conversion rates • Can be useful for identify possible issues with navigation or product or content availability. Go to Behaviour > Site Search (Requires Setup)
  • 30.
    You can setupsite search tracking to track what people search for whilst on your site. • Go Admin the tab • Click the web property that contains the view for which you want to set up Site Search. • Use the View menu to select the view you want. • Click the View Settings sub-tab. • Under Site Search Settings, select Do Track Site Search. • In the Query Parameter field, enter the word or words that designate an internal query parameter, such as "term, search, query, s, q". • Sometimes the word is just a letter, such as "s" or "q". Enter up to five parameters, separated by commas. For information about identifying query parameters, see Identifying Search and Query Parameters for Your Site. Setup Site Search Tracking
  • 31.
    Measure Checkout Abandonment UseGoal Funnels to see how visitors progress through your form or checkout process! Understand where abandonment occurs and what your cart to conversion rate is Access Report from (Conversions >Goals>Funnel Visualization) Works for any sequential step Process: • Checkout Steps • Form Completion Steps • Website Category progression
  • 32.
    How to SetupA Goal Goal Funnel If you have a defined step by step journey users take, you can setup goal funnels to see how visitors travelled through a funnel towards a Goal. STEPS: 1. Create a destination Goal 2. Toggle the funnel switch to on 3. Enter the page steps prior to the main goal url Note: Funnels are only possible with URL based goals! 1 3 2
  • 33.
    Abandonment Using BehaviourFlow Report • Use the behaviour flow report to see the path users take from your landing pages in order to identify exit and abandon points. • Are users taking the paths you want them to take? Tip: Best used with segment applied Go to > Behaviour > Site Content>Landing Pages Tip: click to isolate specific paths
  • 34.
  • 35.
    • Allows youto gather your content into common themes to create a more meaningful analysis of your data. • Group by page type, web section or language type and more! • Requires setup! Use Content Grouping for Section Analysis The Apparel section is our top entrance section to the site!
  • 36.
    Content Grouping Setup GoAdmin > View > Content grouping within Google Analytics Group pages using rule definitions i.e ‘url contains…’
  • 37.
    Content Grouping ForSection Navigation Great for seeing see how users navigate from section to section
  • 38.
    Content Grouping ForVisitor Flow • Use content grouping within your Behaviour Flow reports (Behaviour > Behaviour Flow) • Apply different segments to see the most common paths for different user types Segment for non converters applied
  • 39.
    Sales Funnel Report(Custom Report) • Setup a custom report based on your conversion funnel aligned against dimensions such as device, browser, traffic source • Incorporate custom goal data side by side • Helps you quickly identify what stage of the funnel users may be having issues BRING IN YOUR GOAL DATA
  • 40.
    • Go to>Customization tab to get started • Setup a custom report that brings in key goal metrics split by different dimensions • Technical dimensions such as browser, screen resolution, device type are good metrics to use Build A Custom Sales Funnel Report
  • 41.
    Build a Dayof Week Report (custom) • Build and Configure your own reports and views • Schedule Reports to be emailed to you • More comprehensive than dashboards • Go to >Customization tab to get started • Select Day of Week Name as your primary dimension Review conversion rates & volumes for each day! Apply segments to your reports
  • 42.
    Get User Demographic andinterest insights Audience> Demographics Audience>Interests Enable Interest and Demographic Reports
  • 43.
    Enable Interest andDemographic Reports STEP 2: Select the Admin tab and Navigate to the account and property where you want to use Demographic and Interests data. In the PROPERTY column, click Property Settings. • Under Advertising Features, set Enable Demographics and Interests Reports to ON. STEP 1: Select the Admin tab and navigate to the account and property for which you want to enable these features. In the Property column, click Tracking Info, then click Data Collection.
  • 44.
    Blog Reporting Question: Howmany users visited my blog last month? This is actually trickier than it should be, here’s one way: Apply a custom segment based on your pages that include the page path of your blog eg /blog Bingo! This tells me how many users accessed my blog during their visit at somepoint! Note: This is different to Pageviews. 44% of visits accessed my blog
  • 45.
    • Create auser segment based on users who landed on a blog page. • With the segment applied. Go to the conversions report to see how many conversions stemmed from users who entered on blog pages at somepoint. Does my blog convert visitors?
  • 46.
    Advanced Page TrackingFor Blog • Page Title, • Page Topic, • Page Author • Blog Read rate % (Reads/ pageviews ) • Social Share rate % (Shares / pageviews) • Comment Rate % (Comments / pageviews) • Leads and conversions generated Key Metrics Track more than just page views(sessions). Get detailed page reporting using custom metrics and custom dimensions. Requires Technical Setup! Note: A single page View proceeded by an exit will result in a bounced visit.
  • 47.
    Advanced Blog Insights- Reporting Example of pulling together custom metrics into a custom report
  • 48.
    Schedule Custom Reports •Once you have created custom reports you can choose to have it emailed to you at a time of your choosing • Click the email tab on your report to set this up
  • 49.
    Build & ScheduleCustom Dashboards • Configure your own custom data within a single dashboard. Go to > Dashboards section and go to +New Dashboard • Add up to 12 widgets including graphs and data • Allows you to export and setup regular scheduled email reports
  • 50.
  • 51.
    Understanding How AnalyticsAttributes Credit • Google Analytics by default uses a ‘Last Non-Direct Click’ when attributing conversion value in non-Multi- Channel Funnels reports. • The Last Non-Direct Click model ignores direct traffic and attributes 100% of the conversion value to the last channel that the customer clicked through from before buying or converting. 100% AdWords Visit 1 Email Visit 2 Organic Visit 3 Direct Visit 4 Purchase!
  • 52.
    Why Multi-Channel FunnelReporting? • Because different channels work together to drive conversions on your website • Because you want to know the channels that assist in conversions • Use the Multi-Channel reports to see the role of channels that played a role in driving conversions on your website • Go to Conversions > Multi-channel funnels This shows the overlap between channels that work together to drive conversions!
  • 53.
    Assisted Conversions If theassist ratio is above 1 the channel assists more than closes Assisted conversions give you a fuller picture and enable you to see what’s actually driving sales and how users find you. Here you can see how different marketing channels work together to create sales and conversions. Go to Conversion > Multichannel Funnels > Assisted Conversion
  • 54.
    Analyse REAL ChannelContribution • Look beyond last click and assign credit and revenue to first click! • Because Google uses a last (non-direct) click attribution model as standard! • Use the Model Comparison Tool report to assign credit on a First Click basis! • Go to Conversions > Attribution > Model Comparison Tool 50% Difference in Conversion Value for Paid! GA’s default attribution model
  • 55.
  • 56.
    When setting upviews in Google Analytics it is good practice to setup at least 2 views: 1. A Master ‘Filtered’ View (with all your filters applied) 2. A RAW ‘Unfiltered’ Data Profile (No filters applied) 3. A Test Profile – For testing before putting live • This will provide a back up to your reports in case a mistake is made with a particular filter and data loss occurs, or if you want to see the effect filters are having. • When trying out new filters and settings it is often useful to experiment using a third ‘test view’ in the first instance. TIP 1 - Setup Multiple Profiles (Views)
  • 57.
    TIP 2- EliminateSpam and Ghost referrals • Examples: 1-free-share-buttons.com, www1.cookie-law.xyz, compliance-alexa.top, semalt.com, • These can appear as referrals, keywords or fake landing pages in your reports • Check your referral and hostname reports in GA to see these (Audience > Technology >Network > hostname) AND (Acquisition > All Traffic >Referrals >) • Most Google Analytics spam is created by ‘Ghost Visits‘ that can be prevented with a single ‘Valid Hostname’ filter described below. Solution • Implement a Valid Hostname Filter to eliminate ghost visits • Implement a custom source filter to eliminate the targeted spam visits • Turn on Google’s bot & spider filter option within your profile settings Always make sure you have a separate MASTER ‘UNFILTERED’ profile before applying filters in order to provide back up in case of data loss!
  • 58.
    Setup a ValidHostname Filter • Look through your referral traffic reports to identify ghost spam and ‘fake’ traffic that might be polluting your reports. If this is the case you can deal with this in 2 ways: 1. Setting up a filter to only include your sites hostname 2. Setting up a filter to exclude individual traffic sources And
  • 59.
    TIP 3 -Exclude internal traffic by IP address • Click on the Admin link shown at the top of the page. • Click on Filters shown in the right column. • Click the red +NEW FILTER button. • Give the filter a name, for example the office location. • Filter Type: Custom > Exclude • Filter Field: Visitor IP Address • Filter Pattern: For example, if the single IP address is 176.168.1.1, then enter 176.168.1.1. • Click the blue Save button. www.analyticsmarket.com/freetools/ipregex For a range of IP addresses use an IP Address Range Tool Prevent internal traffic being counted as visits by excluding your IP
  • 60.
    Prevent specific domainssuch as third-party gateways from being recognized as referral traffic sources AND STEALING CREDIT FOR CONVERSIONS in GA • Referral exclusions prevent customers from being counted in new session and as a referral when they return to your order confirmation page after checking out on the third-party site. • Manually specify domains you don’t want to be classified as referral traffic such as sagepay.com as well as your own domain! • (Go to Admin > Properties > Referral Exclusions) • Note – This does not block traffic it merely strips out the referral source. Use a separate filter if you want to exclude these visits entering your reports entirely (not recommended). TIP 4 - Use Referral Exclusions Lists
  • 61.
    Benefits of LinkingAdWords • View ad performance data in Analytics Import Goals and Ecommerce transactions into AdWords • Create remarketing lists in Analytics to use in AdWords for targeting specific audiences • Automatically view your AdWords click and cost data alongside your Analytics site engagement data Before setup: • Make sure that you're using a Google Account that has Admin access to both your Analytics and AdWords accounts, and that you have permission to link accounts. • Make sure you have enabled auto-tagging, either during the linking process or by editing your AdWords Account settings. This will allows AdWords to be recognised in GA. TIP 5 - Link Google Analytics and AdWords
  • 62.
    TIP 5 -Link Google Analytics and AdWords 1. Go Admin > Property > AdWords Linking. 2. Select the relevant AdWords account from the list you want to link with your Analytics property with. 3. Select the Analytics view you want to link to (apply to all views if necessary)
  • 63.
    TIP 6 –Convert all campaign names to Lowercase Apply a filter to turn all campaign names, sources and mediums to lowercase within your ga Reports Eliminates the effect of inconsistent capitalisation use on campaign names Why? Because Google analytics is case sensitive so campaigns can appear twice in reports if capitalisation is different.
  • 64.
    TIP 7: SetupCustom Alerts • Setup custom alerts to be alerted and emailed about key events and changes relating to your website • Create custom alerts to key data such as drops in visits, revenue and conversion rates from specific channels. • Alerts can be emailed to various users either daily, weekly or monthly • Go to (Intelligence events > Custom Alerts) Set a condition for your alert i.e when daily visits fall below 1
  • 65.