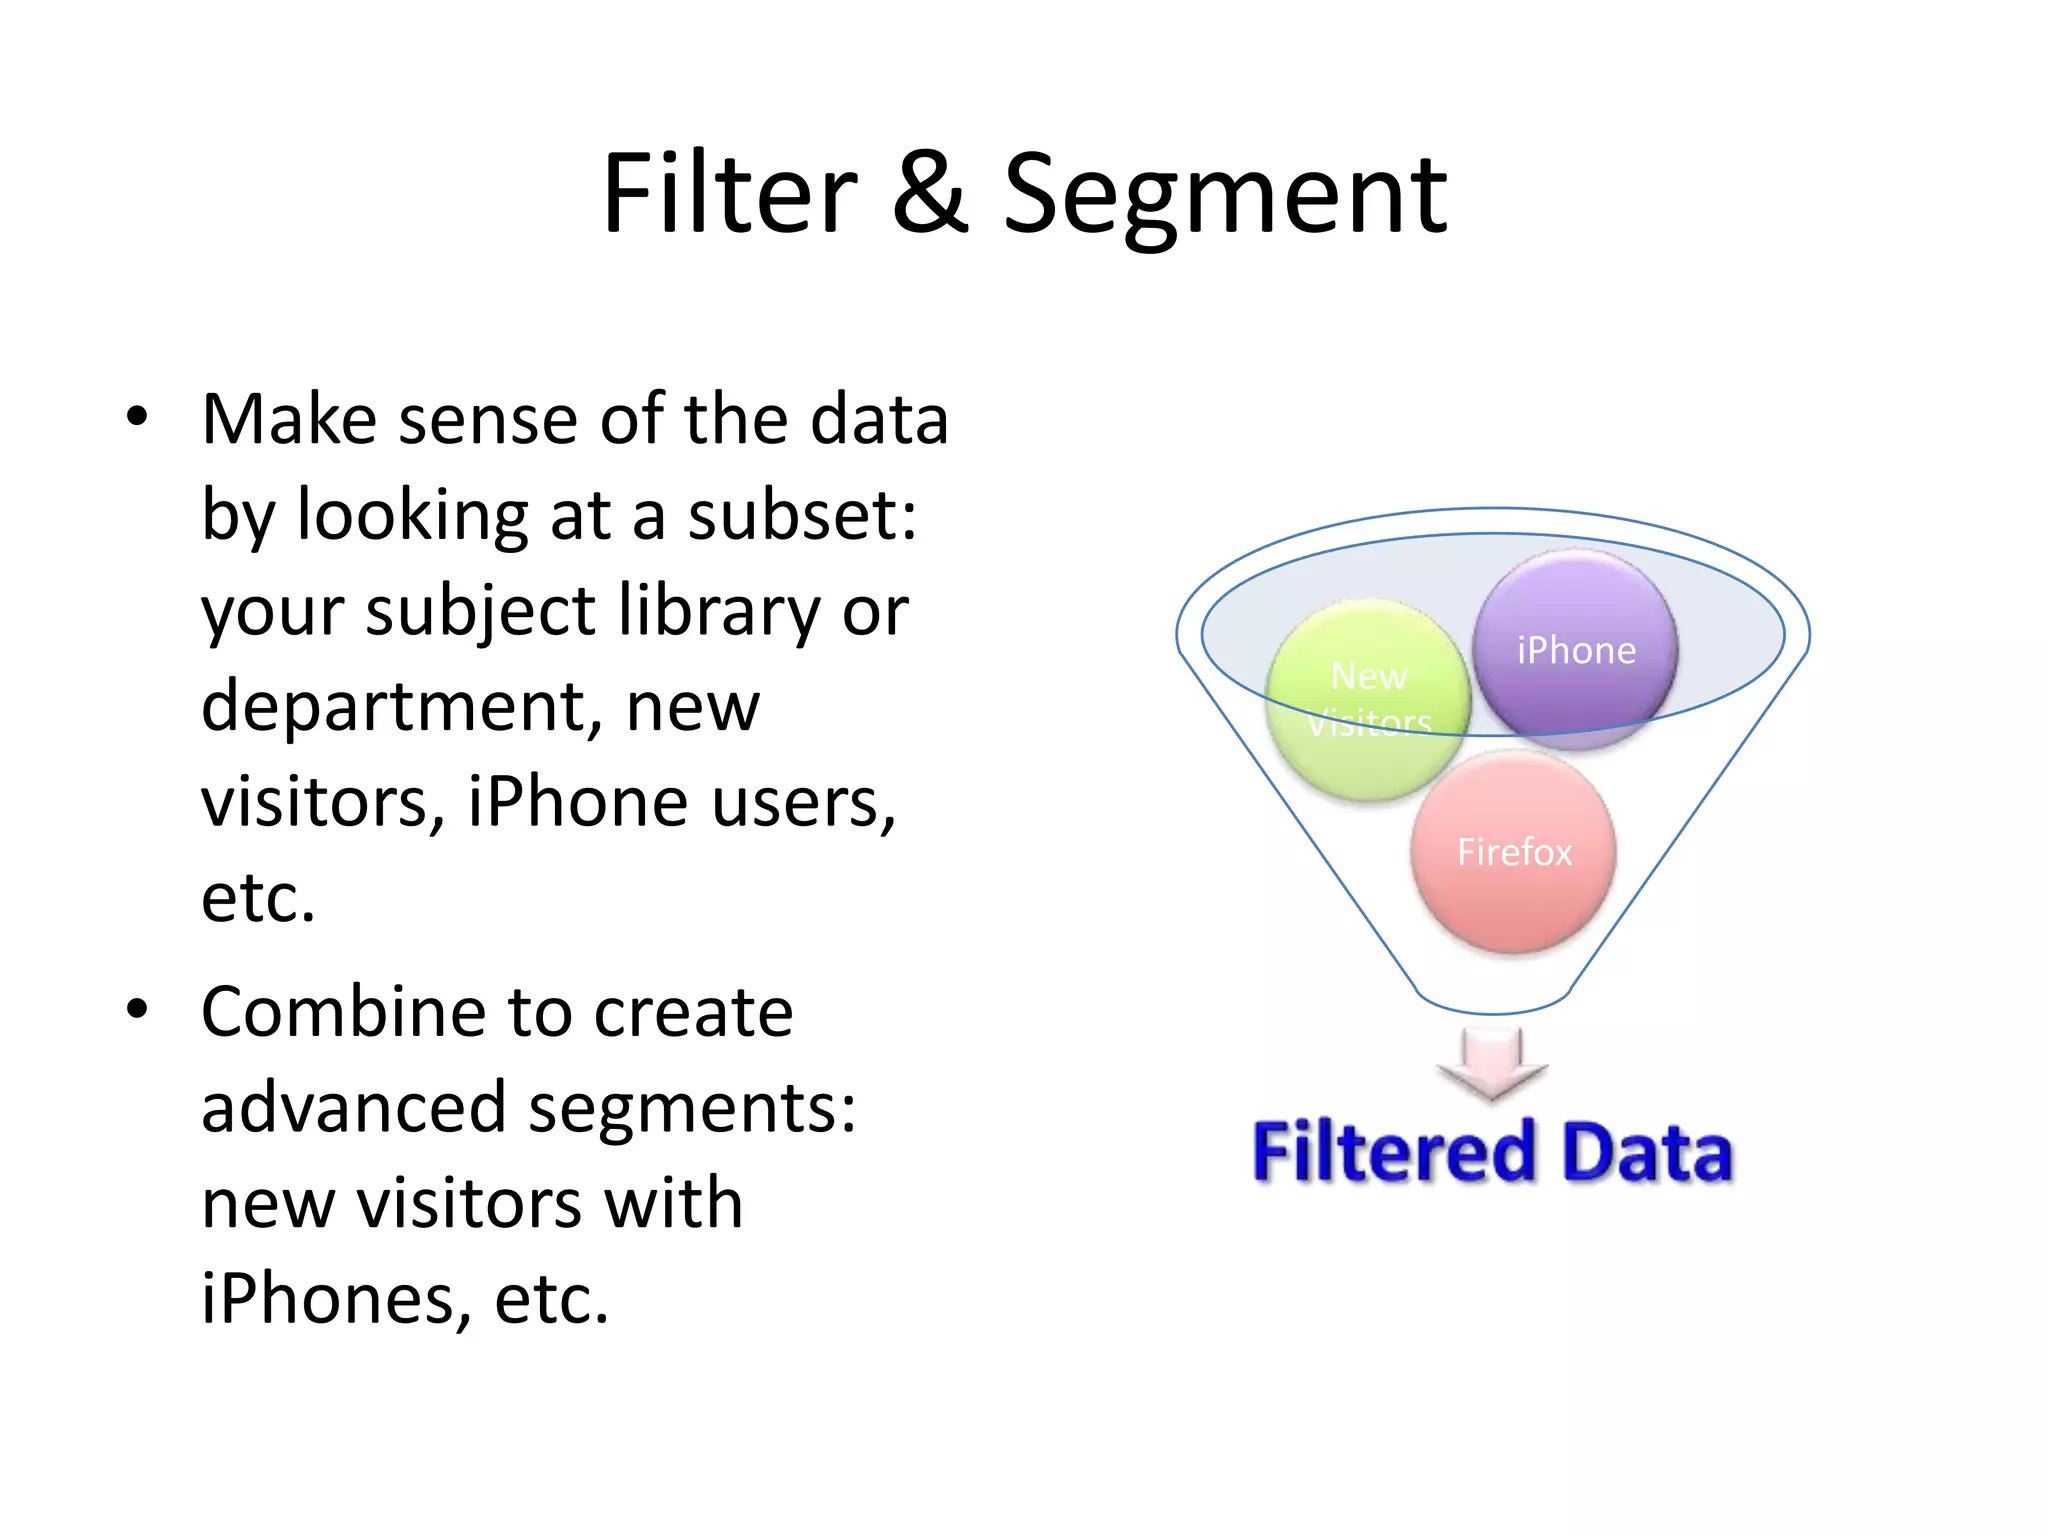
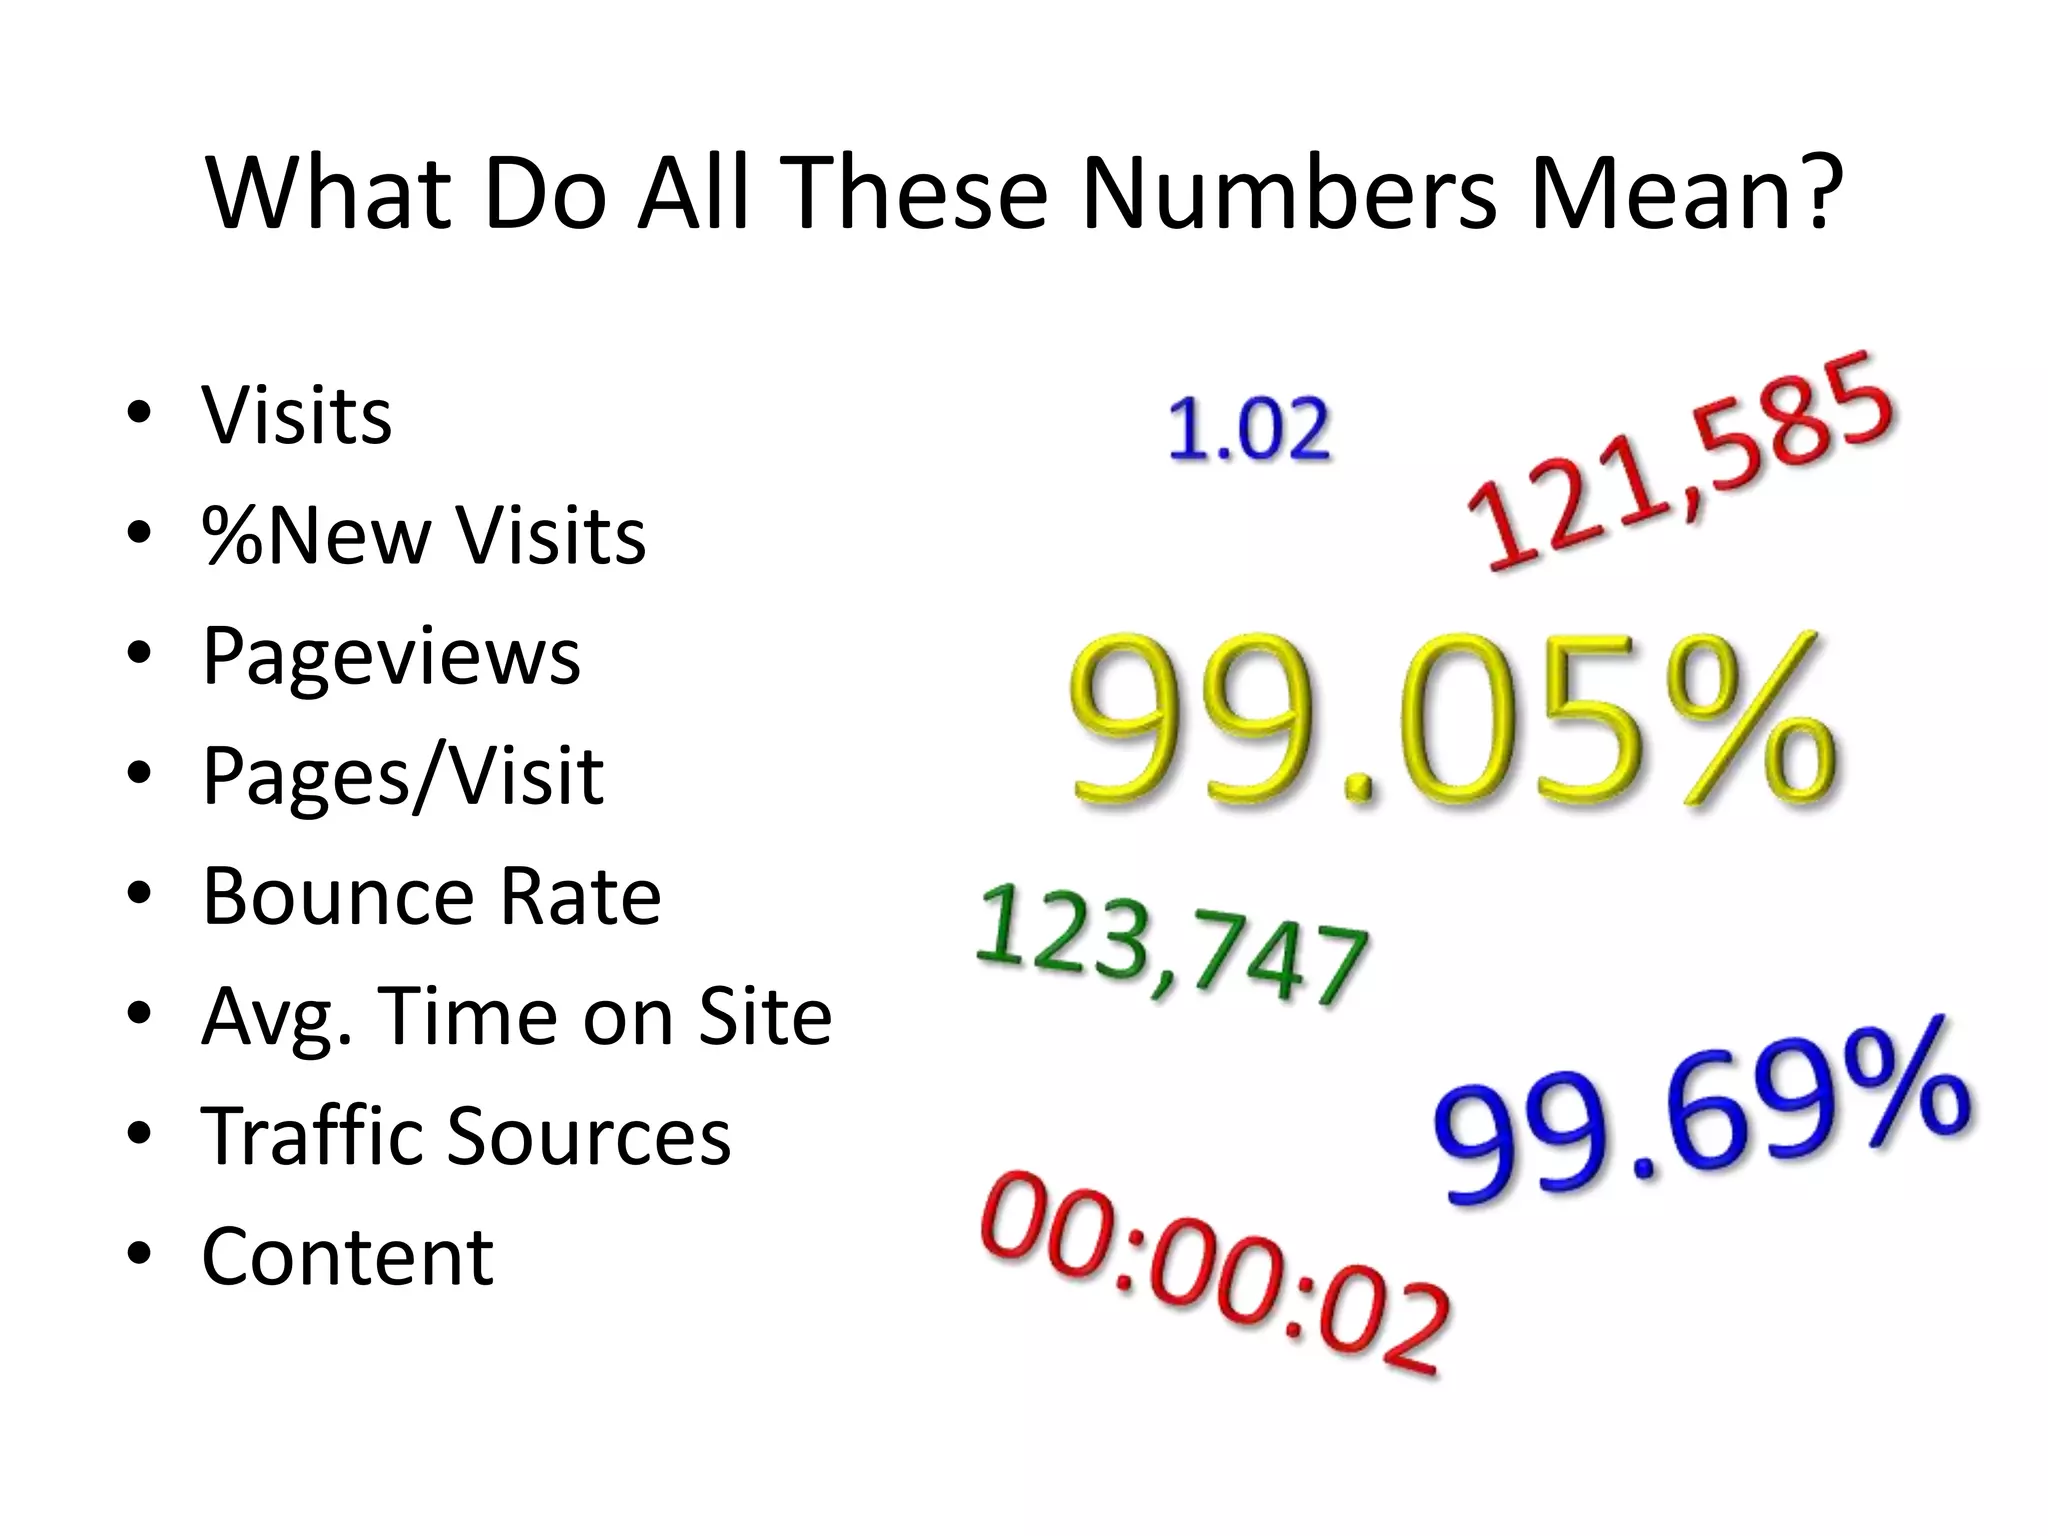
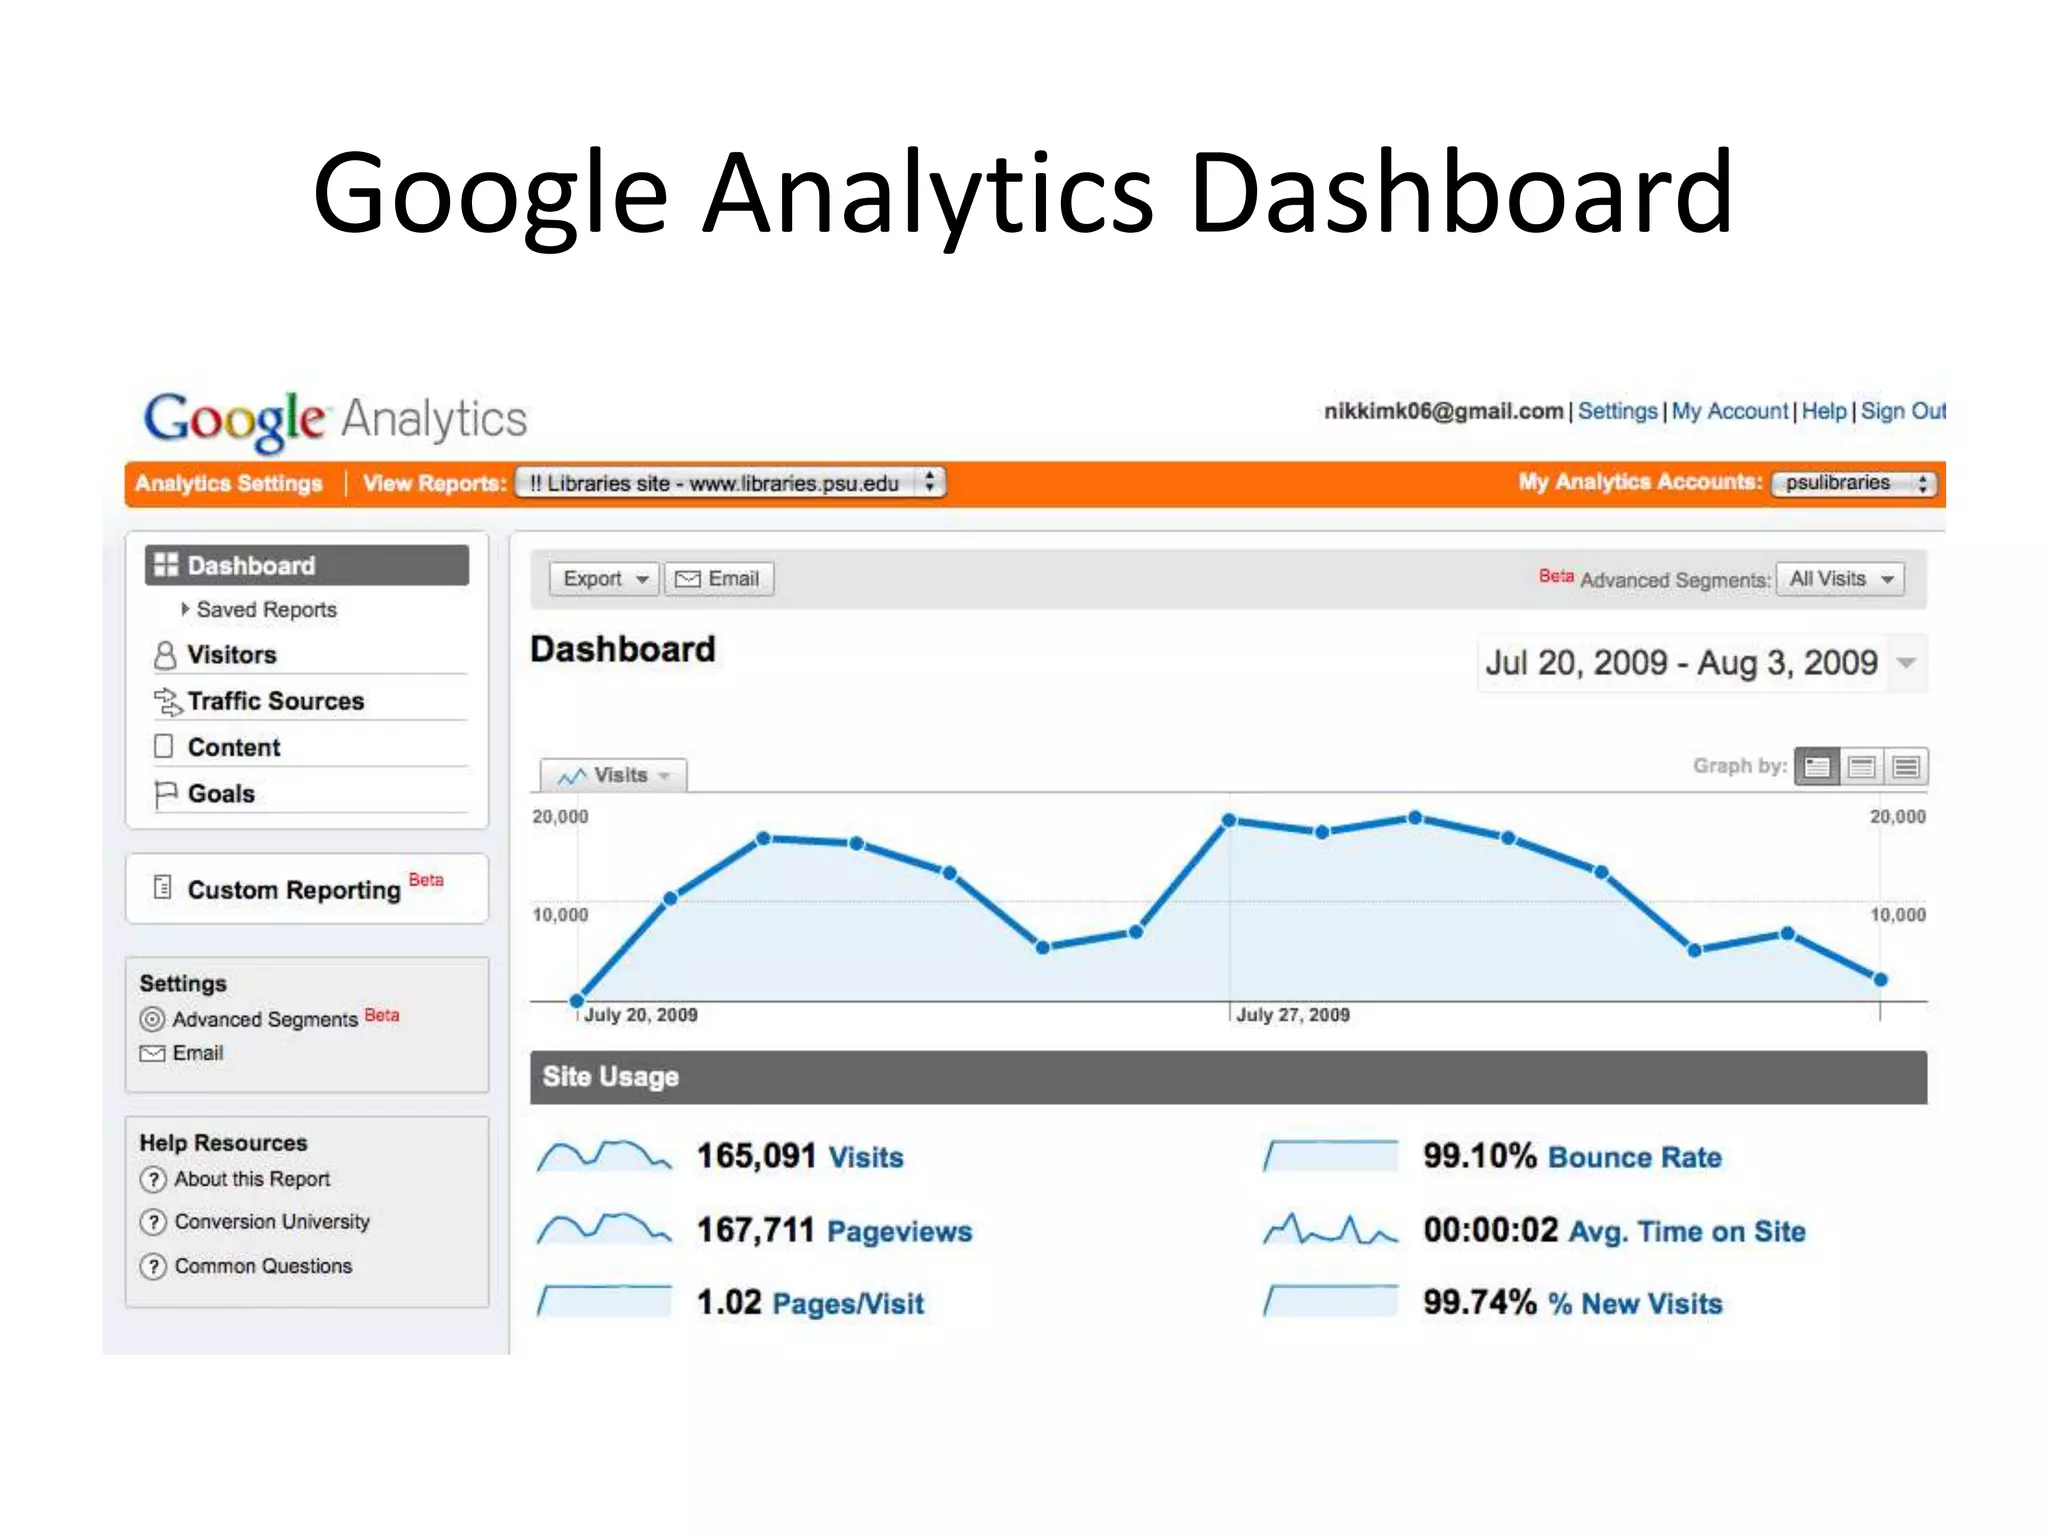
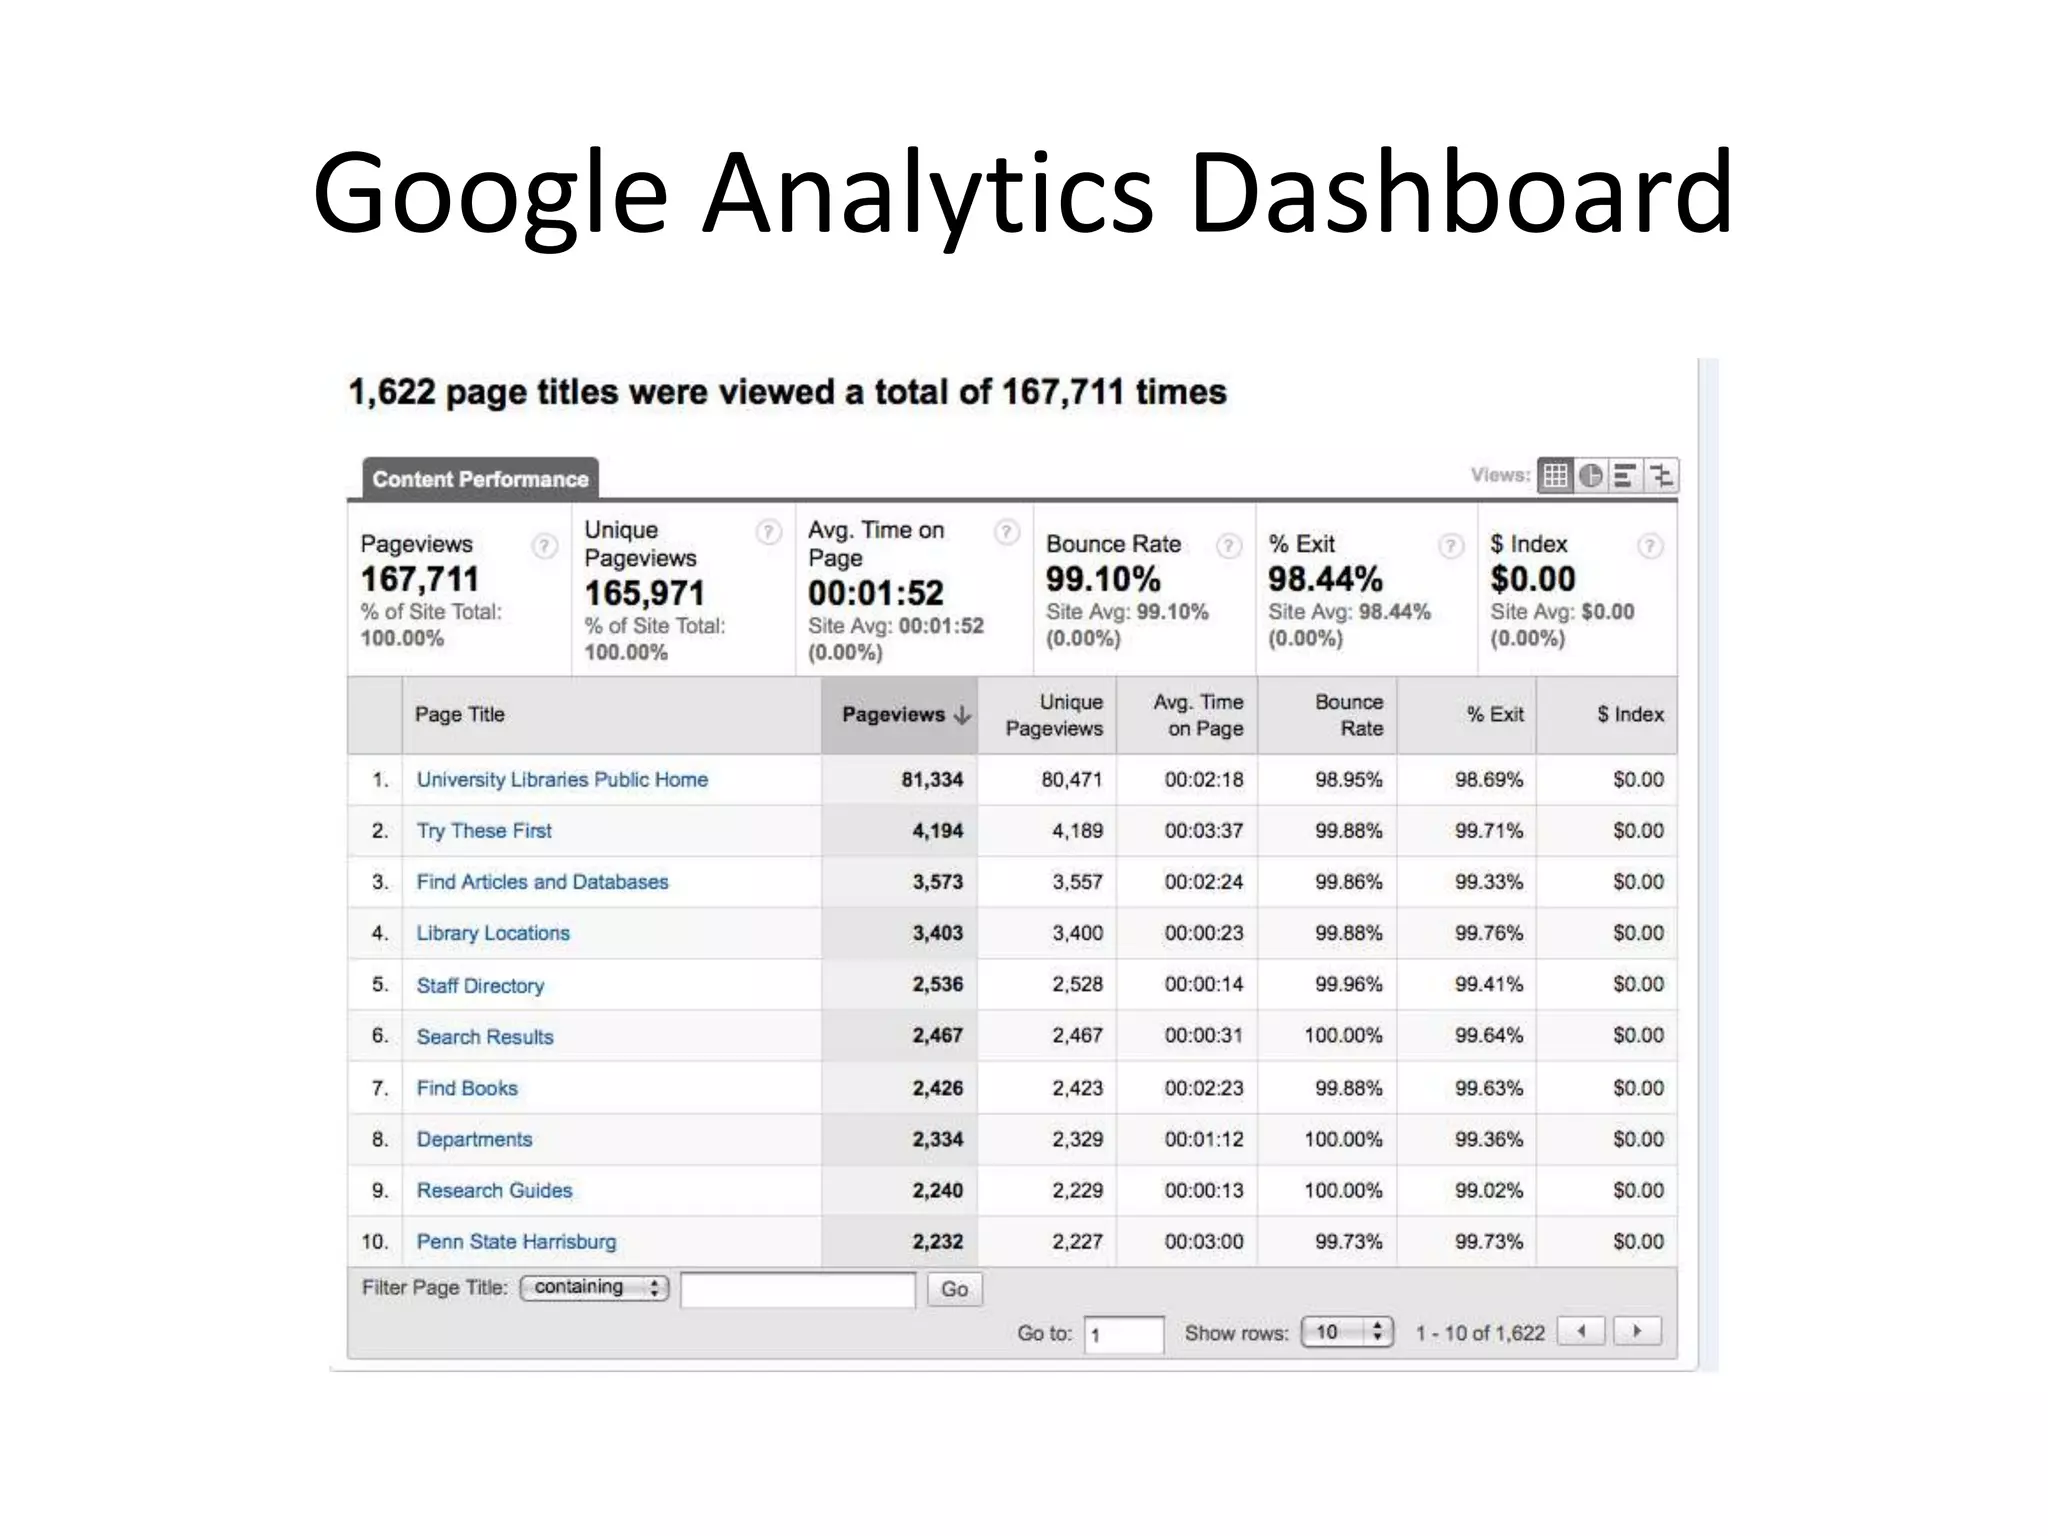
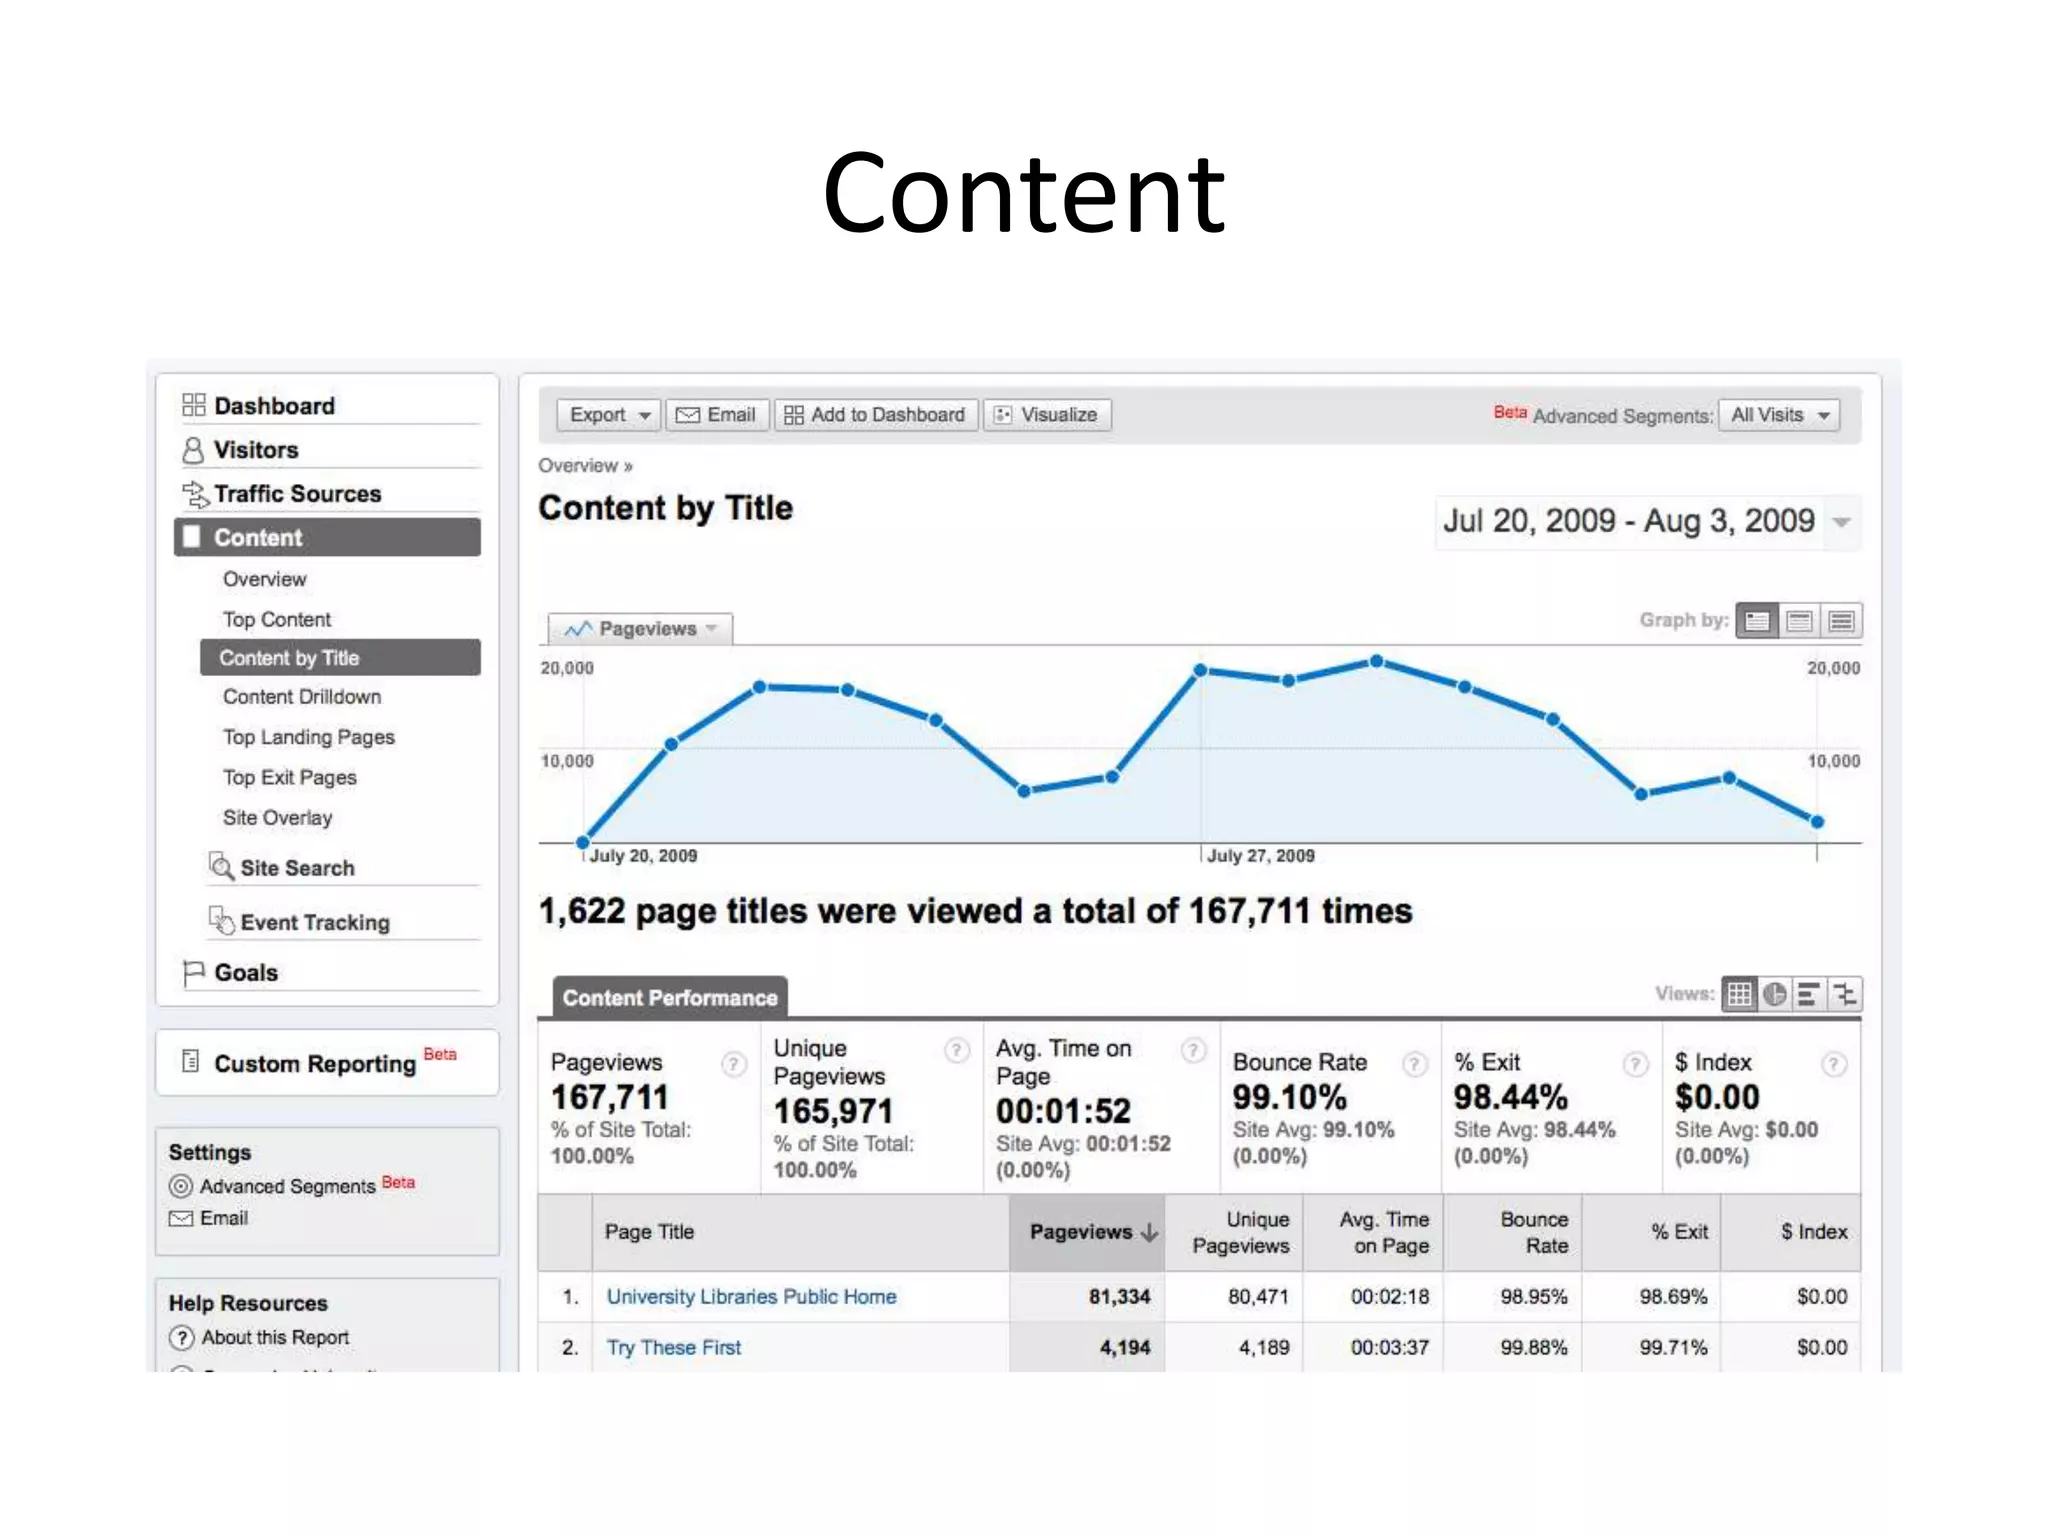
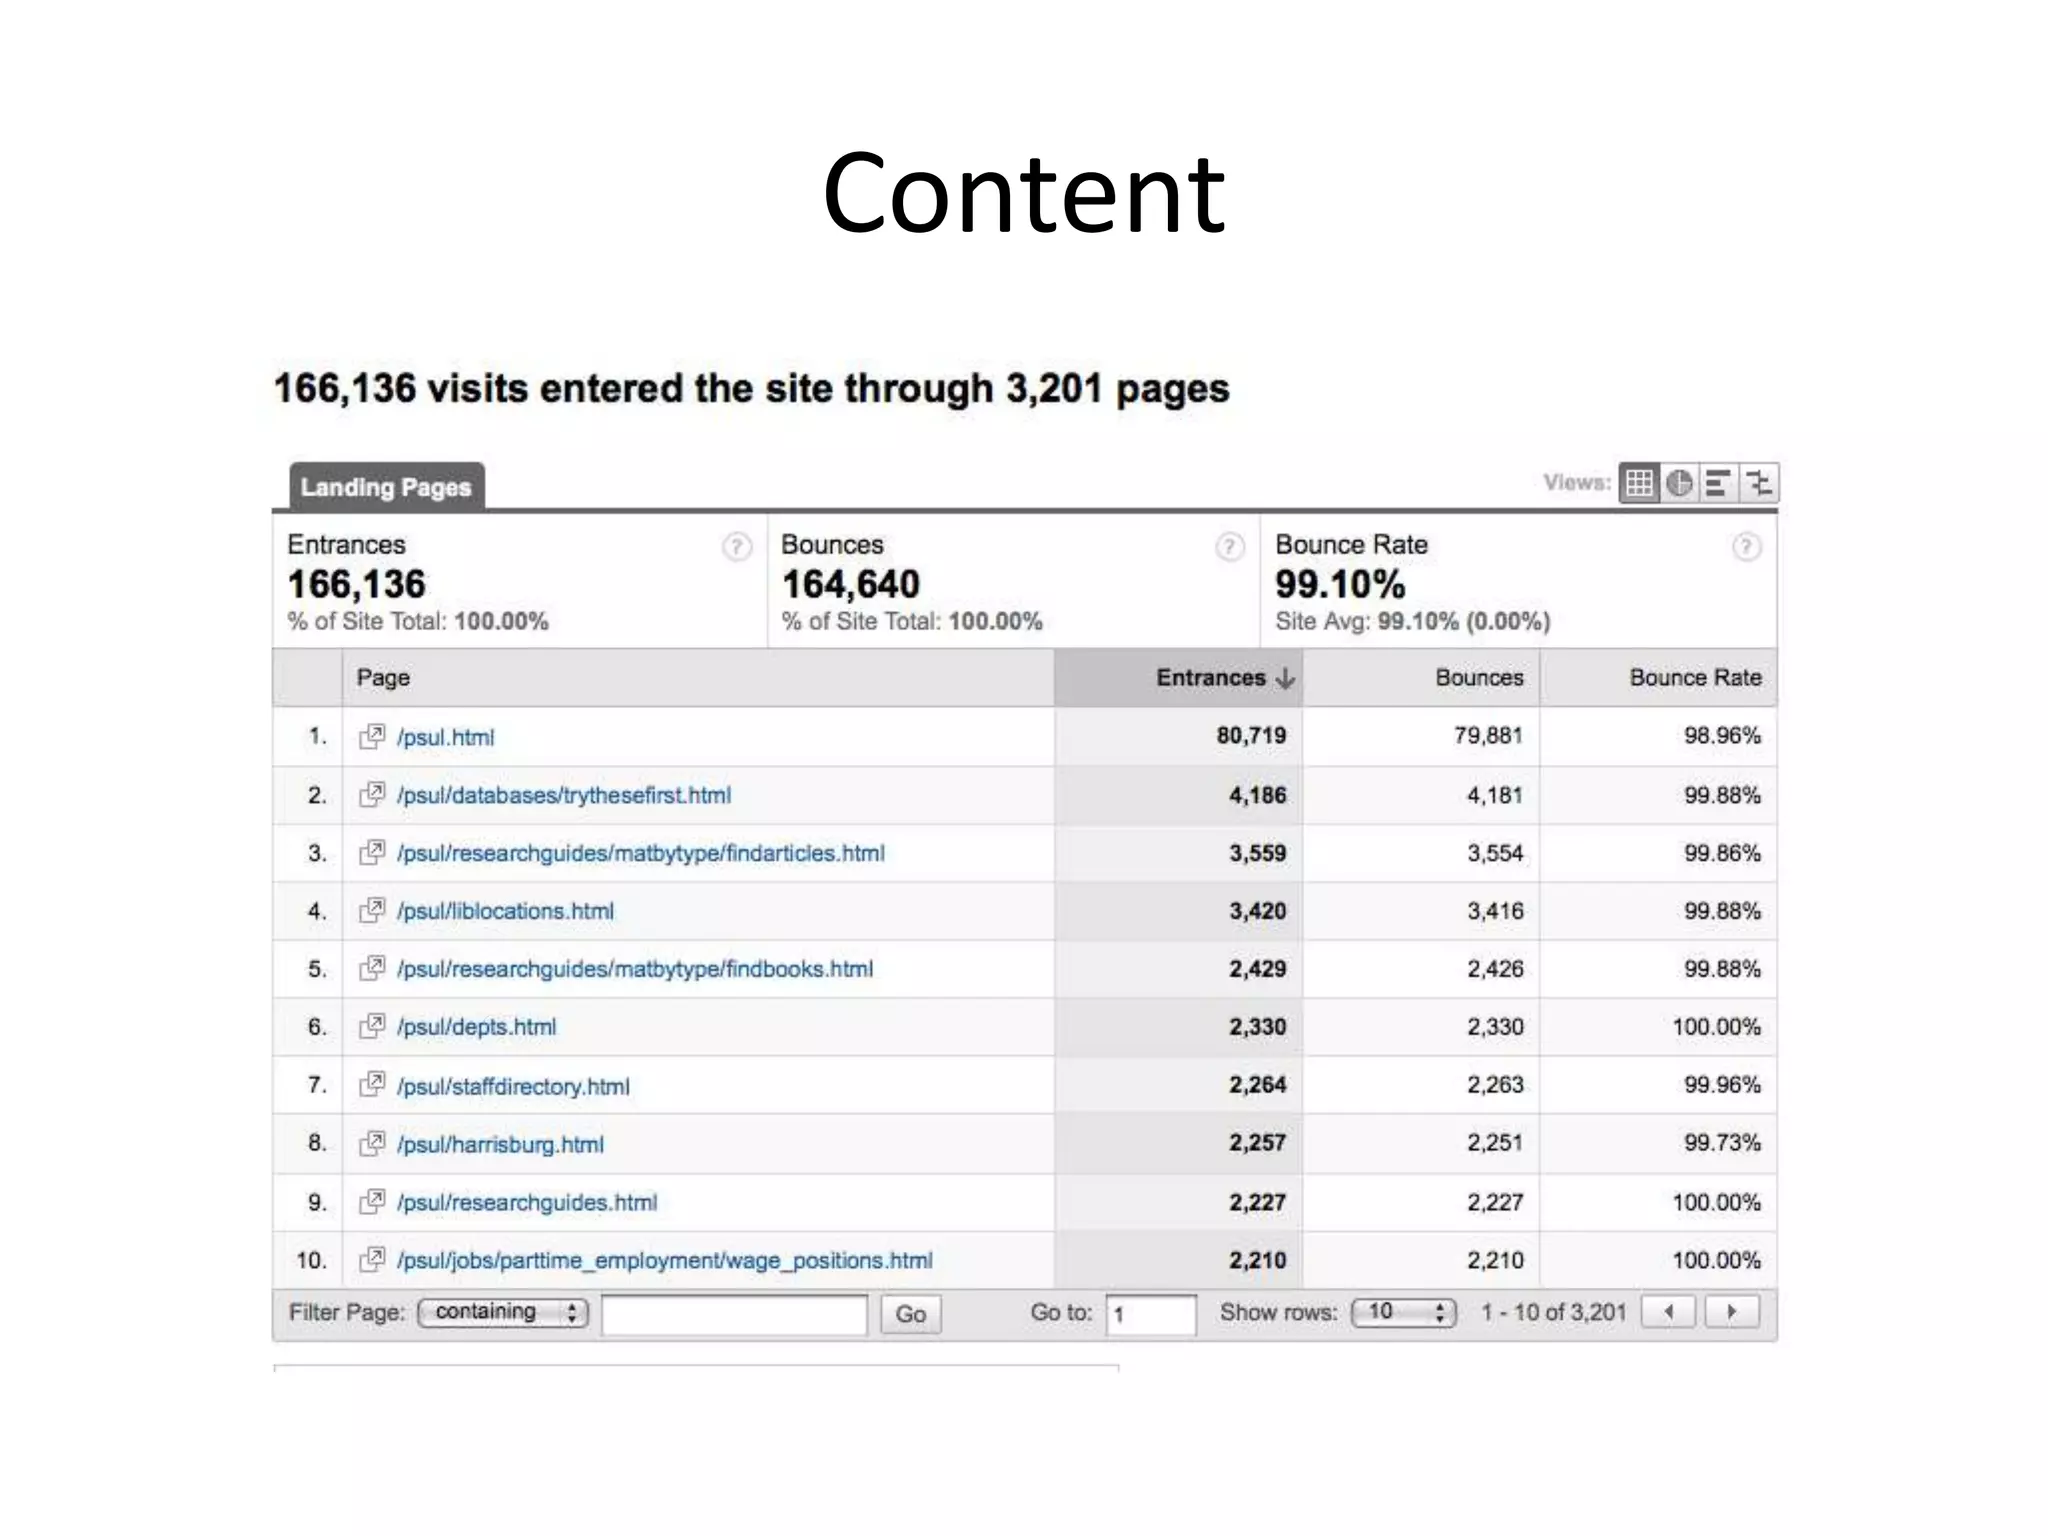
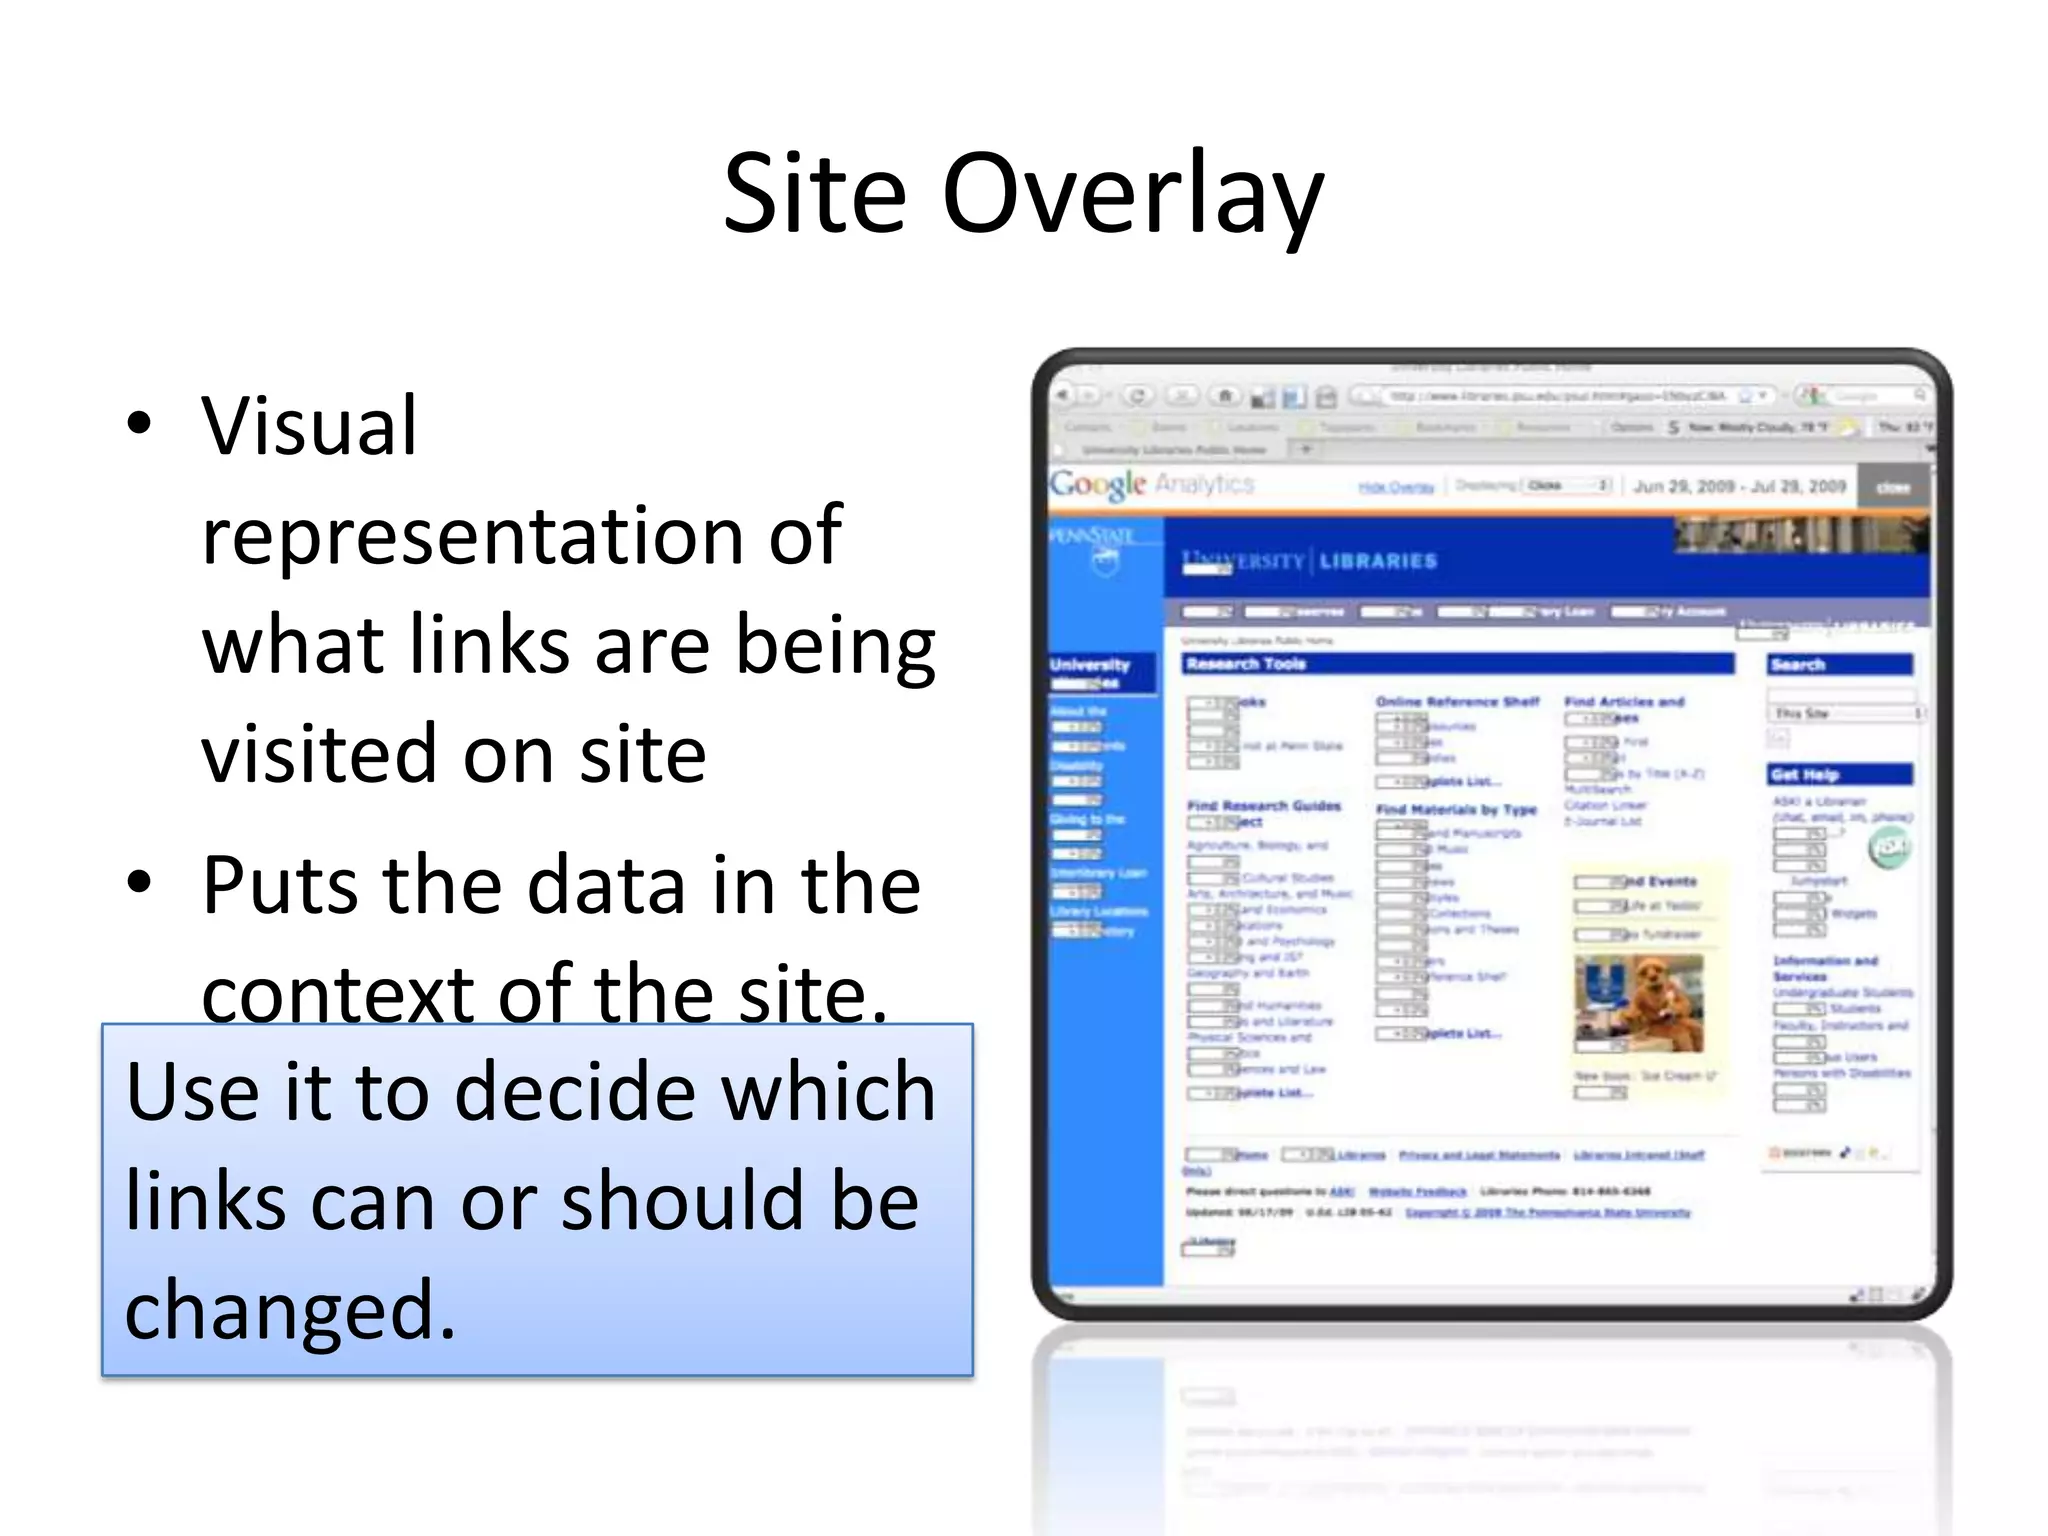
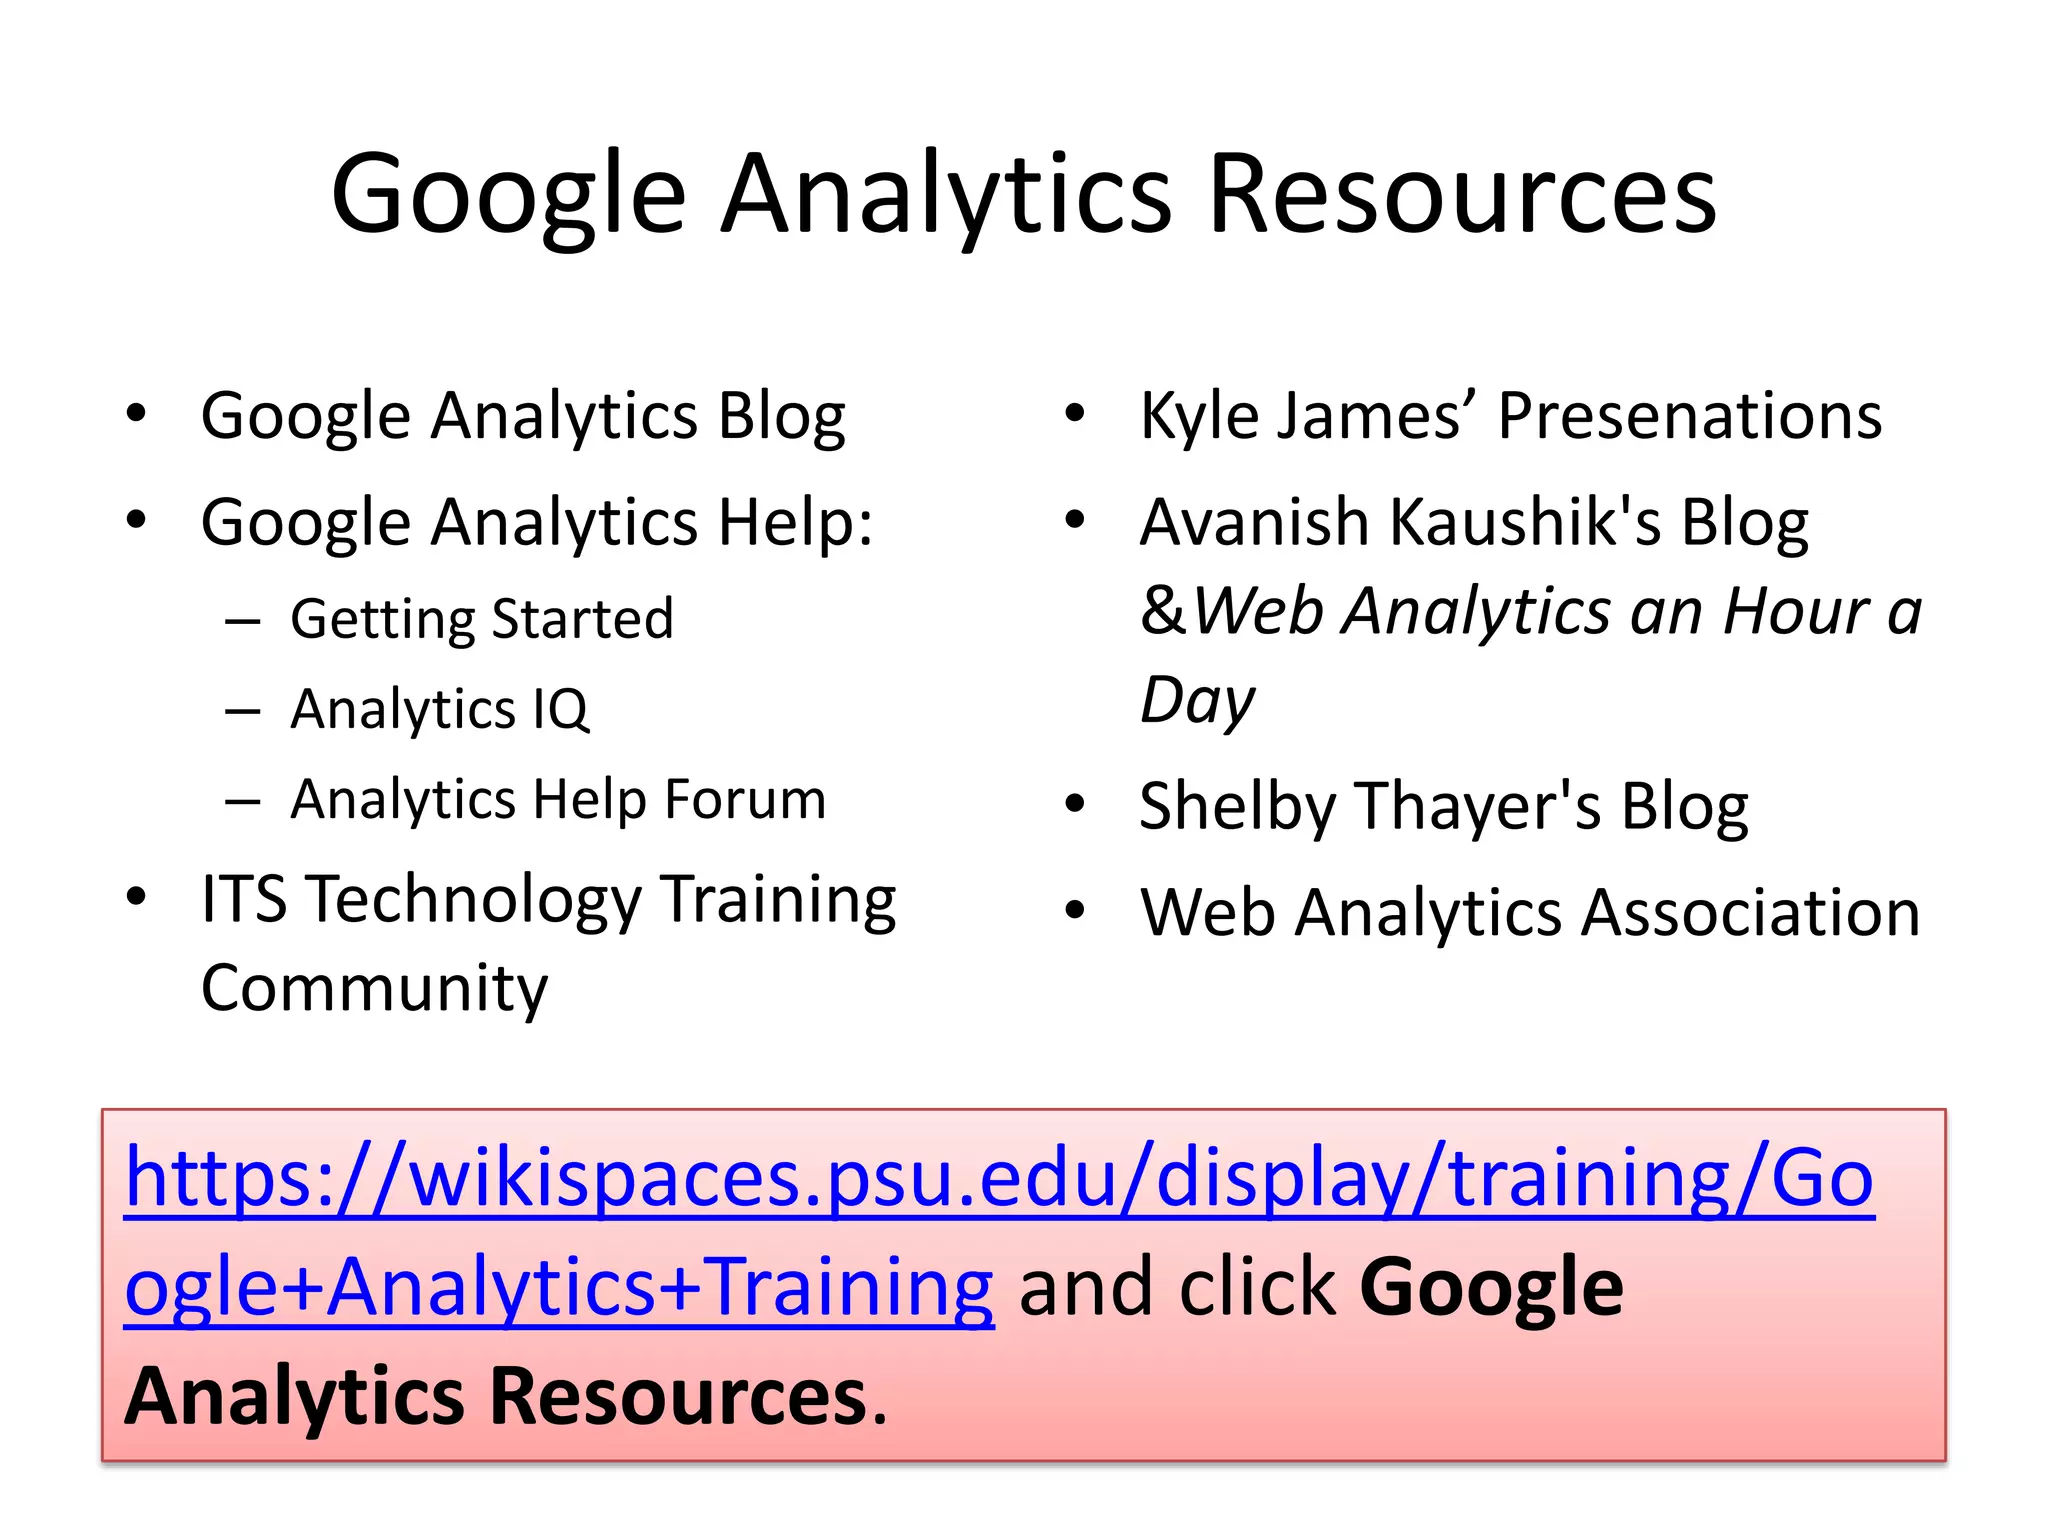
Painting by Numbers:Google Analytics
So What?Ask yourself “so what” 3 times.What can you do with this data?If you can’t do anything, it’s not useful.
Look for TrendsNumbers in a vacuum do not mean much.Can you compare it to something?Can you look at the data over time?42
Don’t Forget Qualitative Data!Must know visitors and pages to interpret analytics data (quantitative).Use surveys, focus groups, or informal chats with visitors to find out about how they use the site (qualitative).
Filter & SegmentMake sense of the data by looking at a subset: your subject library or department, new visitors, iPhone users, etc.Combine to create advanced segments: new visitors with iPhones, etc.
What Do All These Numbers Mean?Visits %New VisitsPageviewsPages/VisitBounce RateAvg. Time on SiteTraffic SourcesContent1.02121,58599.05%123,74799.69%00:00:02
Google Analytics Dashboard
Visits & % New VisitsVisitsMeasured by cookies.From the time a site is accessed until browser is closed or user is inactive for 30 minutes.% New VisitsMeasured by cookies.What about visitors who don’t allow cookies or remove them?
Visits & % New Visits
Pageviews & Pages/VisitPageviewsAn instance of a page being loaded by a browser.Relies on changing URL.Pages/VisitAverage number of pages accessed in a visit.“Visit” as defined previously.Activity on rich media (Flash, etc.) sites will not show up as pageviews without special code.
Pageviews & Pages/Visit
Bounce RatePercentage of visits that left your site after a single pageLook at what page they are on and where they are going. Did they print the page? Did they go to another Libraries site?
Combine Bounce Rate with Keywords or Avg. Time on Site to find out more.
Prioritize bounce rate by most popular landing page.
Look at particular segments to make sure you aren’t losing visitors you want.Bounce Rate
Bounce Rate
Avg. Time on SiteCalculated by timestamps for each page.No way to tell how much time was spent on last page.Did they find what they want or just give up? What can you really do with this information?
Avg. Time on Site
Avg. Time on Site
Traffic SourcesReferring SitesURL where visitor originated before arriving at your siteKeywordsSearch terms that led visitors to your site.“So what?”Try sorting these to find out which give you higher Bounce Rates, fewer Pages/Visit, etc.
Create a segment and look at these areas.Traffic Sources
Traffic Sources
ContentContentwhy people come to your site & what they are looking forTry viewing as Content by TitleLanding Pagescore entry points for visitors (not just your home page)Try sorting Top Content or Landing Pages on Unique Pageviews, Bounce Rate, Etc.
Content
Content
Site OverlayVisual representation of what links are being visited on sitePuts the data in the context of the site.Use it to decide which links can or should be changed.
Hands-On Training Sessions

Google Analyitcs: Painting by Numbers

  • 1.
  • 2.
    So What?Ask yourself“so what” 3 times.What can you do with this data?If you can’t do anything, it’s not useful.
  • 3.
    Look for TrendsNumbersin a vacuum do not mean much.Can you compare it to something?Can you look at the data over time?42
  • 4.
    Don’t Forget QualitativeData!Must know visitors and pages to interpret analytics data (quantitative).Use surveys, focus groups, or informal chats with visitors to find out about how they use the site (qualitative).
  • 5.
    Filter & SegmentMakesense of the data by looking at a subset: your subject library or department, new visitors, iPhone users, etc.Combine to create advanced segments: new visitors with iPhones, etc.
  • 6.
    What Do AllThese Numbers Mean?Visits %New VisitsPageviewsPages/VisitBounce RateAvg. Time on SiteTraffic SourcesContent1.02121,58599.05%123,74799.69%00:00:02
  • 7.
  • 8.
  • 9.
    Visits & %New VisitsVisitsMeasured by cookies.From the time a site is accessed until browser is closed or user is inactive for 30 minutes.% New VisitsMeasured by cookies.What about visitors who don’t allow cookies or remove them?
  • 10.
    Visits & %New Visits
  • 11.
    Visits & %New Visits
  • 12.
    Pageviews & Pages/VisitPageviewsAninstance of a page being loaded by a browser.Relies on changing URL.Pages/VisitAverage number of pages accessed in a visit.“Visit” as defined previously.Activity on rich media (Flash, etc.) sites will not show up as pageviews without special code.
  • 13.
  • 14.
  • 15.
    Bounce RatePercentage ofvisits that left your site after a single pageLook at what page they are on and where they are going. Did they print the page? Did they go to another Libraries site?
  • 16.
    Combine Bounce Ratewith Keywords or Avg. Time on Site to find out more.
  • 17.
    Prioritize bounce rateby most popular landing page.
  • 18.
    Look at particularsegments to make sure you aren’t losing visitors you want.Bounce Rate
  • 19.
  • 20.
    Avg. Time onSiteCalculated by timestamps for each page.No way to tell how much time was spent on last page.Did they find what they want or just give up? What can you really do with this information?
  • 21.
  • 22.
  • 23.
    Traffic SourcesReferring SitesURLwhere visitor originated before arriving at your siteKeywordsSearch terms that led visitors to your site.“So what?”Try sorting these to find out which give you higher Bounce Rates, fewer Pages/Visit, etc.
  • 24.
    Create a segmentand look at these areas.Traffic Sources
  • 25.
  • 26.
    ContentContentwhy people cometo your site & what they are looking forTry viewing as Content by TitleLanding Pagescore entry points for visitors (not just your home page)Try sorting Top Content or Landing Pages on Unique Pageviews, Bounce Rate, Etc.
  • 27.
  • 28.
  • 29.
    Site OverlayVisual representationof what links are being visited on sitePuts the data in the context of the site.Use it to decide which links can or should be changed.
  • 31.
  • 32.
    Google Analytics ResourcesKyleJames’ PresenationsAvanish Kaushik's Blog & Web Analytics an Hour a DayShelby Thayer's BlogWeb Analytics AssociationGoogle Analytics BlogGoogle Analytics Help:Getting StartedAnalytics IQAnalytics Help ForumITS Technology Training Communityhttps://wikispaces.psu.edu/display/training/Google+Analytics+Training and click Google Analytics Resources.
  • 33.

Editor's Notes

  • #4 Compare pageviews to unique pageviews. Time on page this before redesign to after redesign. Data is only as good as August 1st. Like a new car, gas mileage is not accurate yet.
  • #5 Quantitative = What? / Qualitative=Why?
  • #7 As defined by Google Analytics. *See Web Analytics Association for their standards: http://www.webanalyticsassociation.org/attachments/committees/5/WAA_Web_Analytics_Definitions_20080922_For_Public_Comment.pdf
  • #13 See http://code.google.com/apis/analytics/docs/tracking/eventTrackerGuide.html
  • #16 * What is the type of page? Do you want them to find what they want & move from it quickly?
  • #22 Direct traffic. Keywords are external not internal for public until new version of CMS goes live. Beta possible for Spring semester.
  • #25 These are your storefronts or anchors stores for your site.