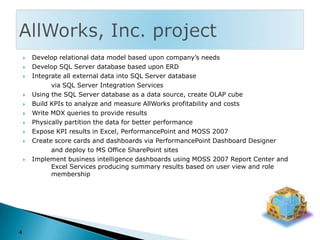
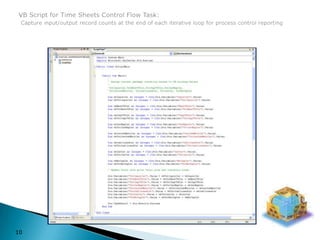
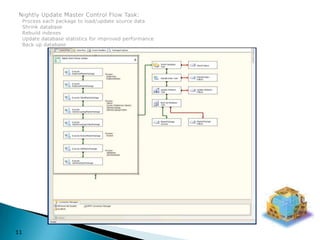
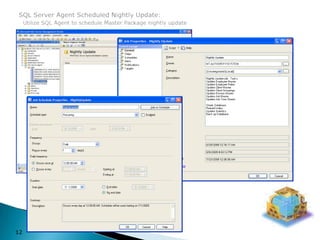
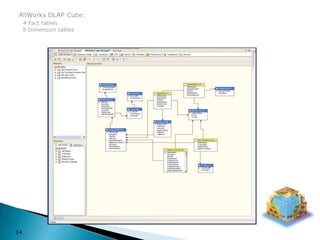
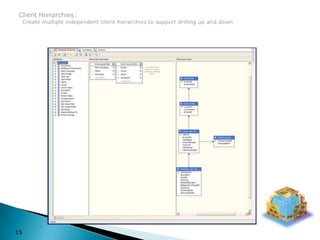
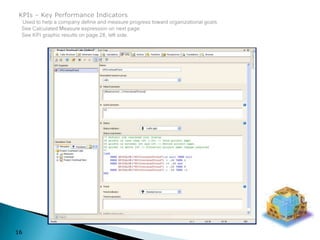
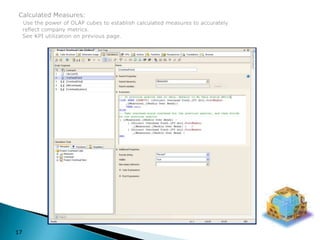
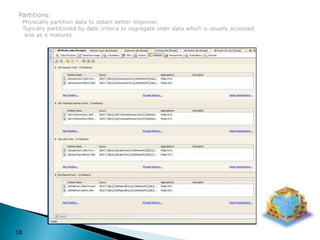
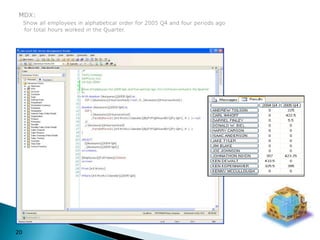
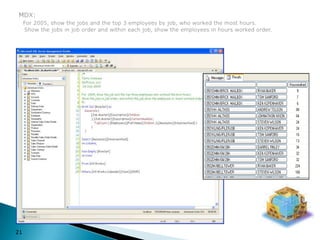
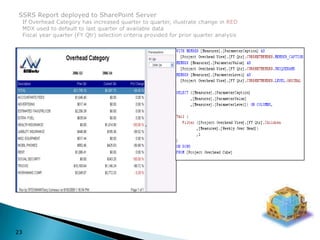
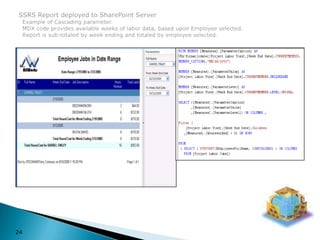
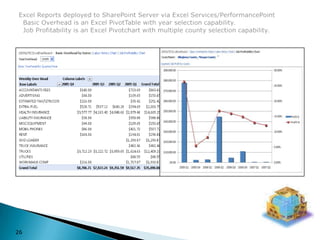
Terry ComeauxBusinessIntelligencePortfolioTComeaux@austin.rr.com713-553-9148
Business Intelligence - NowSQL Server Integration Services - SSISSQL Server Analysis Services - SSASMulti-Dimensional eXpressions - MDXSQL Server Reporting Services – SSRSExcel ServicesPerformancePoint Server – PPS	MS Office SharePoint Server – MOSS 2007Table of Contents2
Now more than ever before, you need to get the right information to the right people faster.  Business Intelligence (BI) solutions can help everyone in your organization quickly access the timely, relevant, and accurate information that drives better decision making and impacts your bottom line.Business Intelligence (BI) solutions can help your organization:Get real-time informationFind profitable customersPivot on a dimeFind inefficienciesSave moneyBusiness Intelligence - Now3
Develop relational data model based upon company’s needsDevelop SQL Server database based upon ERDIntegrate all external data into SQL Server database      	via SQL Server Integration ServicesUsing the SQL Server database as a data source, create OLAP cubeBuild KPIs to analyze and measure AllWorks profitability and costsWrite MDX queries to provide resultsPhysically partition the data for better performanceExpose KPI results in Excel, PerformancePoint and MOSS 2007Create score cards and dashboards via PerformancePoint Dashboard Designer		and deploy to MS Office SharePoint sitesImplement business intelligence dashboards using MOSS 2007 Report Center and 	Excel Services producing summary results based on user view and role 	membershipAllWorks, Inc. project4
SQL Server Integration ServicesSSIS5
Job Master Data Flow Task:Load data from source file & convert to SQL format  Perform lookups to determine processing pipeline  Insert/update data or write error log record  Capture input/output record counts for process control6
Employee Master Data Flow Task:Load data from source file & convert to SQL format  Perform lookups to determine processing pipeline  Insert/update data or write error log record  Capture input/output record counts for process control7
Job Time Sheets Control Flow Task:Prep error logs for current day process  Read all timesheets for period  VB Script required to capture iterative counts (see slide 10)  Report input/output record counts for process control8
Job Time Sheets Data Flow Task:Load data from source file & convert to SQL format  Perform lookups to determine processing pipeline  Insert/update data or write error log record  Capture input/output record counts for process control9
VB Script for Time Sheets Control Flow Task:Capture input/output record counts at the end of each iterative loop for process control reporting10
Nightly Update Master Control Flow Task:  Process each package to load/update source data  Shrink database  Rebuild indexes  Update database statistics for improved performance  Back up database11
SQL Server Agent Scheduled Nightly Update:Utilize SQL Agent to schedule Master Package nightly update12
SQL Server Analysis ServicesSSAS13
AllWorks OLAP Cube:4 Fact tables  9 Dimension tables14
Client Hierarchies:  Create multiple independent client hierarchies to support drilling up and down15
KPIs – Key Performance IndicatorsUsed to help a company define and measure progress toward organizational goals.  See Calculated Measure expression on next page.   See KPI graphic results on page 28, left side.16
Calculated Measures:Use the power of OLAP cubes to establish calculated measures to accurately  reflect company metrics.  See KPI utilization on previous page.17
Partitions:  Physically partition data to obtain better response.  Typically partitioned by date criteria to segregate older data which is usually accessed   less as it matures.18
Multi-Dimensional eXpressionsMDX19
MDX:Show all employees in alphabetical order for 2005 Q4 and four periods ago    for total hours worked in the Quarter.20
MDX:For 2005, show the jobs and the top 3 employees by job, who worked the most hours.    Show the jobs in job order and within each job, show the employees in hours worked order.21
SQL Server Reporting ServicesSSRS22
SSRS Report deployed to SharePoint Server  If Overhead Category has increased quarter to quarter, illustrate change in RED  MDX used to default to last quarter of available data  Fiscal year quarter (FY Qtr) selection criteria provided for prior quarter analysis23
SSRS Report deployed to SharePoint Server  Example of Cascading parameter.    MDX code provides available weeks of labor data, based upon Employee selected.  Report is sub-totaled by week ending and totaled by employee selected.24
Excel Services25
Excel Reports deployed to SharePoint Server via Excel Services/PerformancePoint  Basic Overhead is an Excel PivotTable with year selection capability.  Job Profitability is an Excel Pivotchart with multiple county selection capability.26
PerformancePoint ServerPPSMS Office SharePoint ServerMOSS 200727
PerformancePoint Dashboard page with OLAP sourced KPIs Final deployment to SharePoint Server  Overhead Trend allows selection of quarter and presents by category what the percentage change is.    Desired result is less than 10%.  Greater than 15% is critical status.  Client Job Financials consists of 3 separate KPIs, all stacked on 1 scorecard;    Open Receivables as a Percentage of Invoice, Profit Percentage and Overhead as a Percentage of Total Costs.28
PerformancePoint Dashboard page with OLAP sourced dataFinal deployment to SharePoint ServerOverhead Line Chart allows selection of multiple overhead categories and presents all available   quarters of data29
PerformancePoint Dashboard page with OLAP sourced dataFinal deployment to SharePoint ServerDual Y-axis bar chart and Analytic Grid on same page.  Single Employee selection drives both results.  MDX required to derive result sets.30
31This represents just a sampling of my capabilities.Very flexible in location and travel considerations.For further information or to schedule an interview:	Terry Comeaux   713-553-9148	TComeaux@Austin.RR.Com.

BI Portfolio

  • 1.
  • 2.
    Business Intelligence -NowSQL Server Integration Services - SSISSQL Server Analysis Services - SSASMulti-Dimensional eXpressions - MDXSQL Server Reporting Services – SSRSExcel ServicesPerformancePoint Server – PPS MS Office SharePoint Server – MOSS 2007Table of Contents2
  • 3.
    Now more thanever before, you need to get the right information to the right people faster. Business Intelligence (BI) solutions can help everyone in your organization quickly access the timely, relevant, and accurate information that drives better decision making and impacts your bottom line.Business Intelligence (BI) solutions can help your organization:Get real-time informationFind profitable customersPivot on a dimeFind inefficienciesSave moneyBusiness Intelligence - Now3
  • 4.
    Develop relational datamodel based upon company’s needsDevelop SQL Server database based upon ERDIntegrate all external data into SQL Server database via SQL Server Integration ServicesUsing the SQL Server database as a data source, create OLAP cubeBuild KPIs to analyze and measure AllWorks profitability and costsWrite MDX queries to provide resultsPhysically partition the data for better performanceExpose KPI results in Excel, PerformancePoint and MOSS 2007Create score cards and dashboards via PerformancePoint Dashboard Designer and deploy to MS Office SharePoint sitesImplement business intelligence dashboards using MOSS 2007 Report Center and Excel Services producing summary results based on user view and role membershipAllWorks, Inc. project4
  • 5.
  • 6.
    Job Master DataFlow Task:Load data from source file & convert to SQL format Perform lookups to determine processing pipeline Insert/update data or write error log record Capture input/output record counts for process control6
  • 7.
    Employee Master DataFlow Task:Load data from source file & convert to SQL format Perform lookups to determine processing pipeline Insert/update data or write error log record Capture input/output record counts for process control7
  • 8.
    Job Time SheetsControl Flow Task:Prep error logs for current day process Read all timesheets for period VB Script required to capture iterative counts (see slide 10) Report input/output record counts for process control8
  • 9.
    Job Time SheetsData Flow Task:Load data from source file & convert to SQL format Perform lookups to determine processing pipeline Insert/update data or write error log record Capture input/output record counts for process control9
  • 10.
    VB Script forTime Sheets Control Flow Task:Capture input/output record counts at the end of each iterative loop for process control reporting10
  • 11.
    Nightly Update MasterControl Flow Task: Process each package to load/update source data Shrink database Rebuild indexes Update database statistics for improved performance Back up database11
  • 12.
    SQL Server AgentScheduled Nightly Update:Utilize SQL Agent to schedule Master Package nightly update12
  • 13.
    SQL Server AnalysisServicesSSAS13
  • 14.
    AllWorks OLAP Cube:4Fact tables 9 Dimension tables14
  • 15.
    Client Hierarchies: Create multiple independent client hierarchies to support drilling up and down15
  • 16.
    KPIs – KeyPerformance IndicatorsUsed to help a company define and measure progress toward organizational goals. See Calculated Measure expression on next page. See KPI graphic results on page 28, left side.16
  • 17.
    Calculated Measures:Use thepower of OLAP cubes to establish calculated measures to accurately reflect company metrics. See KPI utilization on previous page.17
  • 18.
    Partitions: Physicallypartition data to obtain better response. Typically partitioned by date criteria to segregate older data which is usually accessed less as it matures.18
  • 19.
  • 20.
    MDX:Show all employeesin alphabetical order for 2005 Q4 and four periods ago for total hours worked in the Quarter.20
  • 21.
    MDX:For 2005, showthe jobs and the top 3 employees by job, who worked the most hours. Show the jobs in job order and within each job, show the employees in hours worked order.21
  • 22.
    SQL Server ReportingServicesSSRS22
  • 23.
    SSRS Report deployedto SharePoint Server If Overhead Category has increased quarter to quarter, illustrate change in RED MDX used to default to last quarter of available data Fiscal year quarter (FY Qtr) selection criteria provided for prior quarter analysis23
  • 24.
    SSRS Report deployedto SharePoint Server Example of Cascading parameter. MDX code provides available weeks of labor data, based upon Employee selected. Report is sub-totaled by week ending and totaled by employee selected.24
  • 25.
  • 26.
    Excel Reports deployedto SharePoint Server via Excel Services/PerformancePoint Basic Overhead is an Excel PivotTable with year selection capability. Job Profitability is an Excel Pivotchart with multiple county selection capability.26
  • 27.
    PerformancePoint ServerPPSMS OfficeSharePoint ServerMOSS 200727
  • 28.
    PerformancePoint Dashboard pagewith OLAP sourced KPIs Final deployment to SharePoint Server Overhead Trend allows selection of quarter and presents by category what the percentage change is. Desired result is less than 10%. Greater than 15% is critical status. Client Job Financials consists of 3 separate KPIs, all stacked on 1 scorecard; Open Receivables as a Percentage of Invoice, Profit Percentage and Overhead as a Percentage of Total Costs.28
  • 29.
    PerformancePoint Dashboard pagewith OLAP sourced dataFinal deployment to SharePoint ServerOverhead Line Chart allows selection of multiple overhead categories and presents all available quarters of data29
  • 30.
    PerformancePoint Dashboard pagewith OLAP sourced dataFinal deployment to SharePoint ServerDual Y-axis bar chart and Analytic Grid on same page. Single Employee selection drives both results. MDX required to derive result sets.30
  • 31.
    31This represents justa sampling of my capabilities.Very flexible in location and travel considerations.For further information or to schedule an interview: Terry Comeaux 713-553-9148 TComeaux@Austin.RR.Com.