Download to read offline
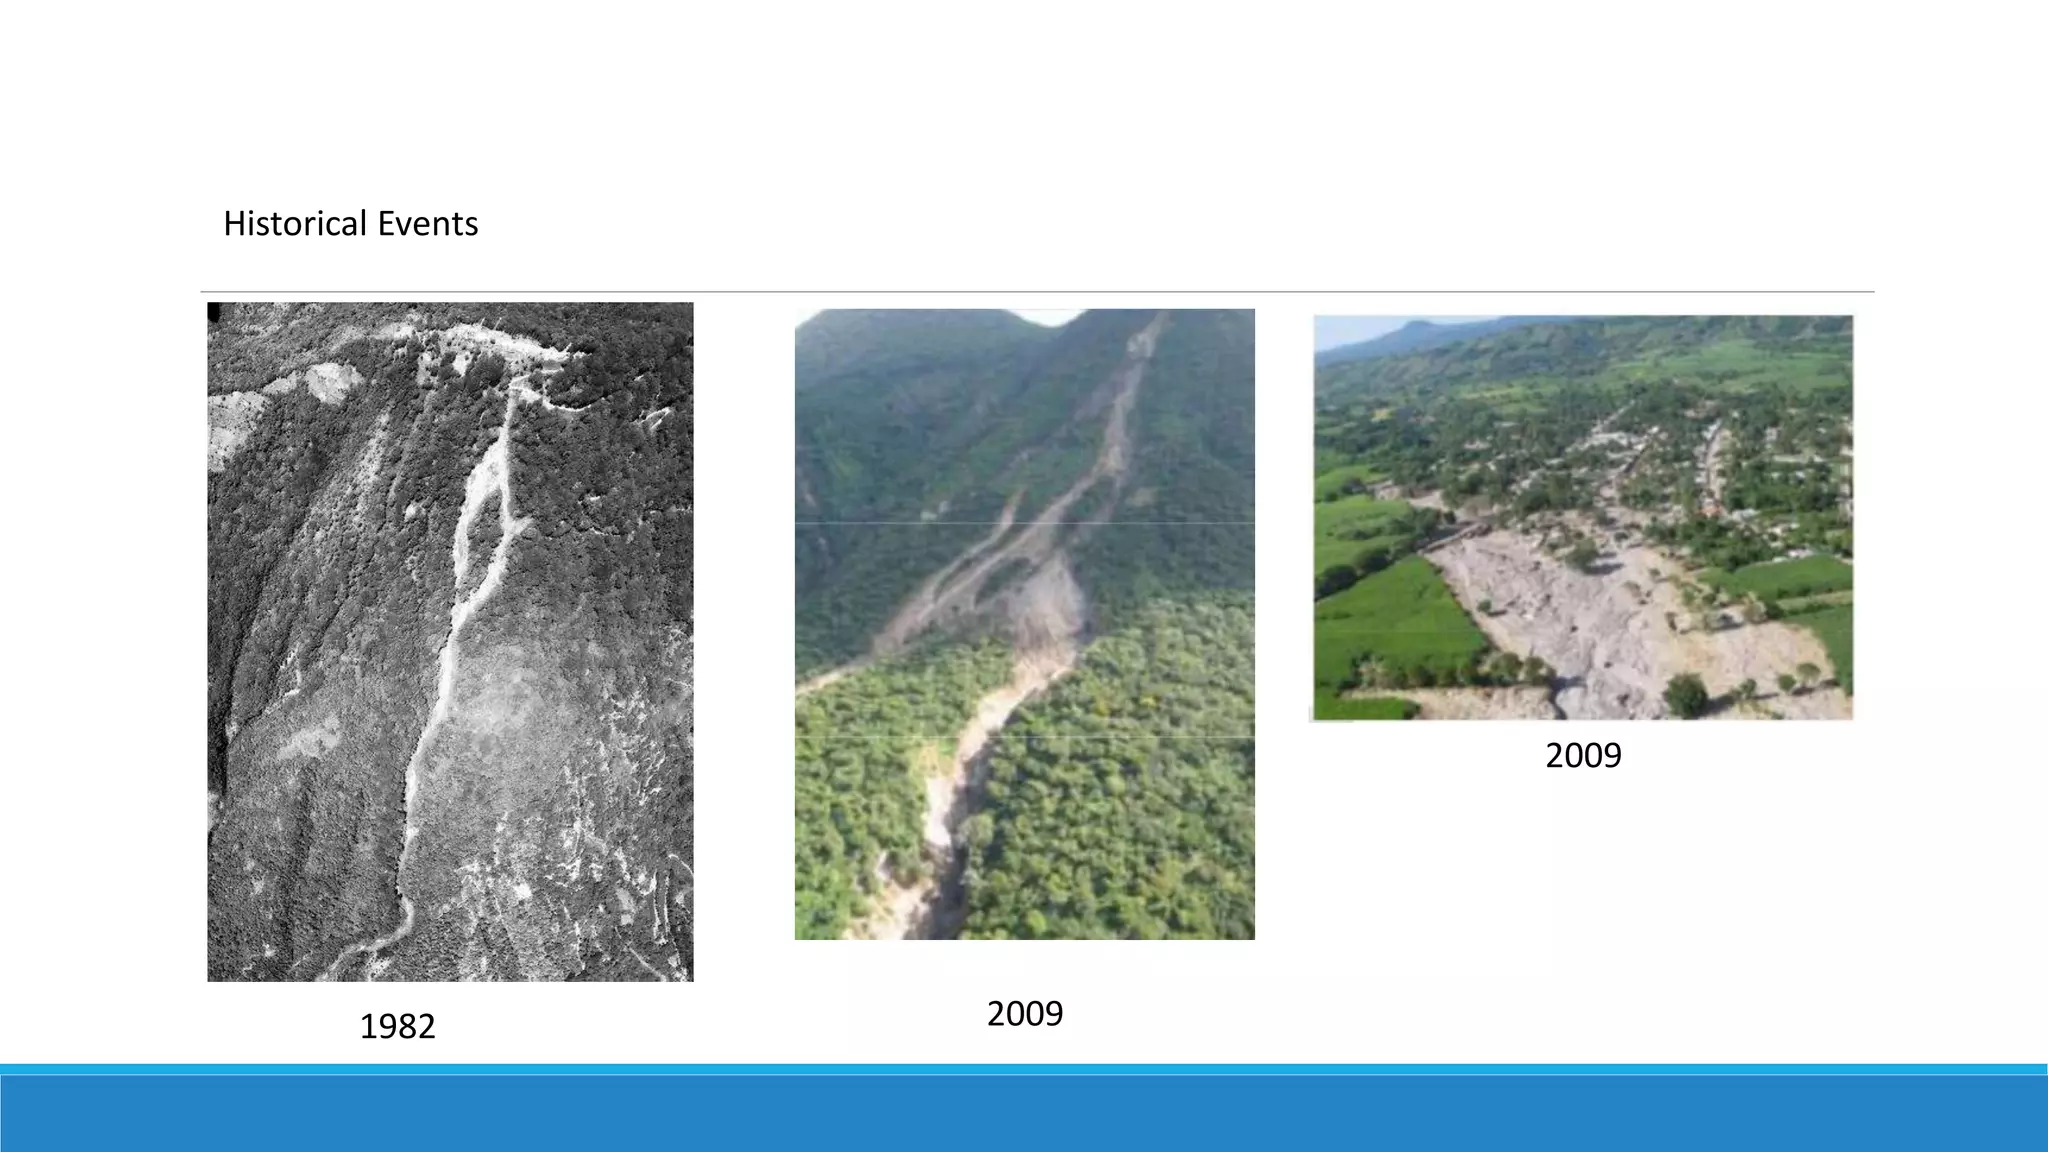

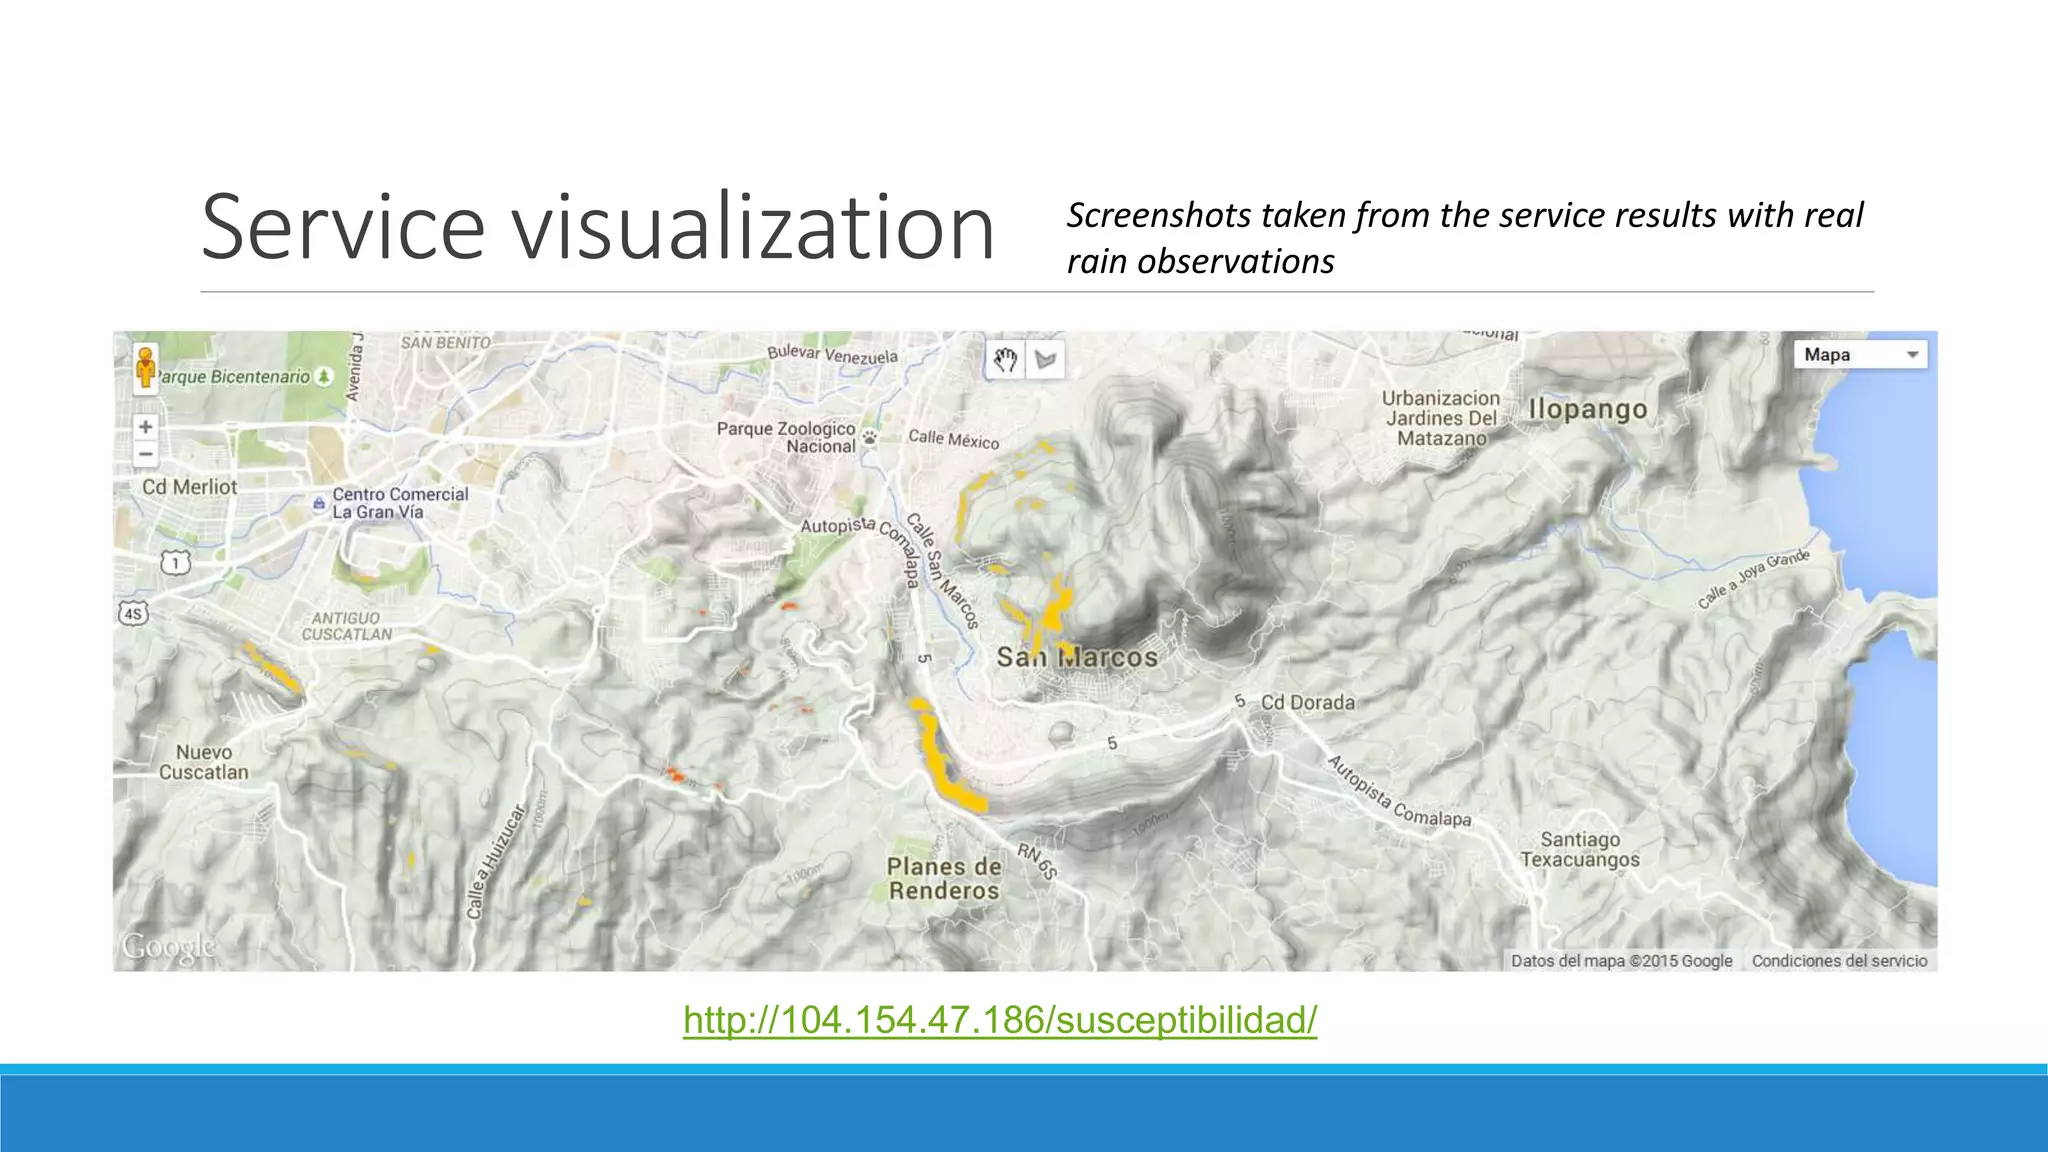
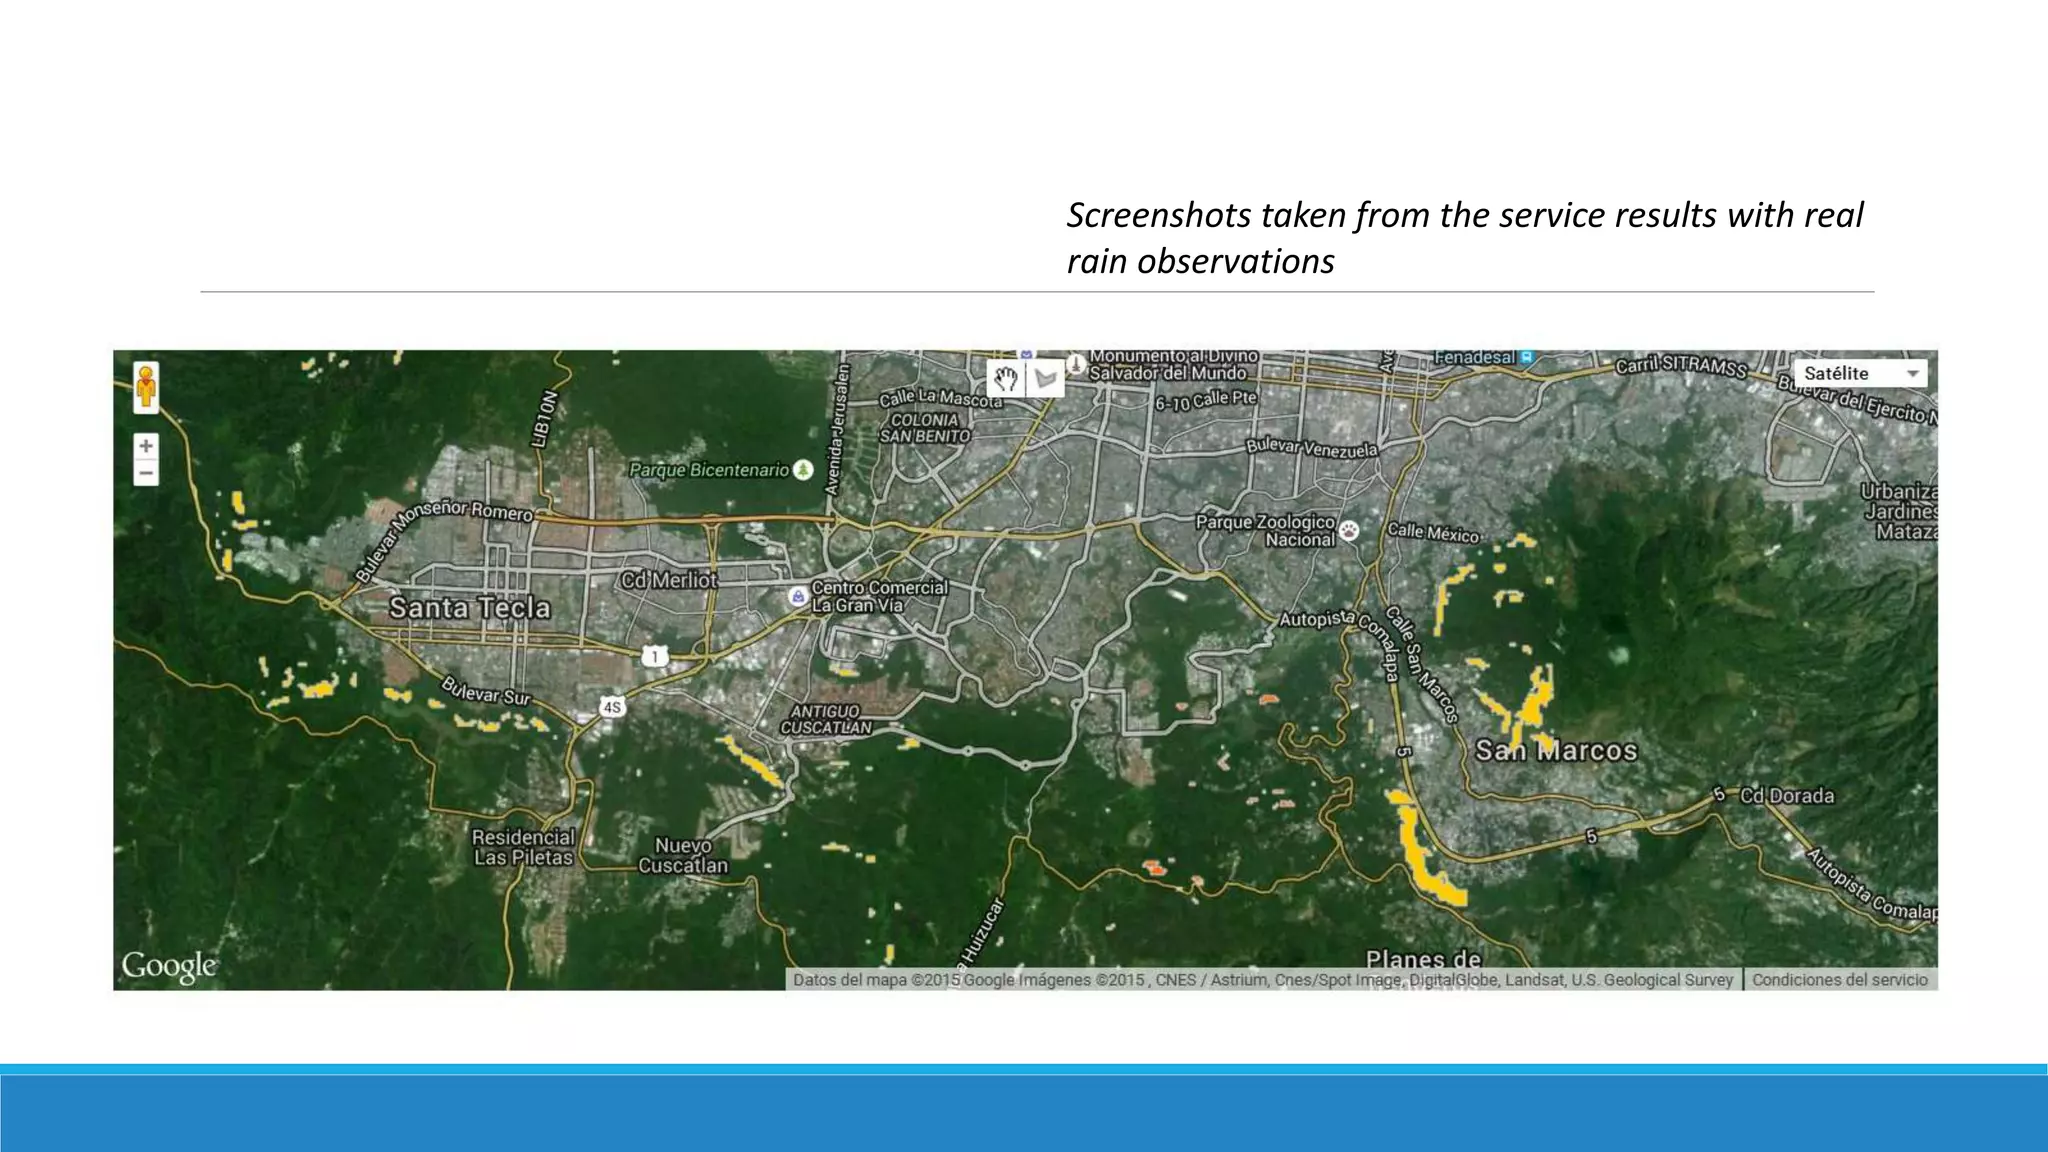
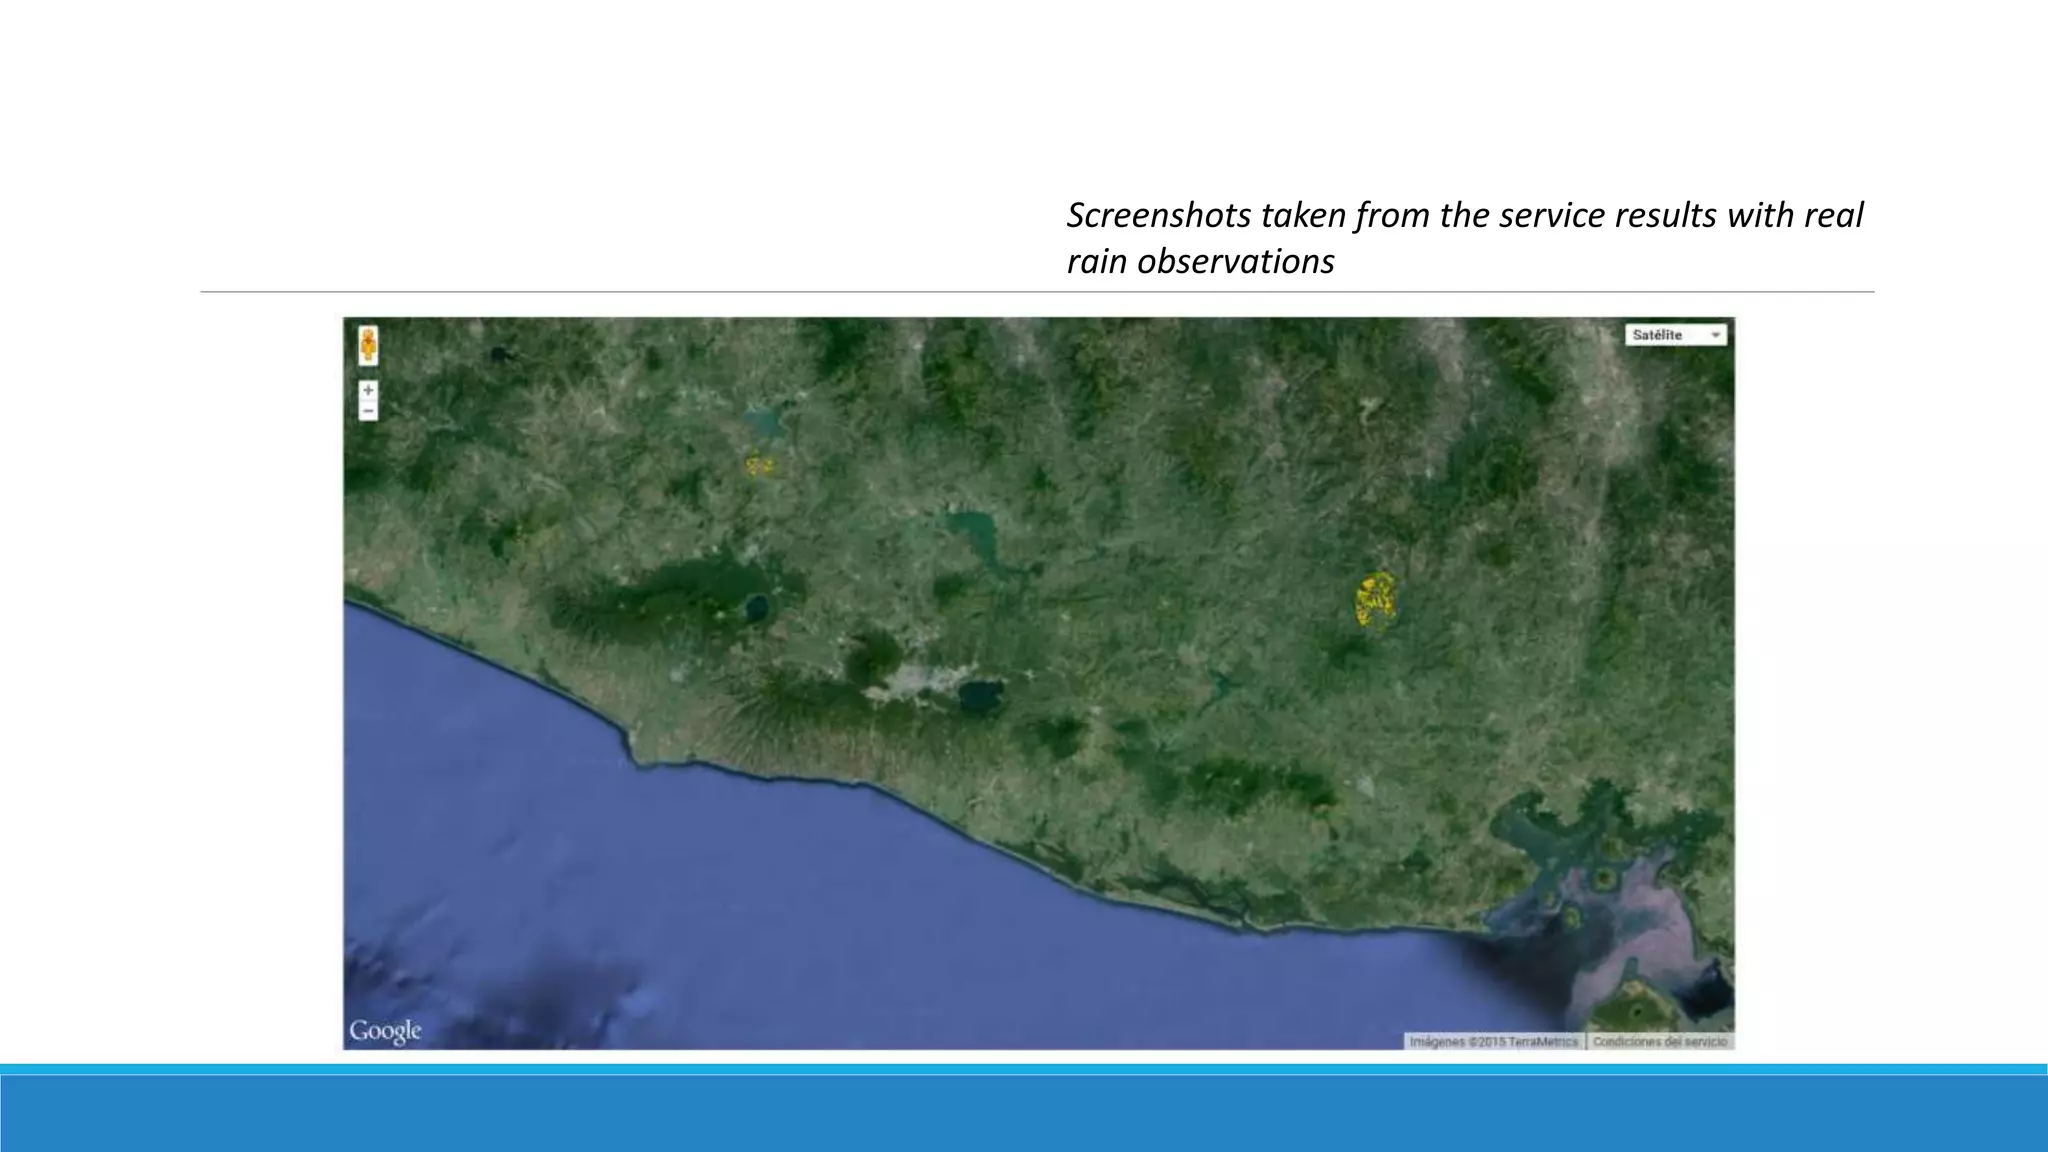
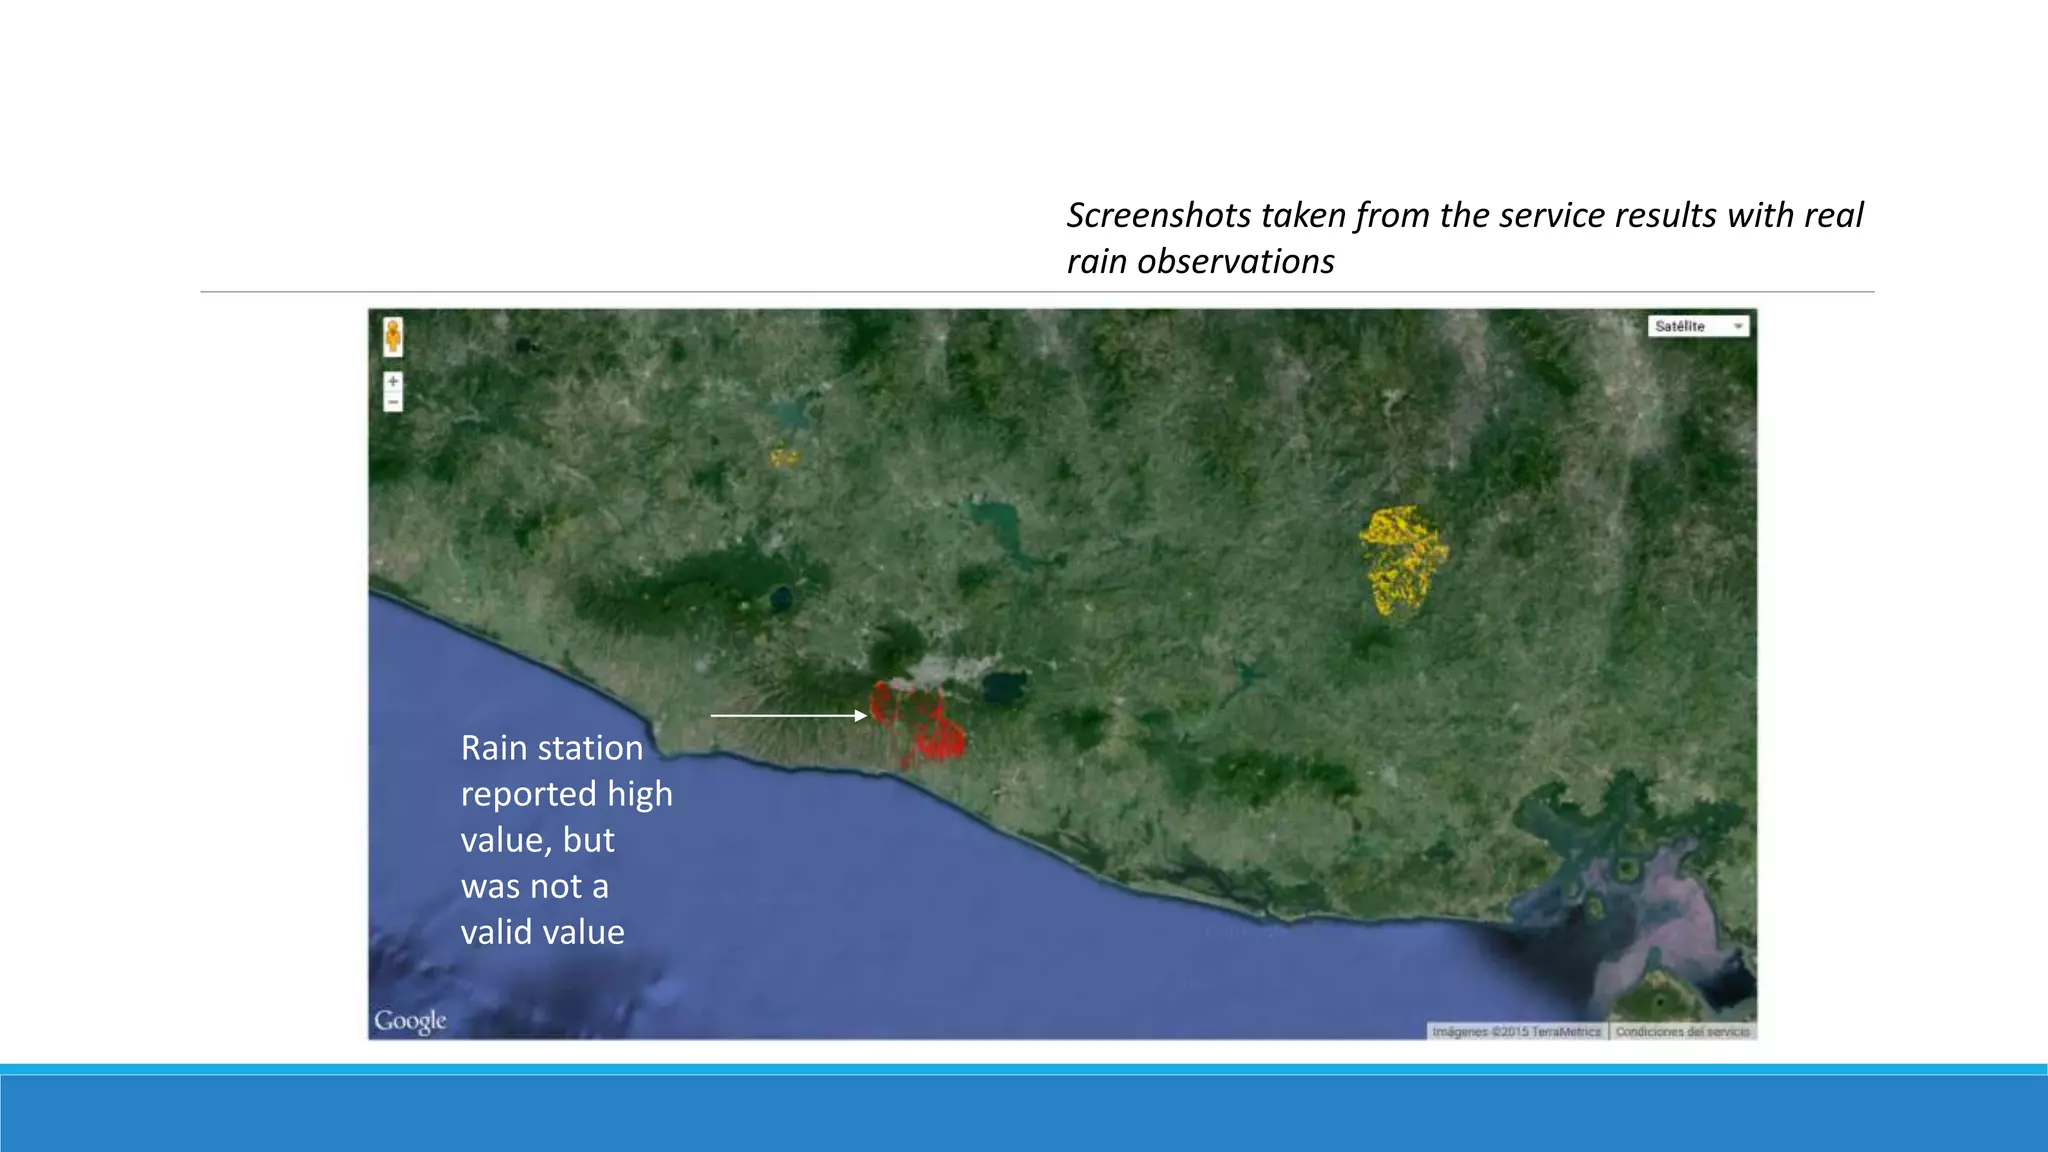
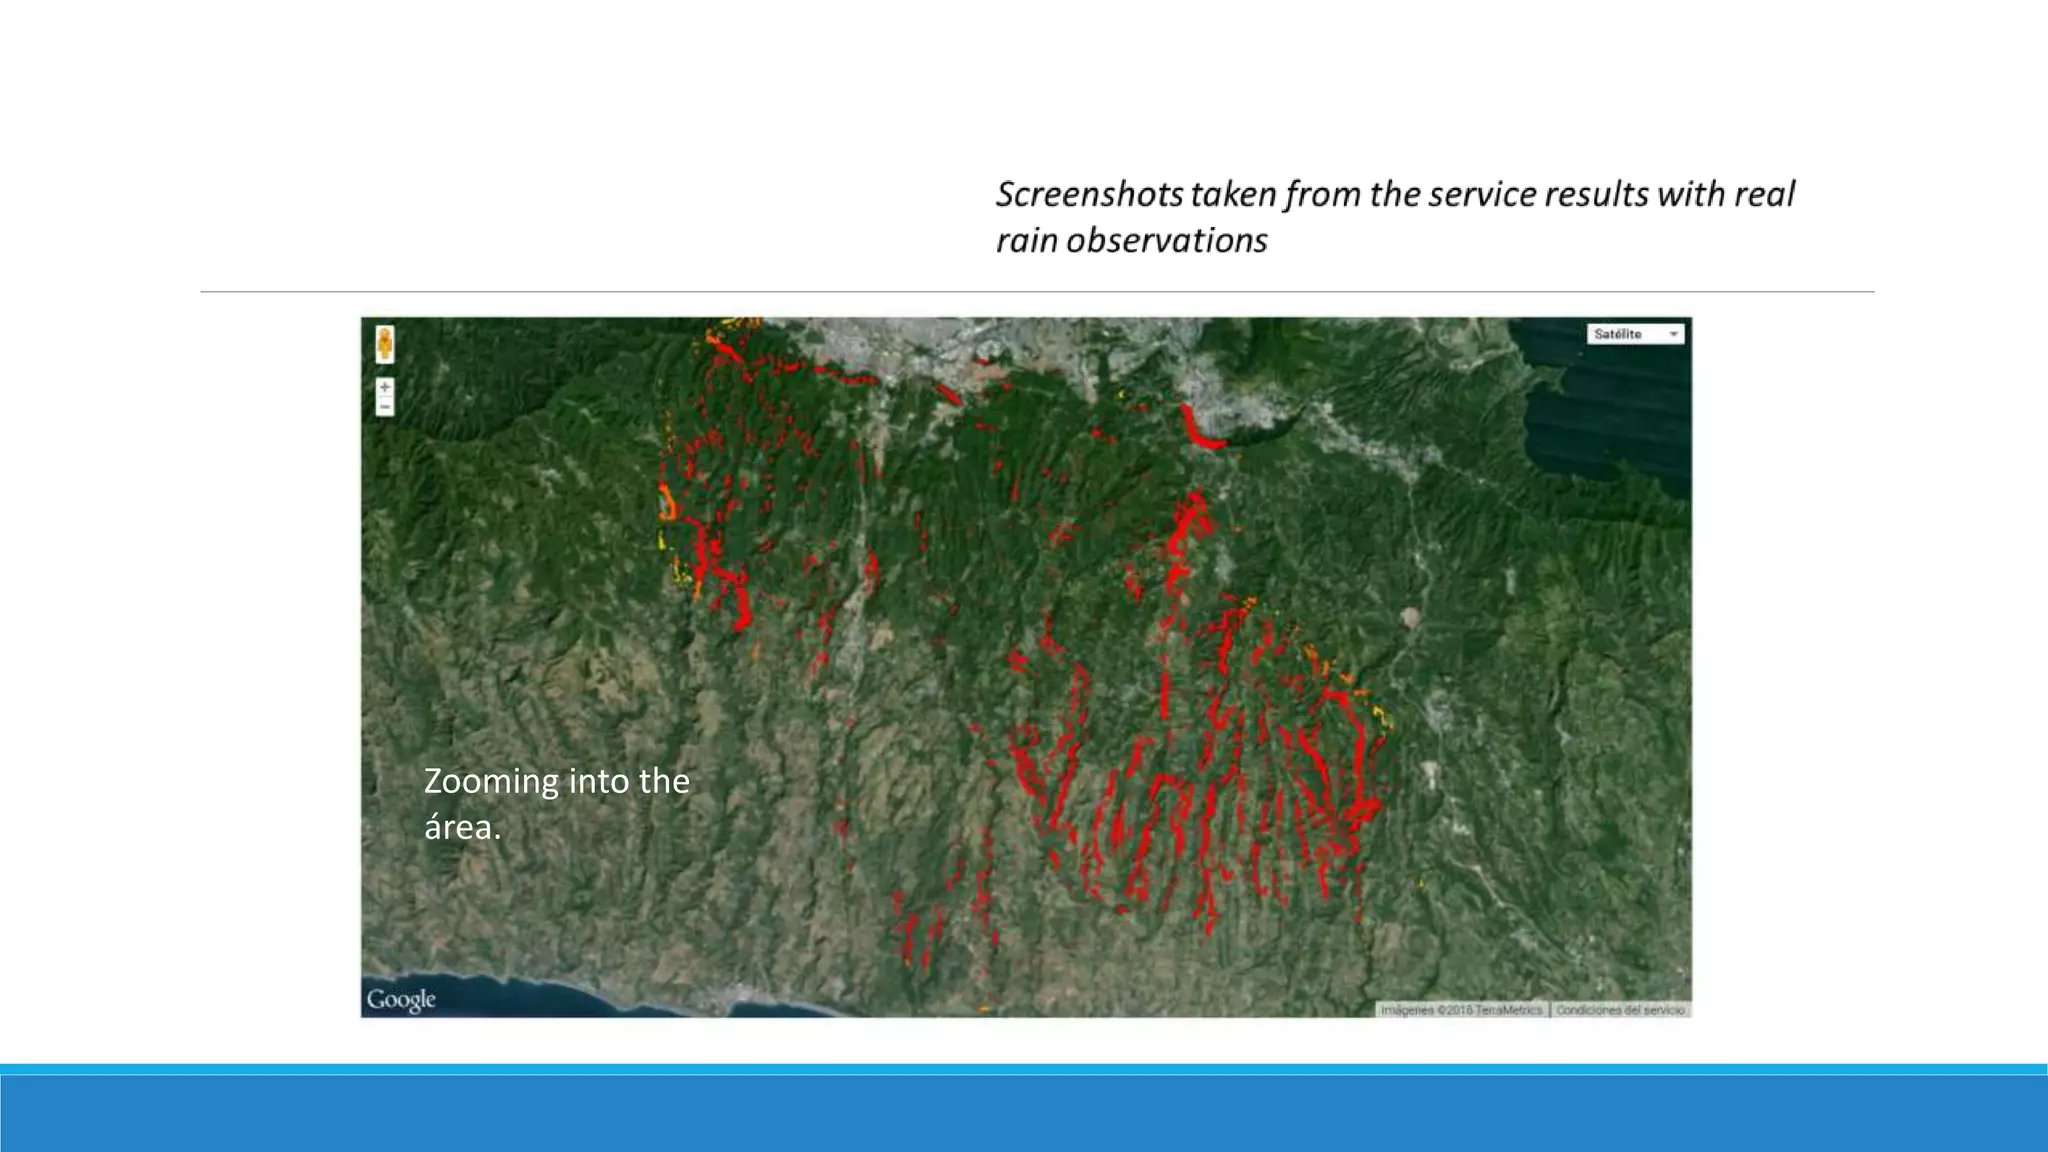
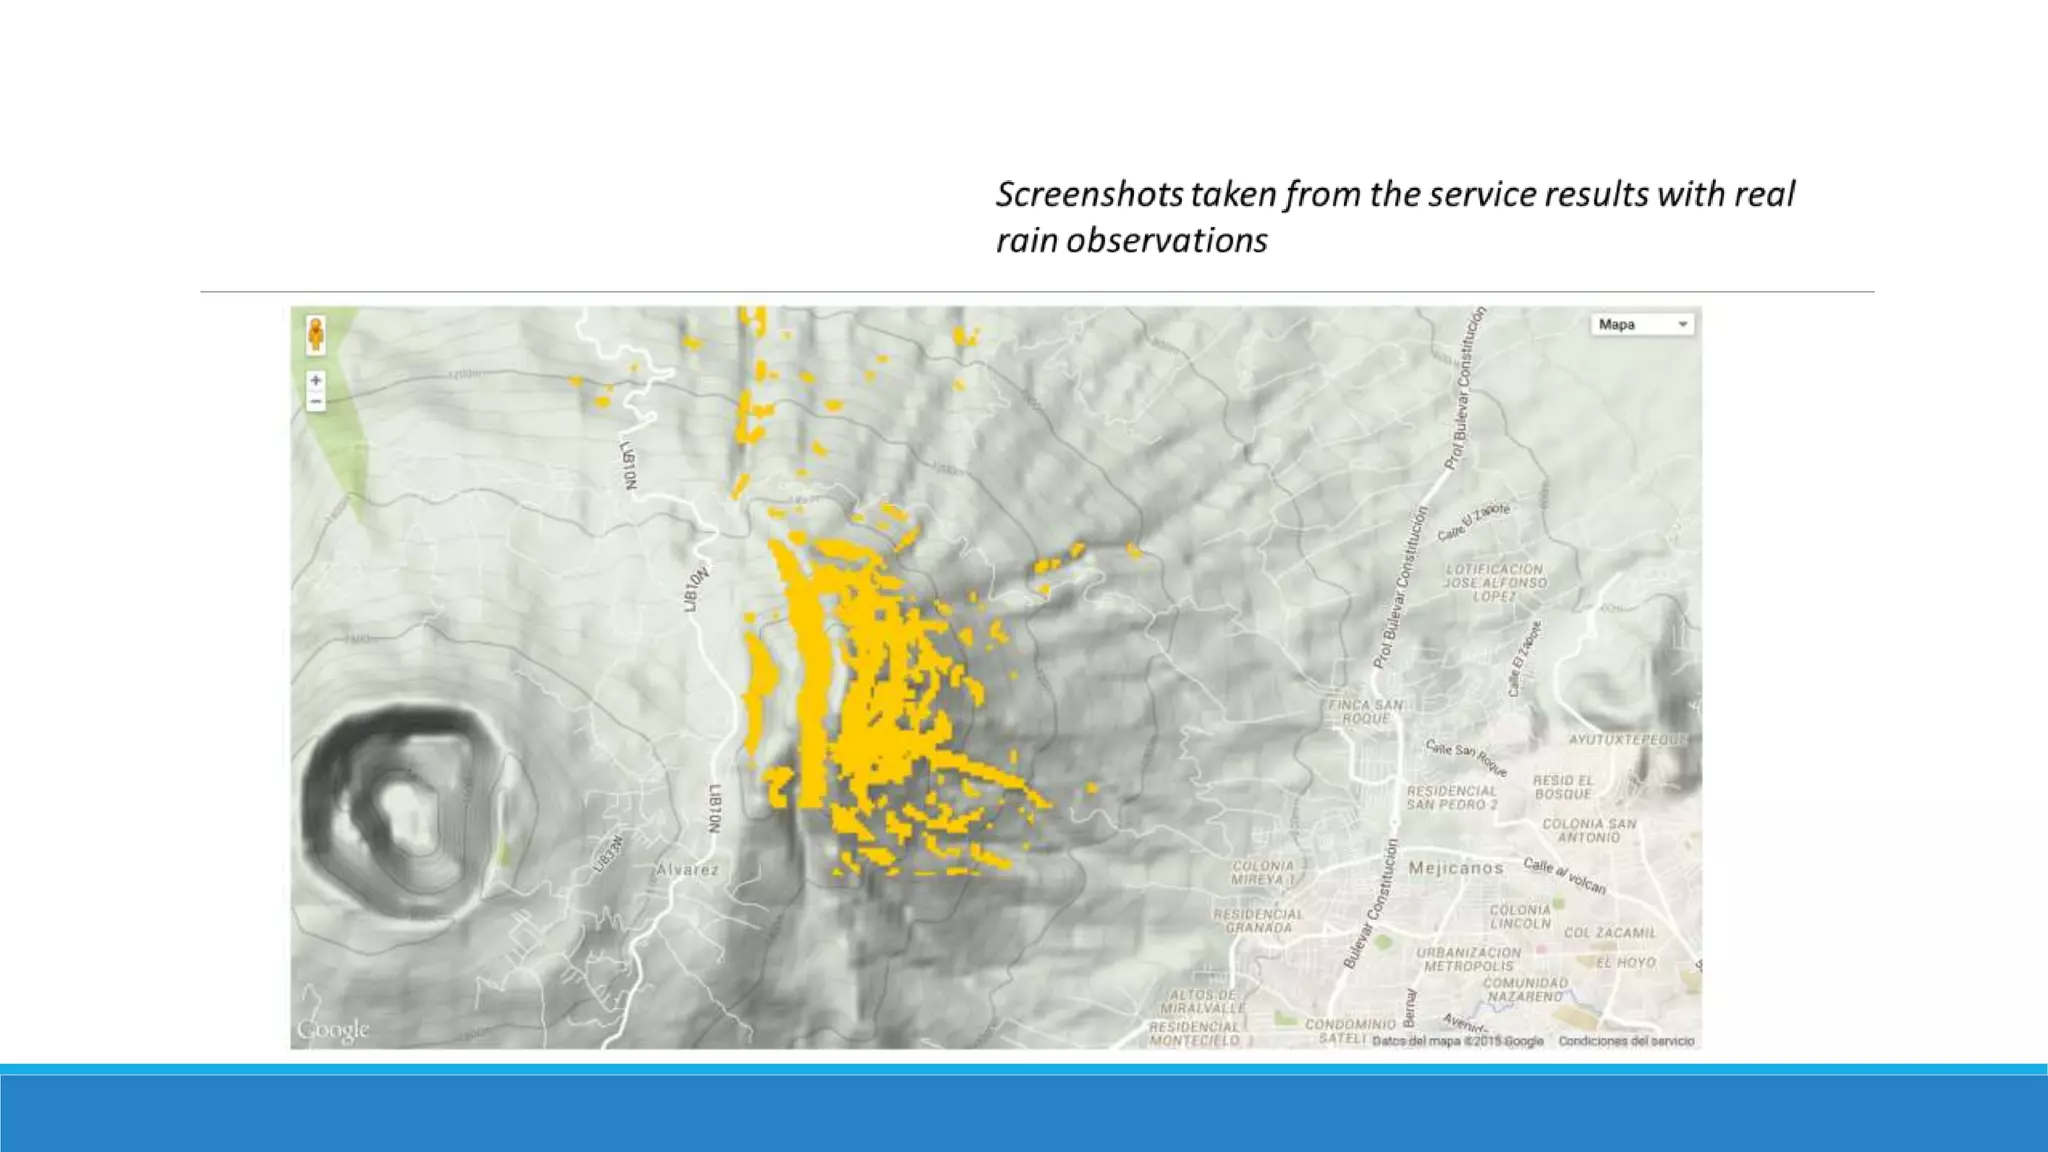
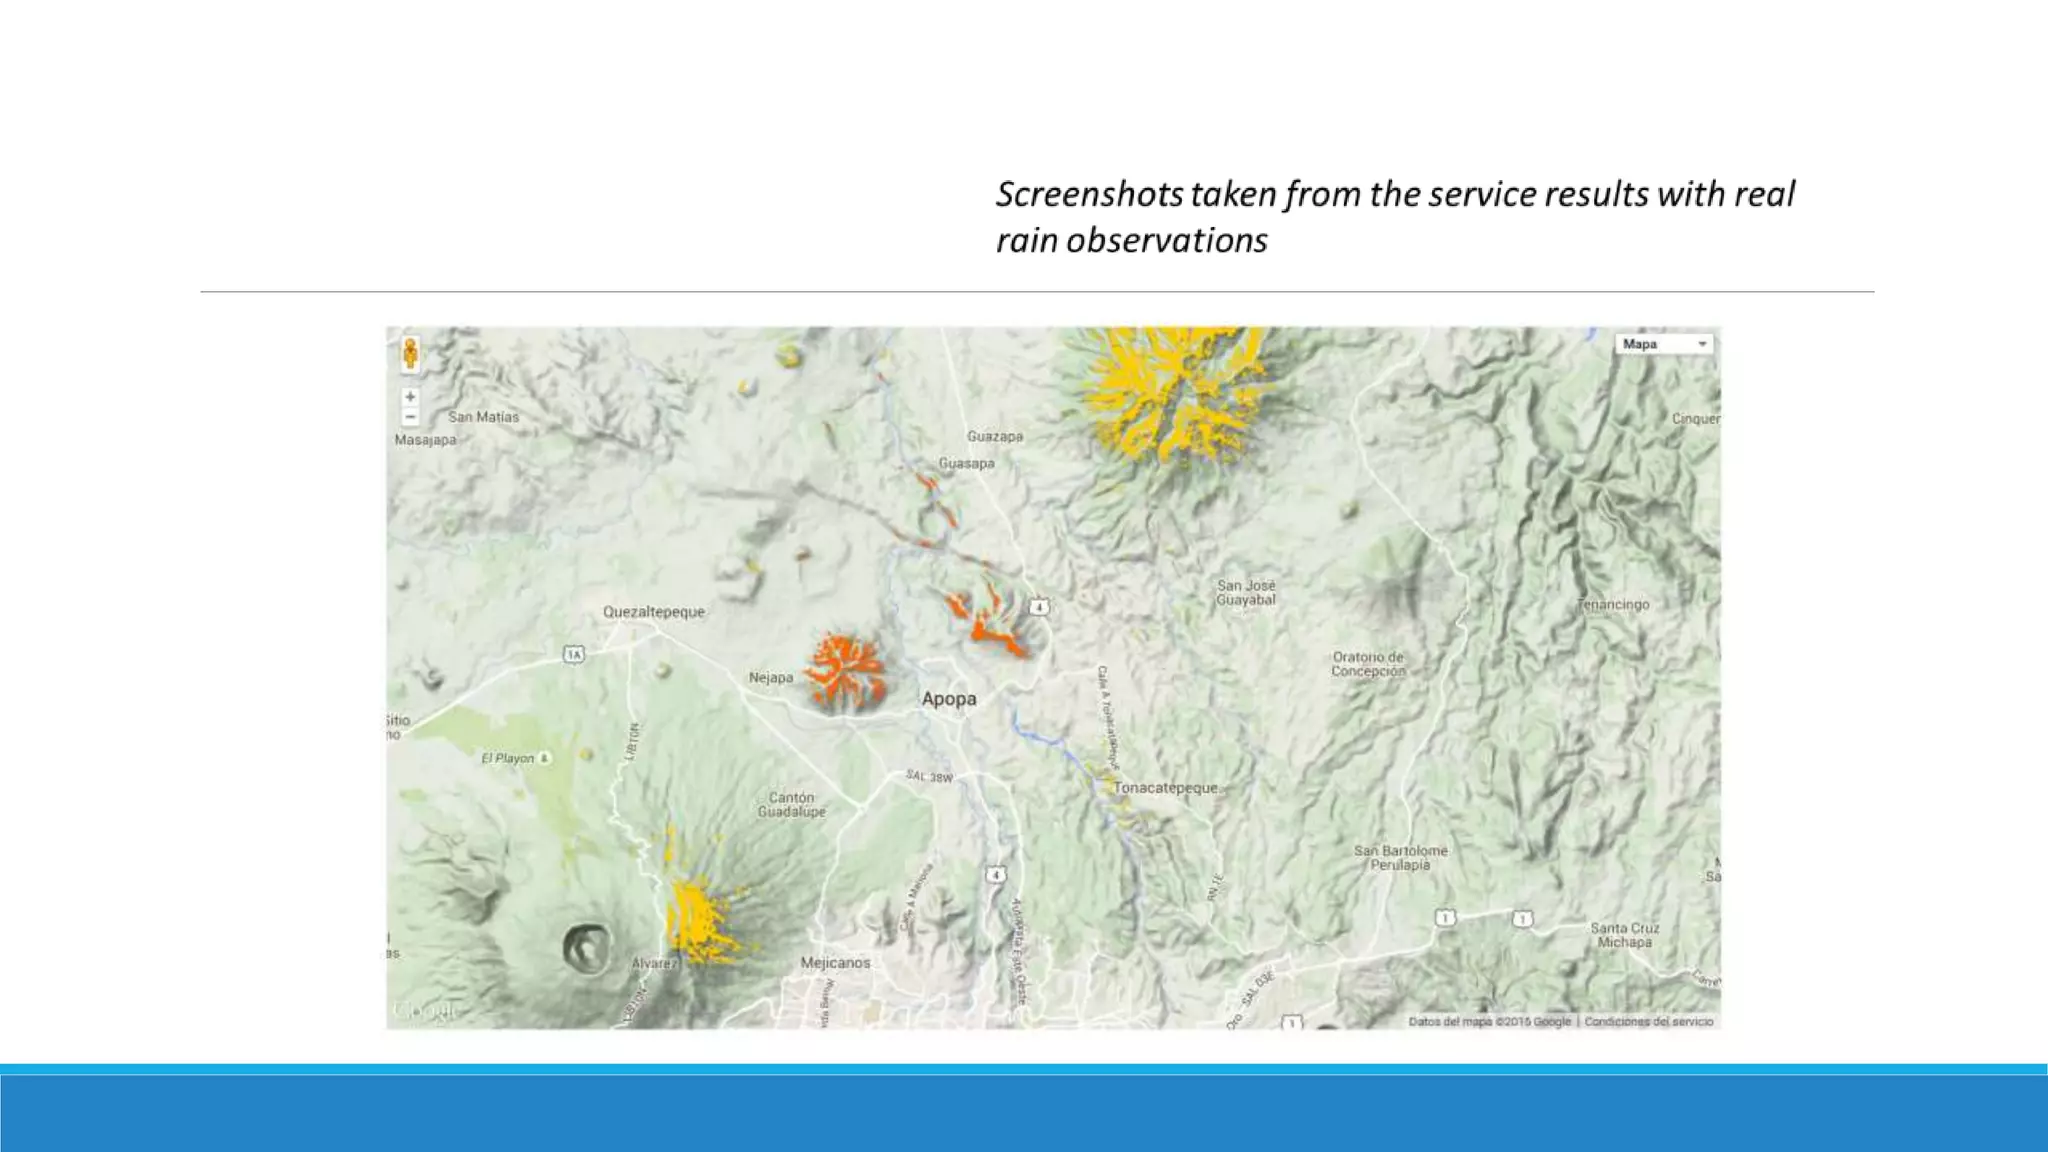
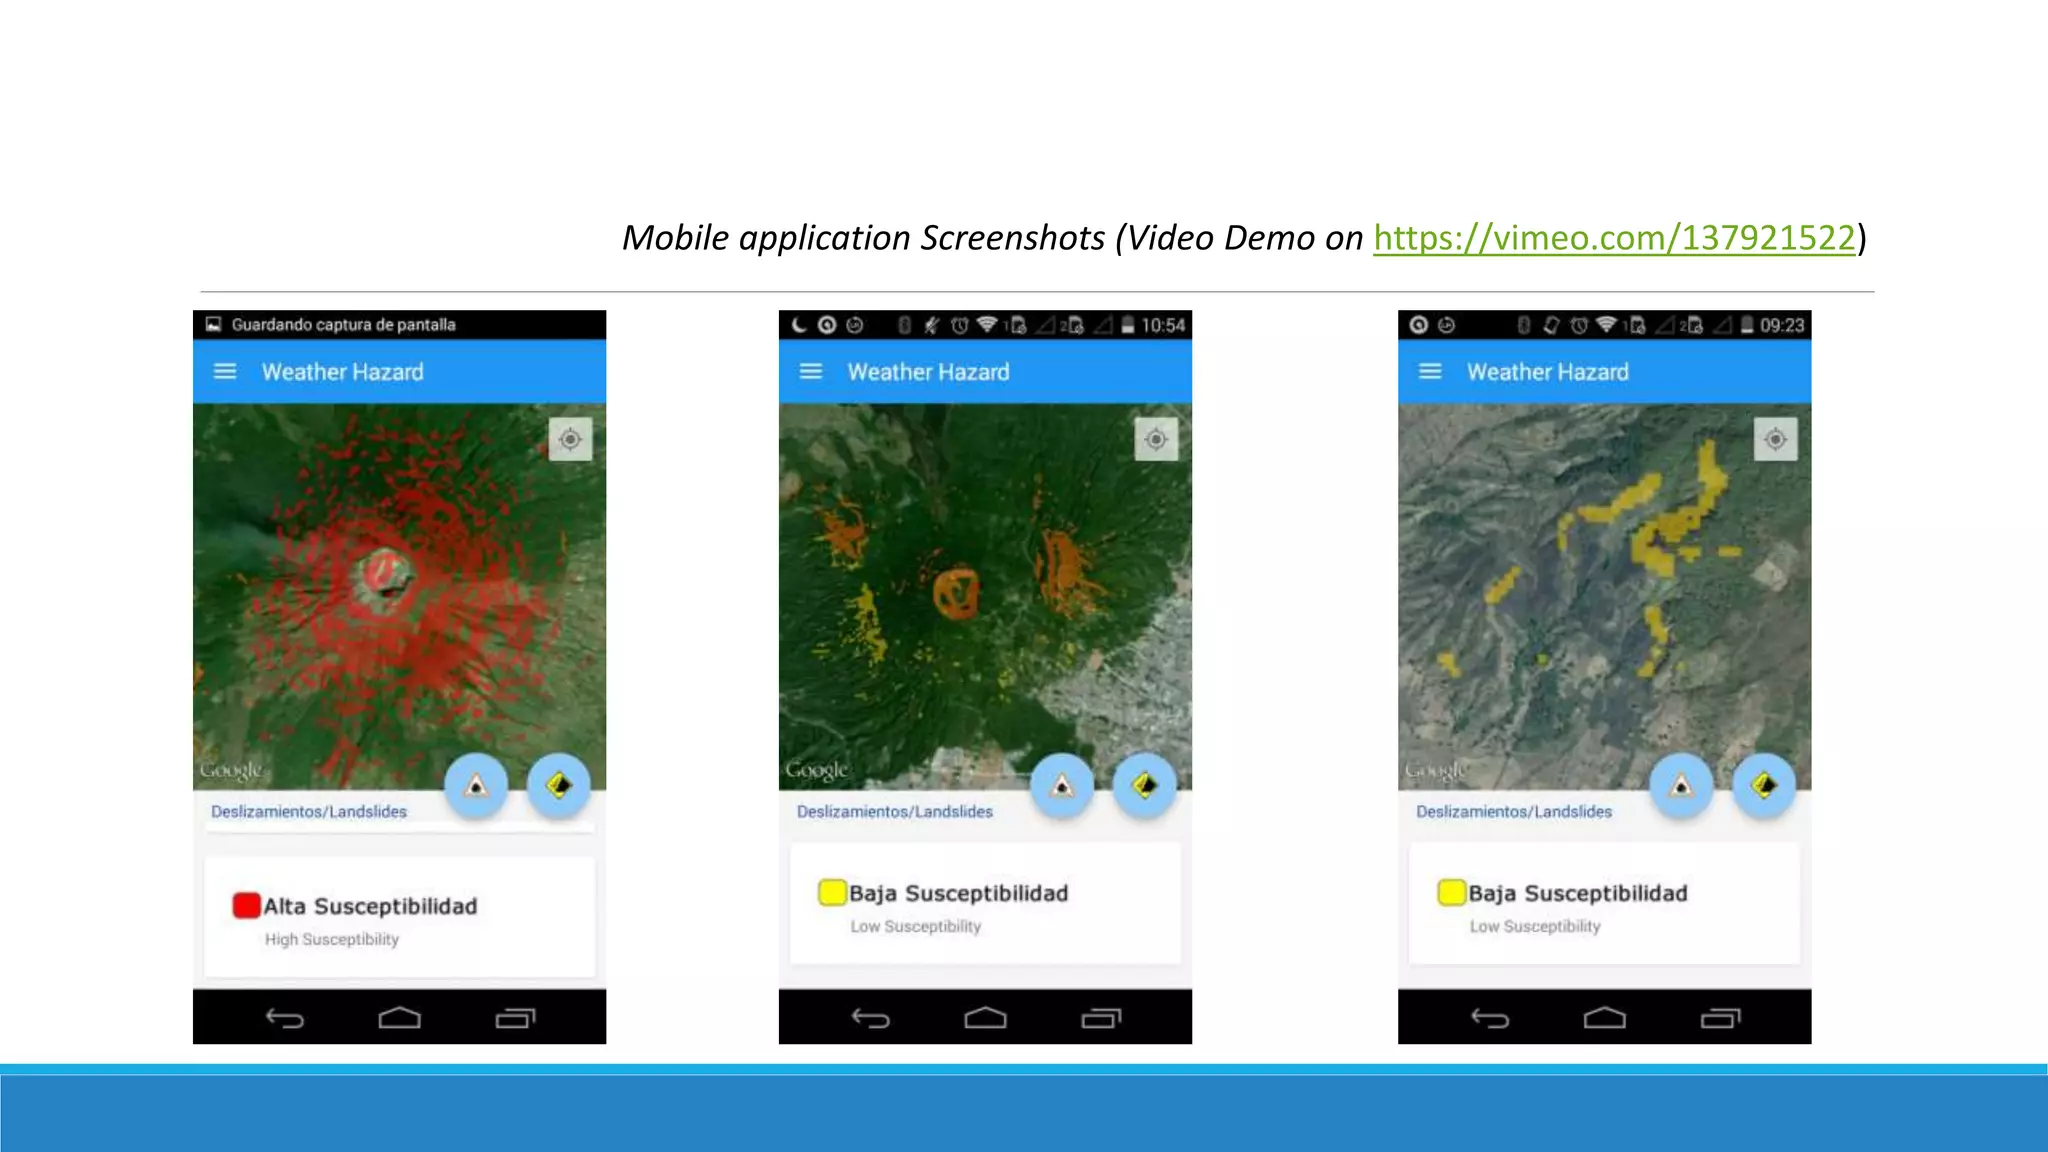
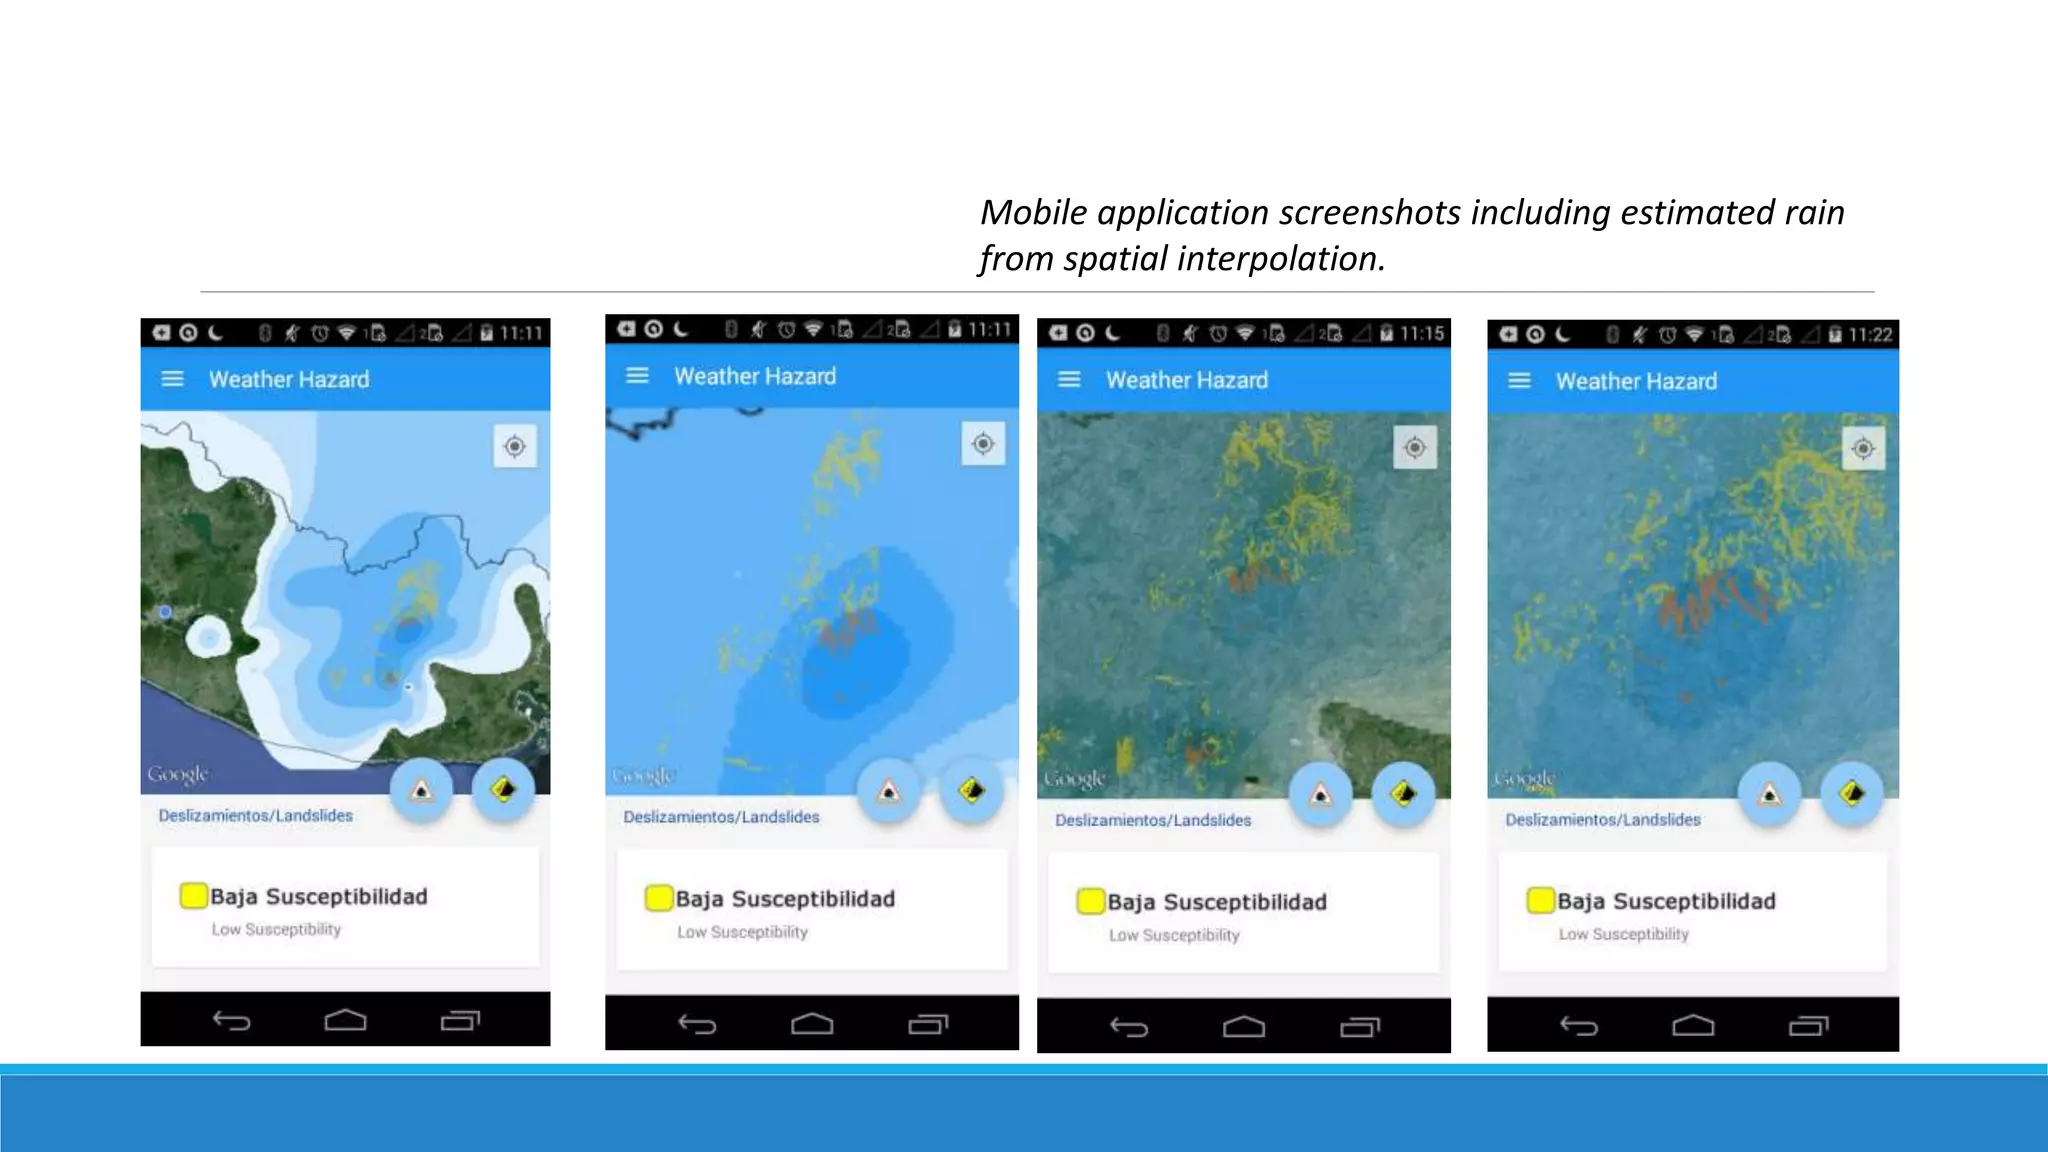

This document describes the development of a GIS service using CloudEO Platform data and tools to visualize areas in El Salvador that have a higher susceptibility to landslides based on slope, rainfall data, and historical landslide events, with the goal of providing early warning systems that are accessible via mobile, desktop, and web applications. The process involves collecting and interpolating rainfall observations, reclassifying the data according to warning levels, and intersecting it with pre-generated slope data to identify at-risk areas. Screenshots from the service show maps highlighting susceptible regions based on real-time rainfall observations.