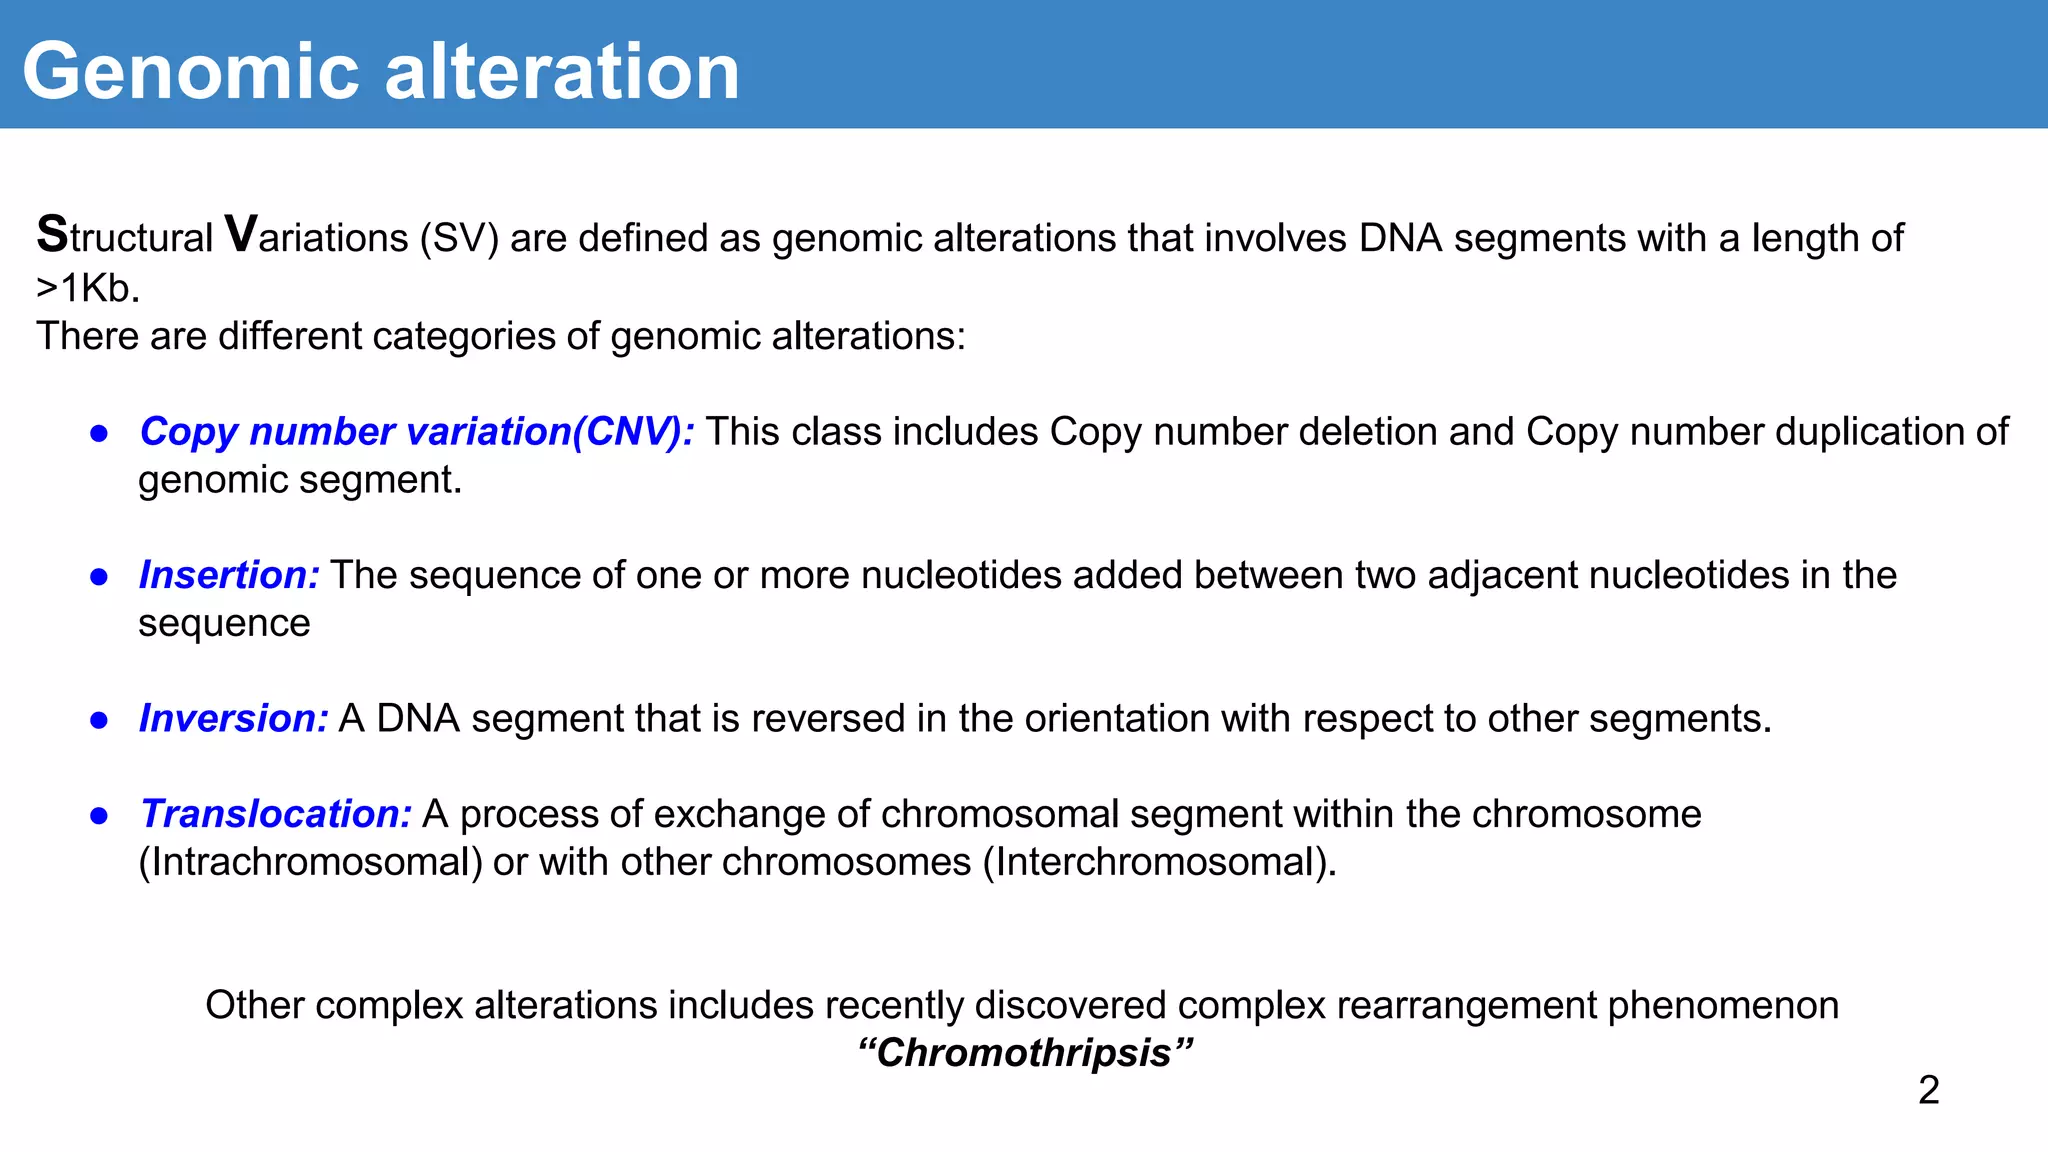
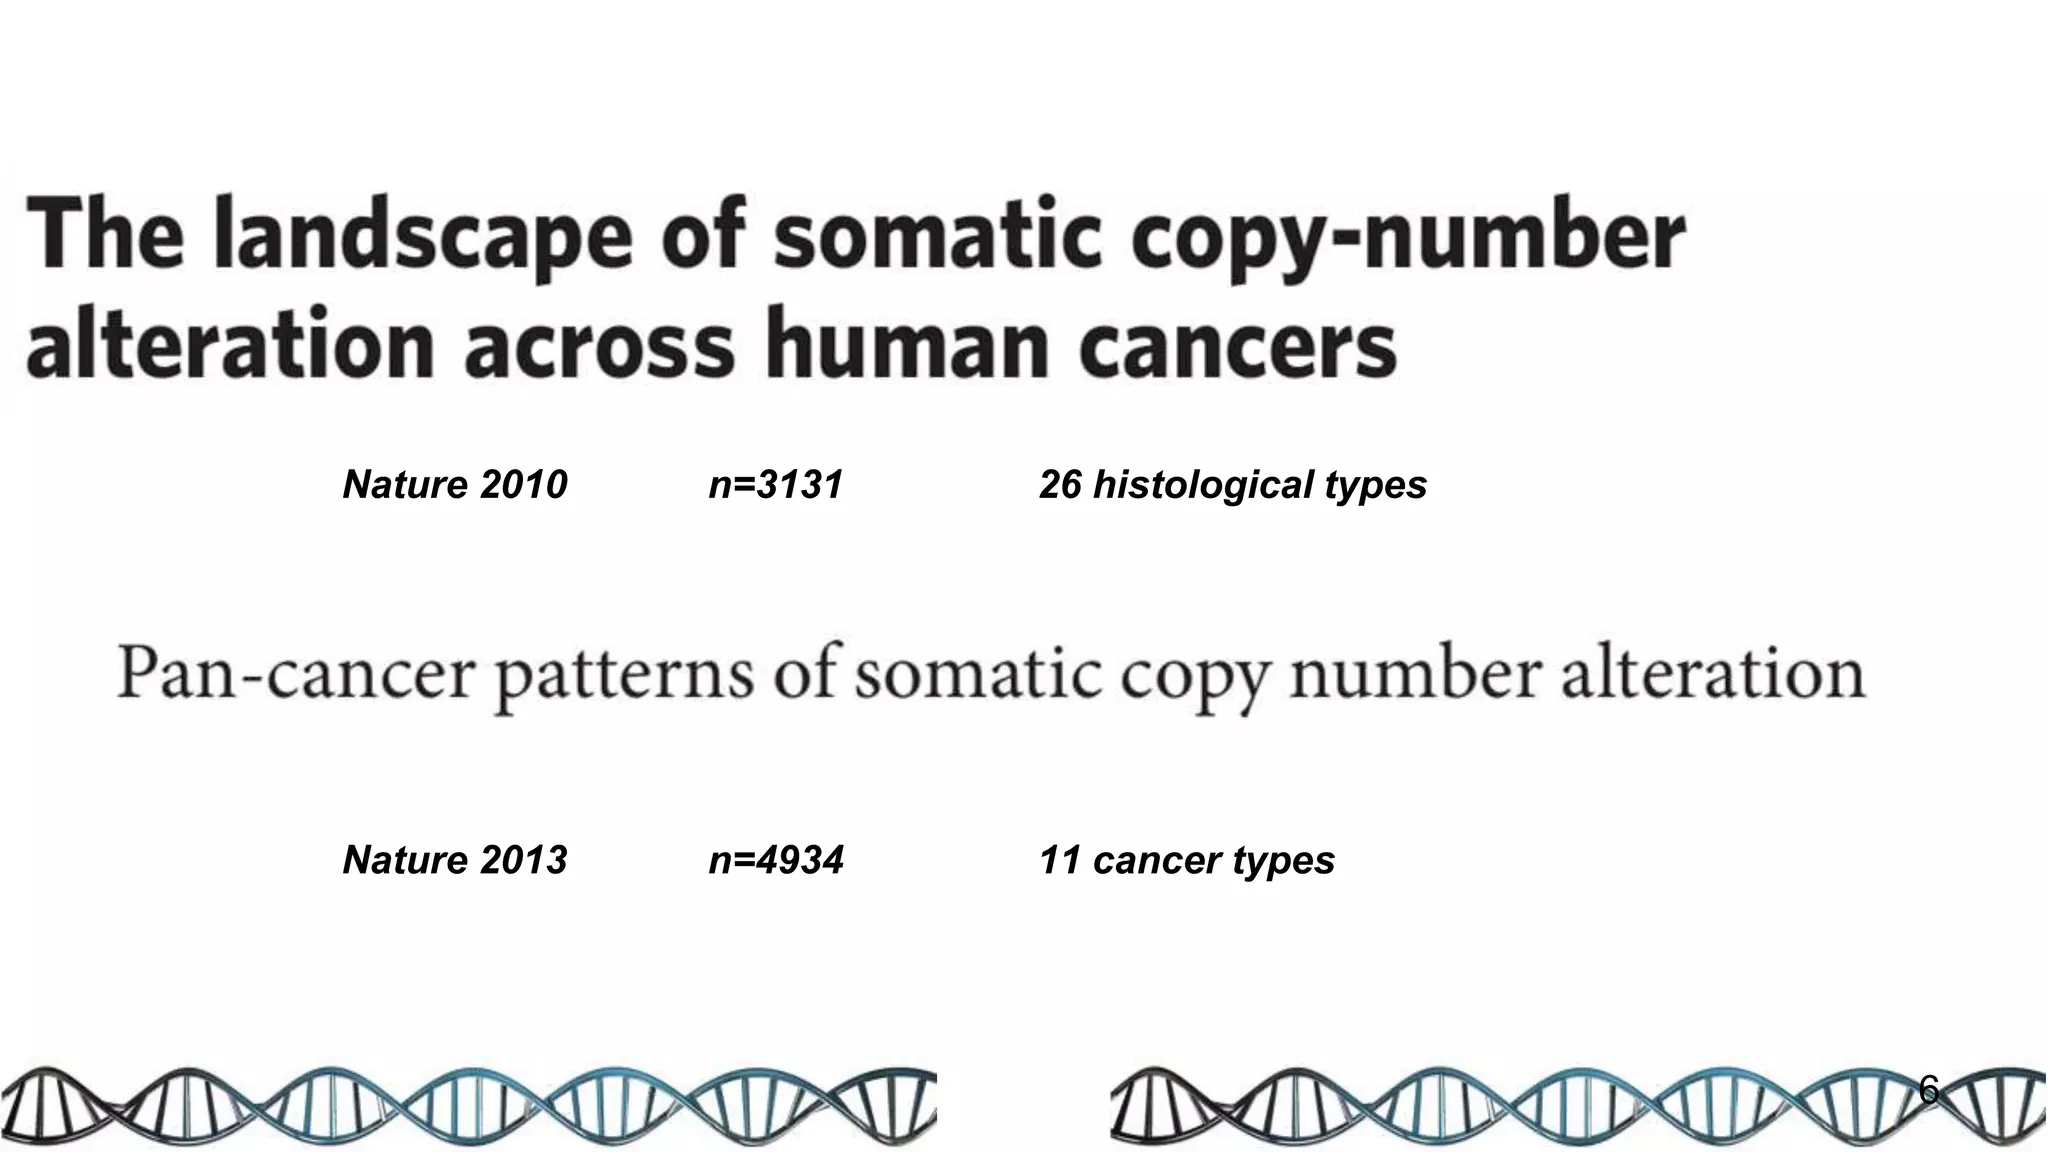
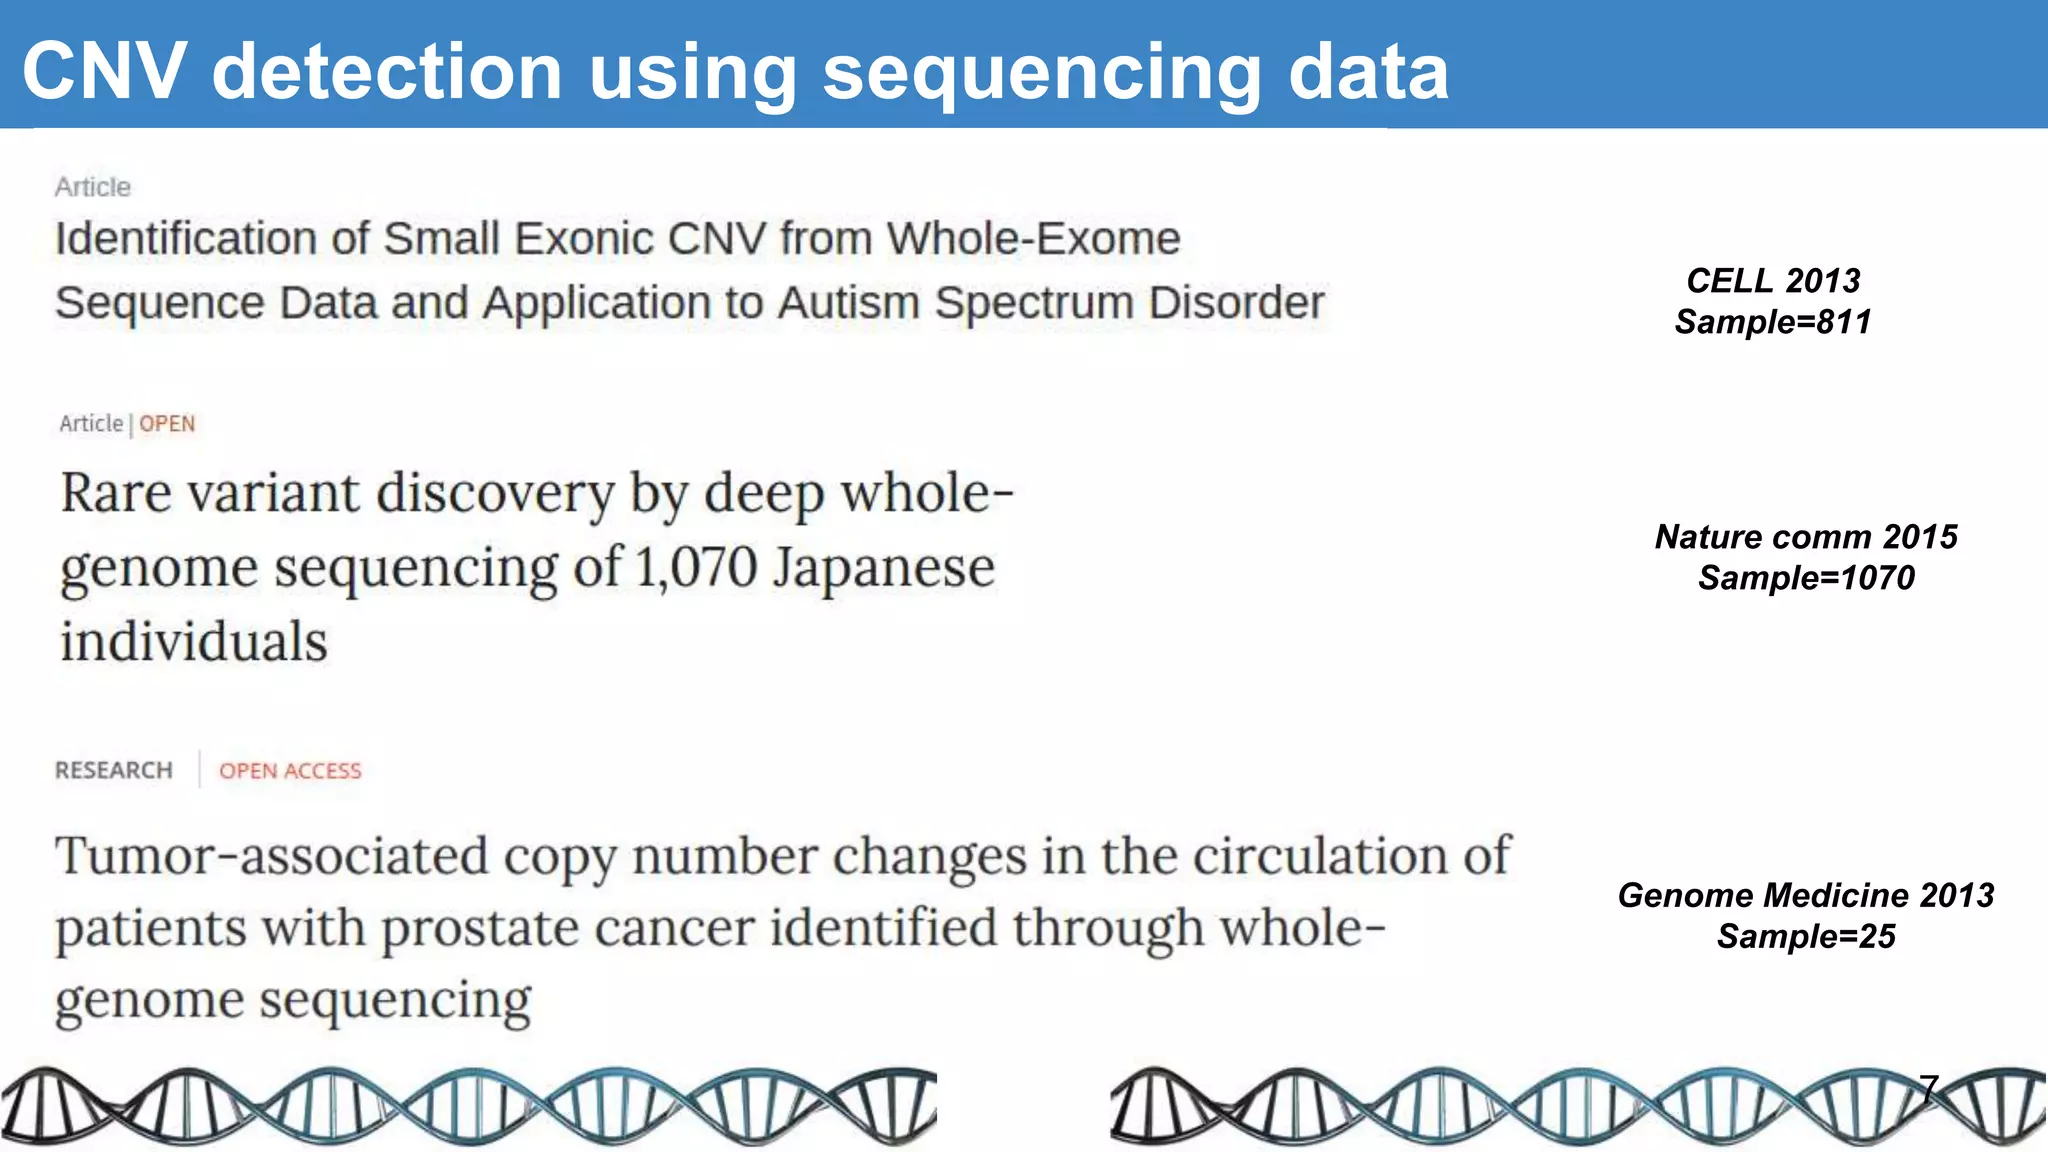
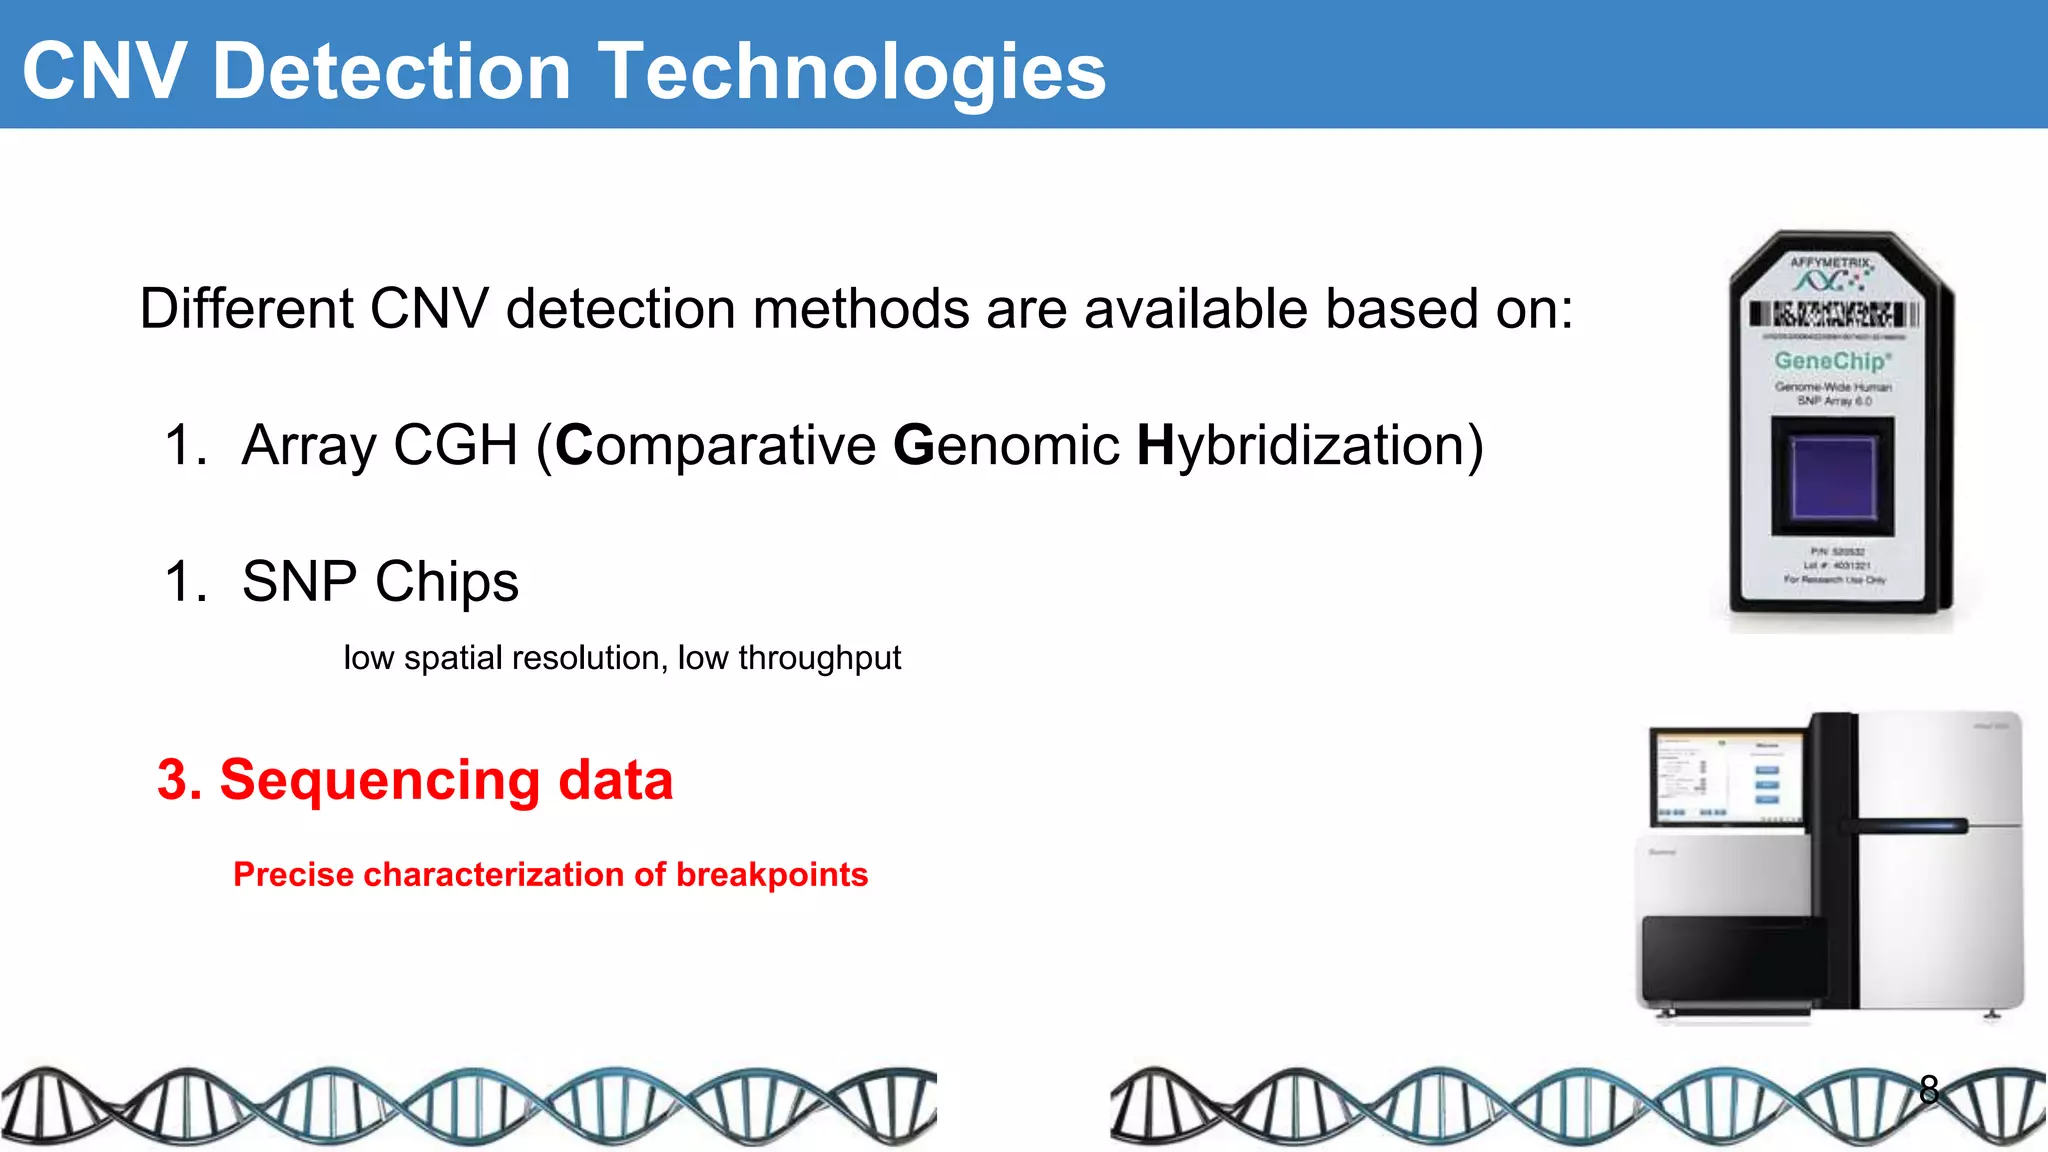
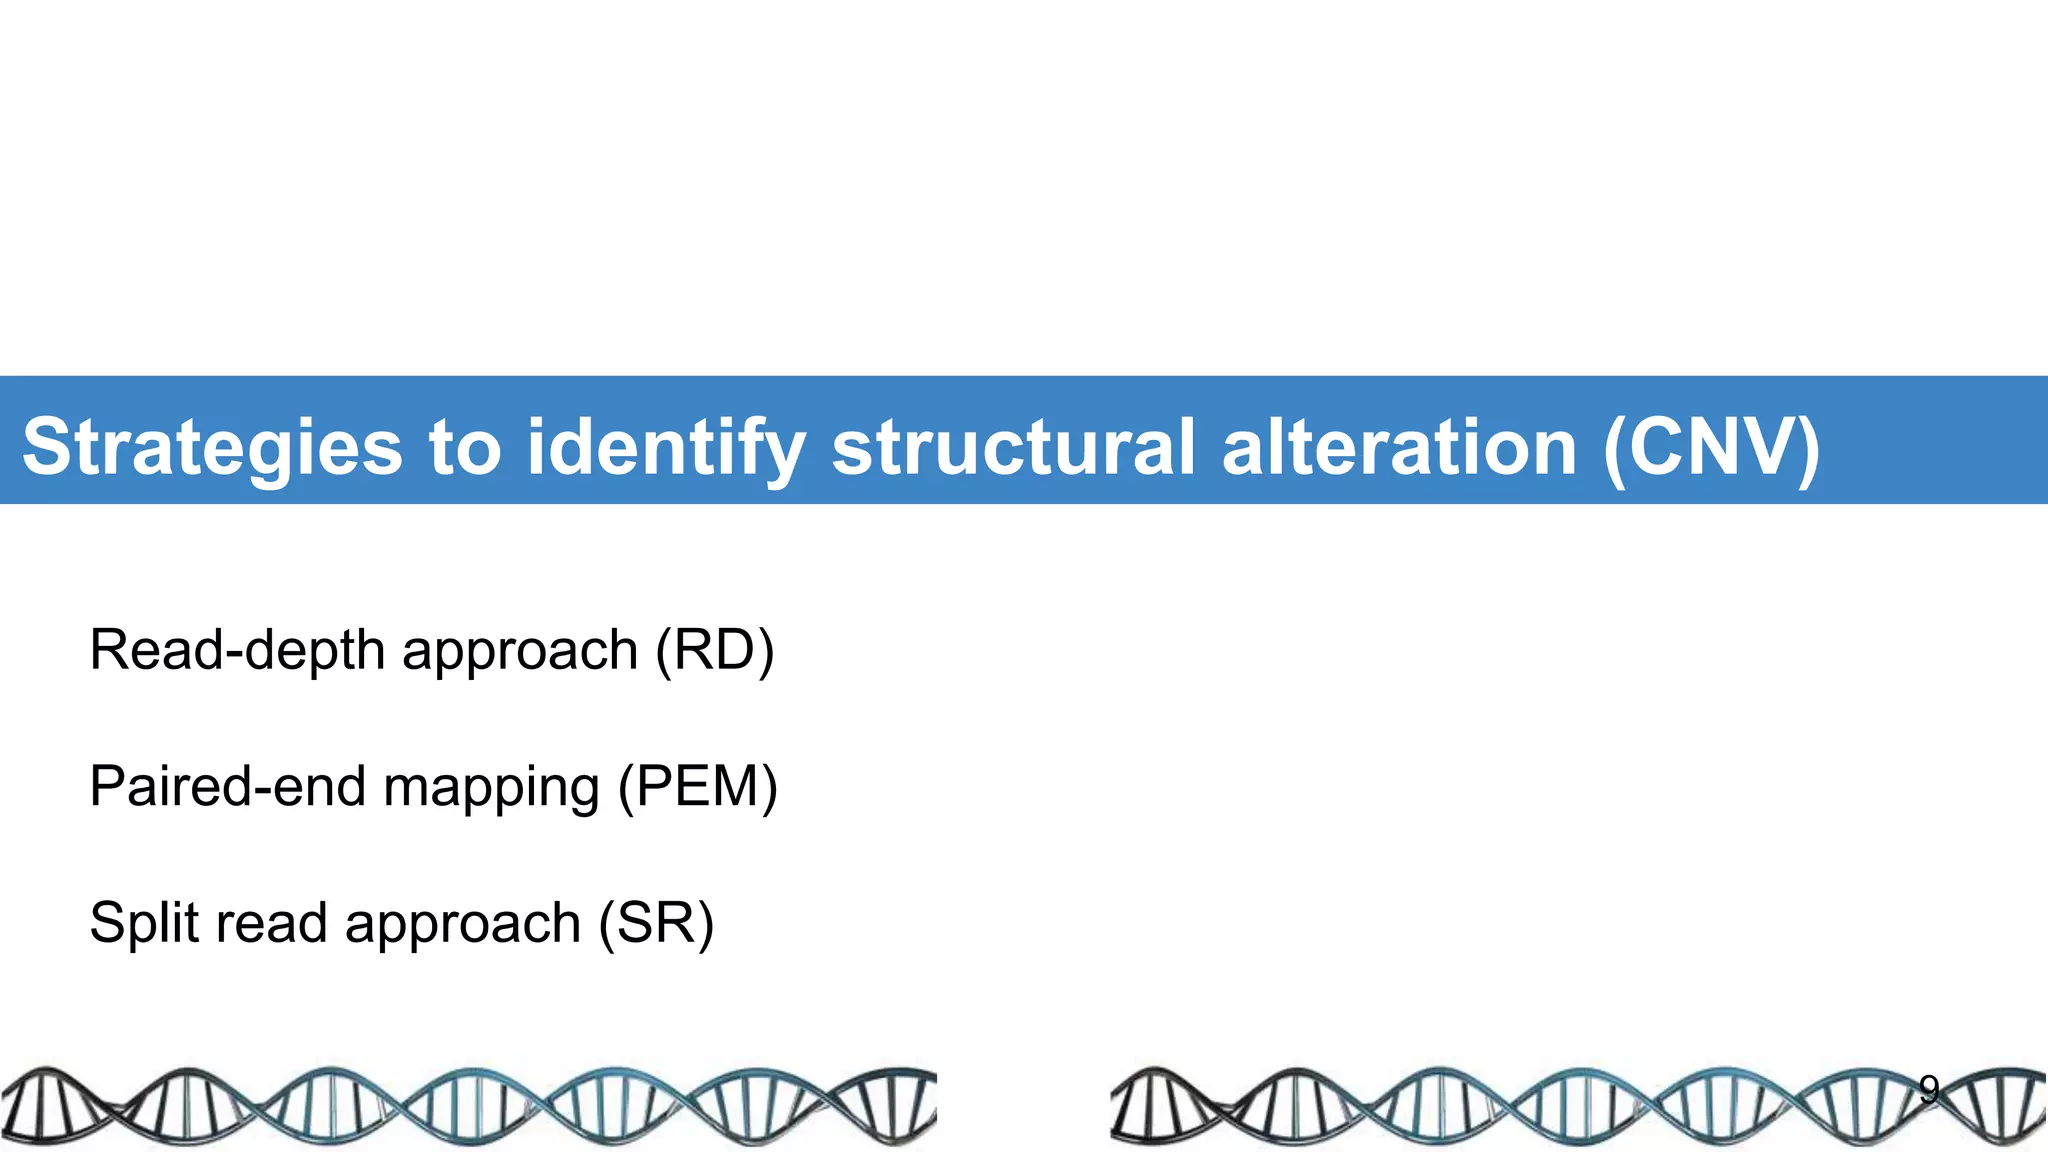
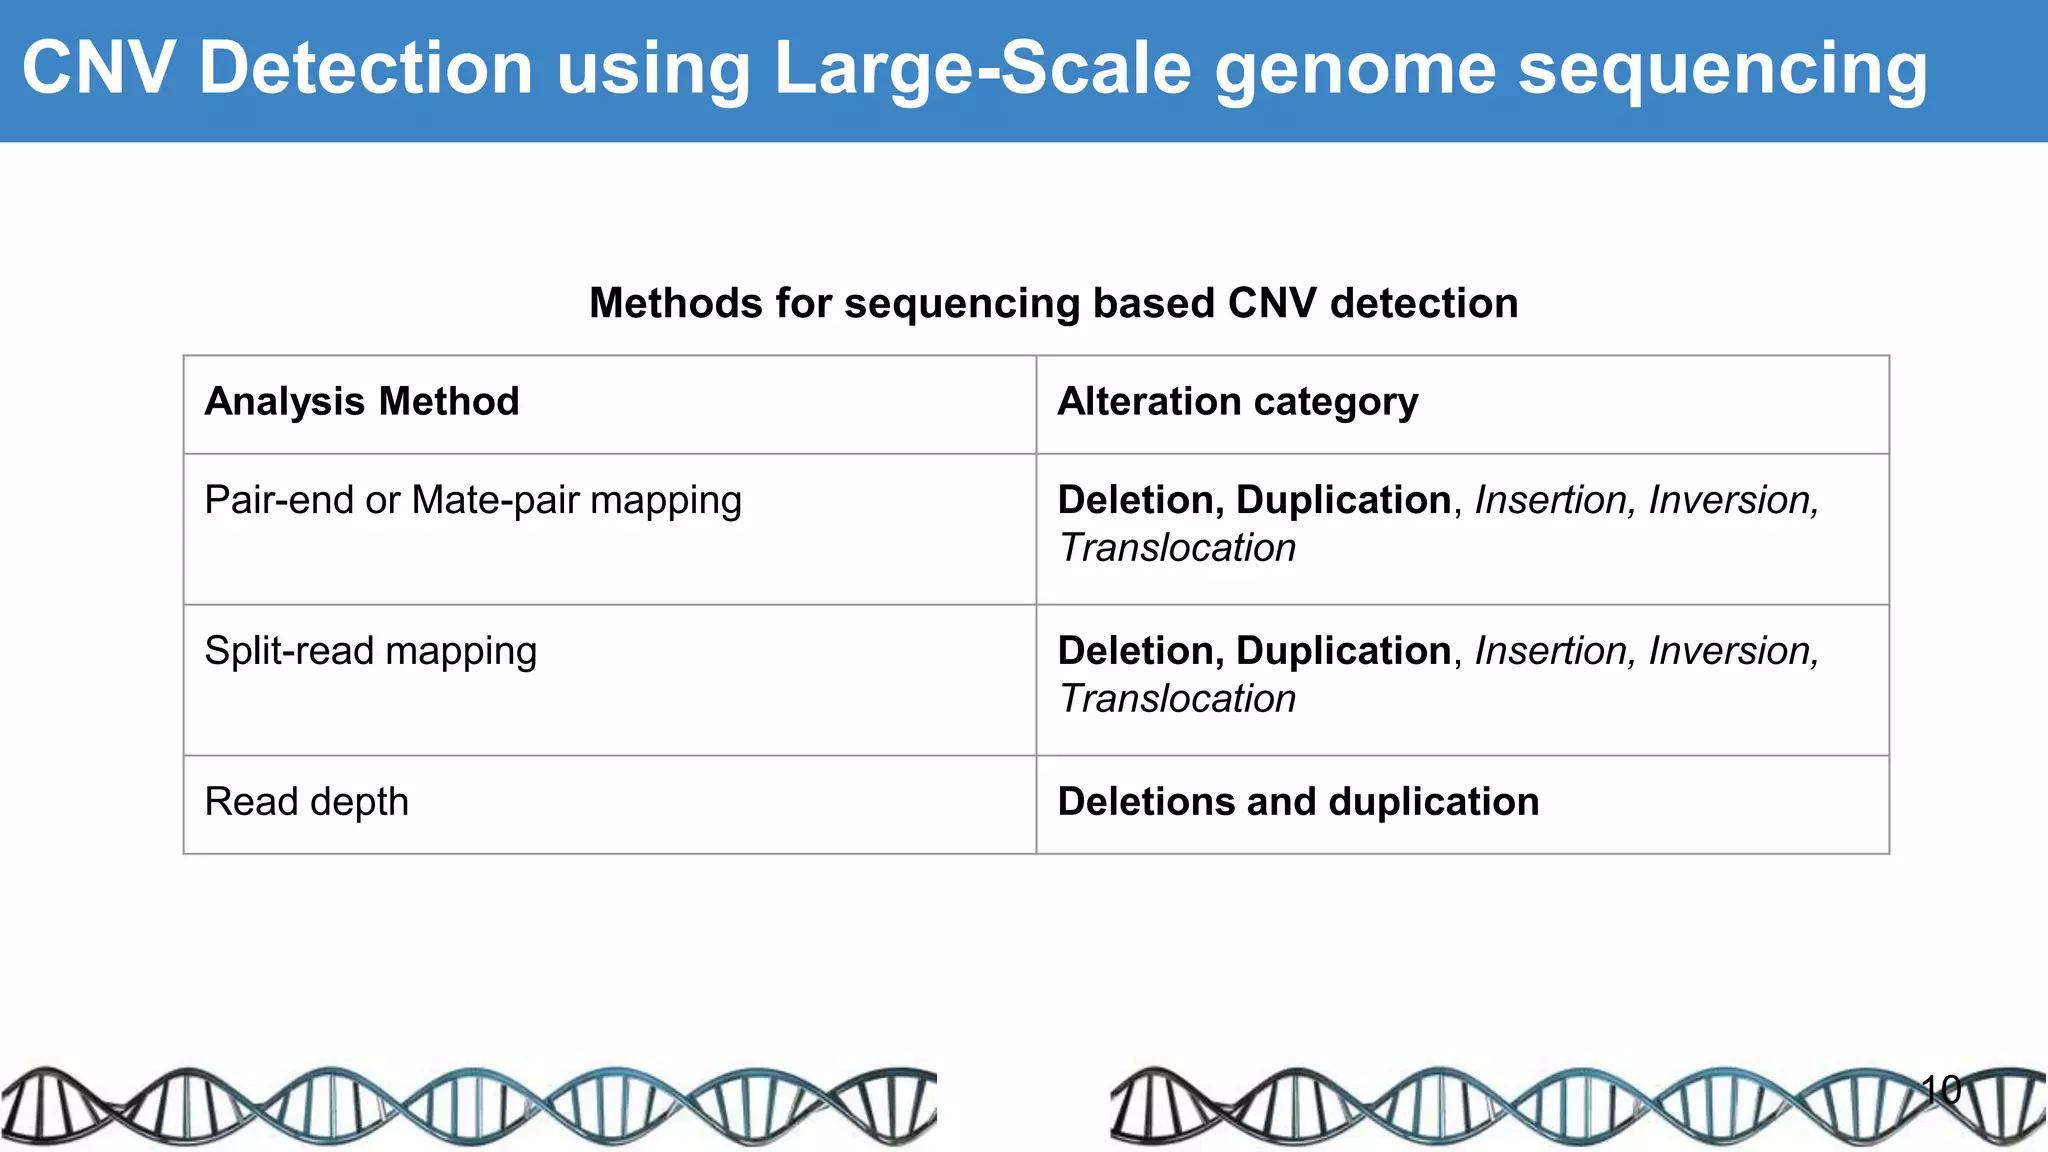
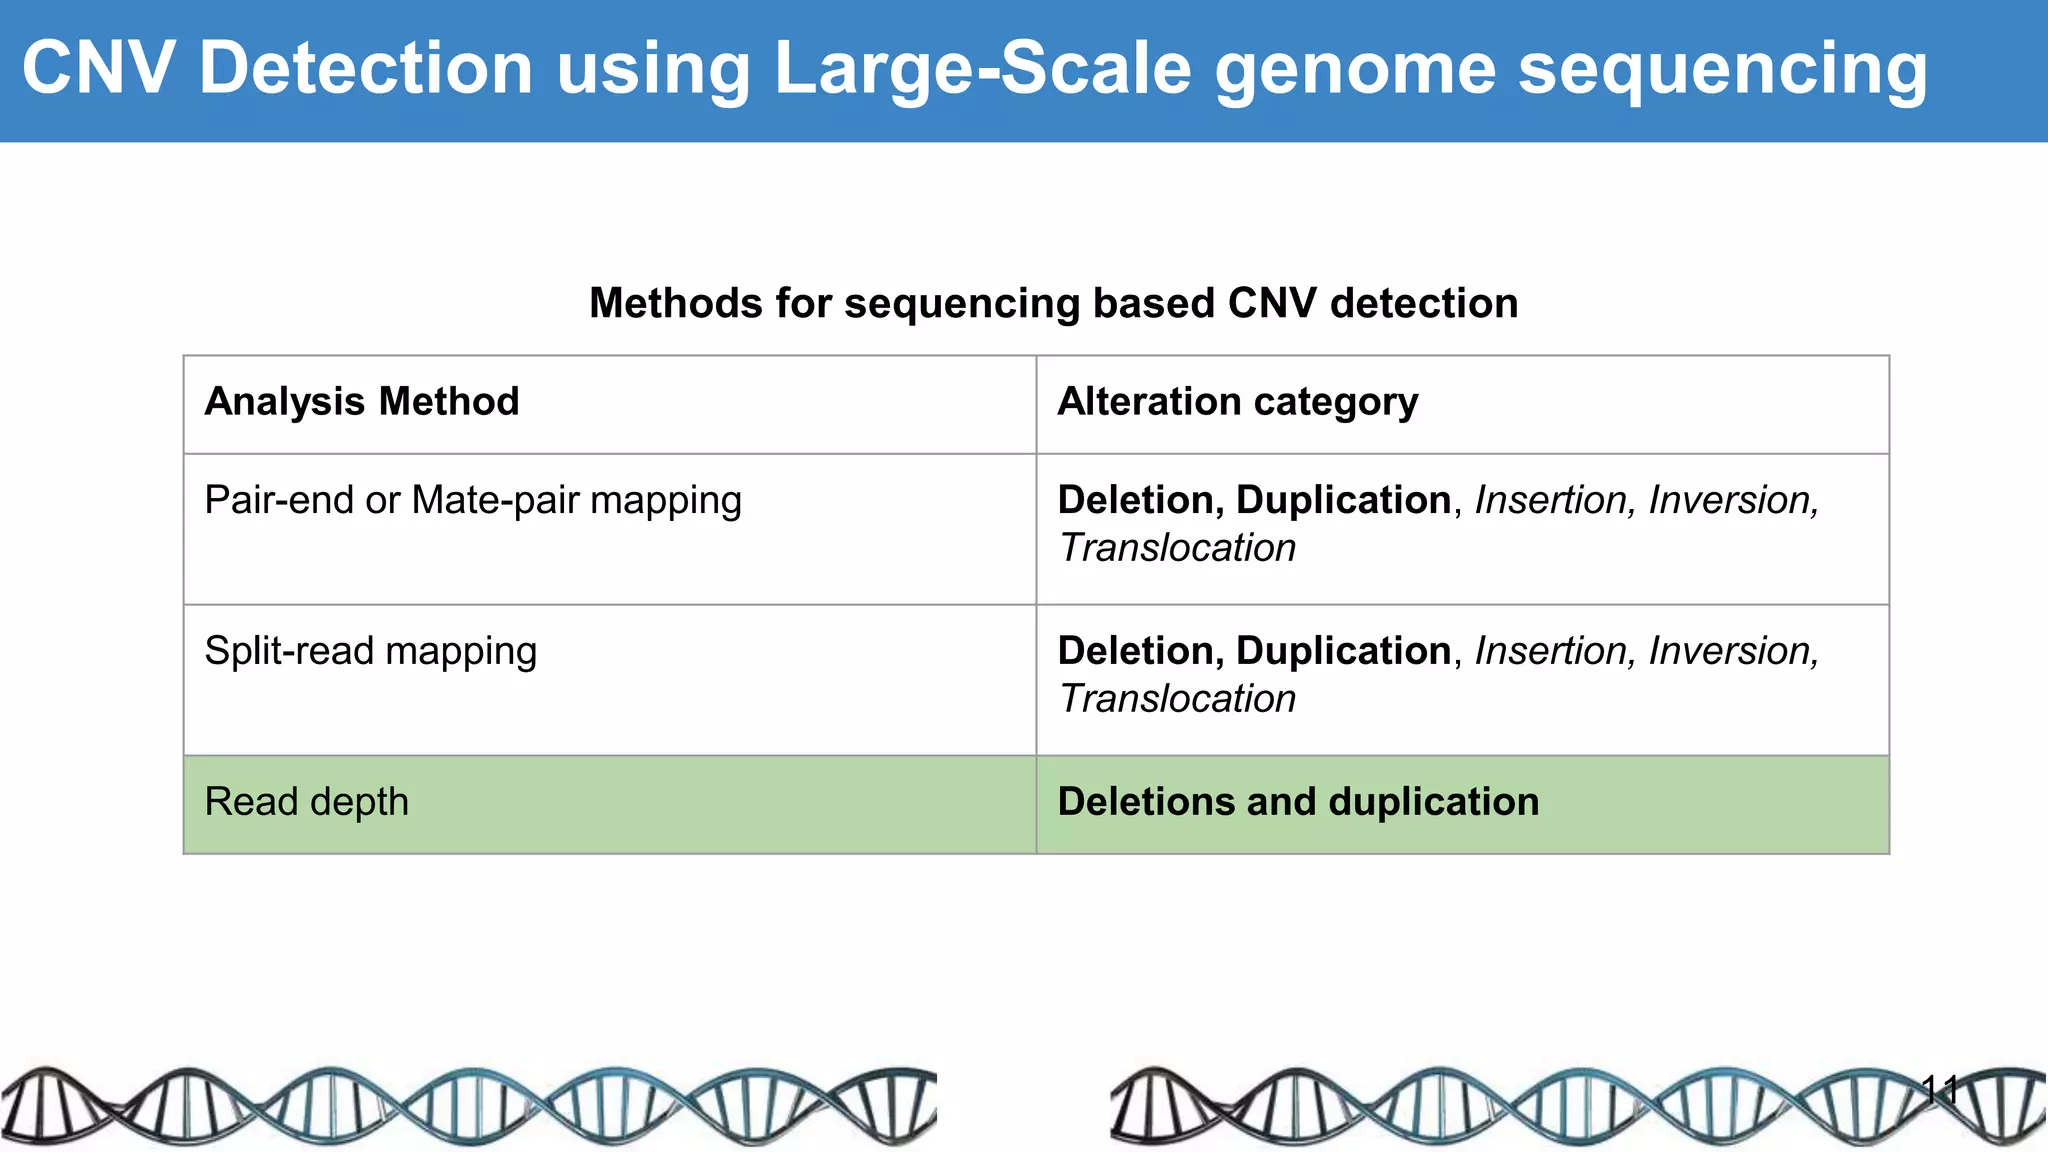
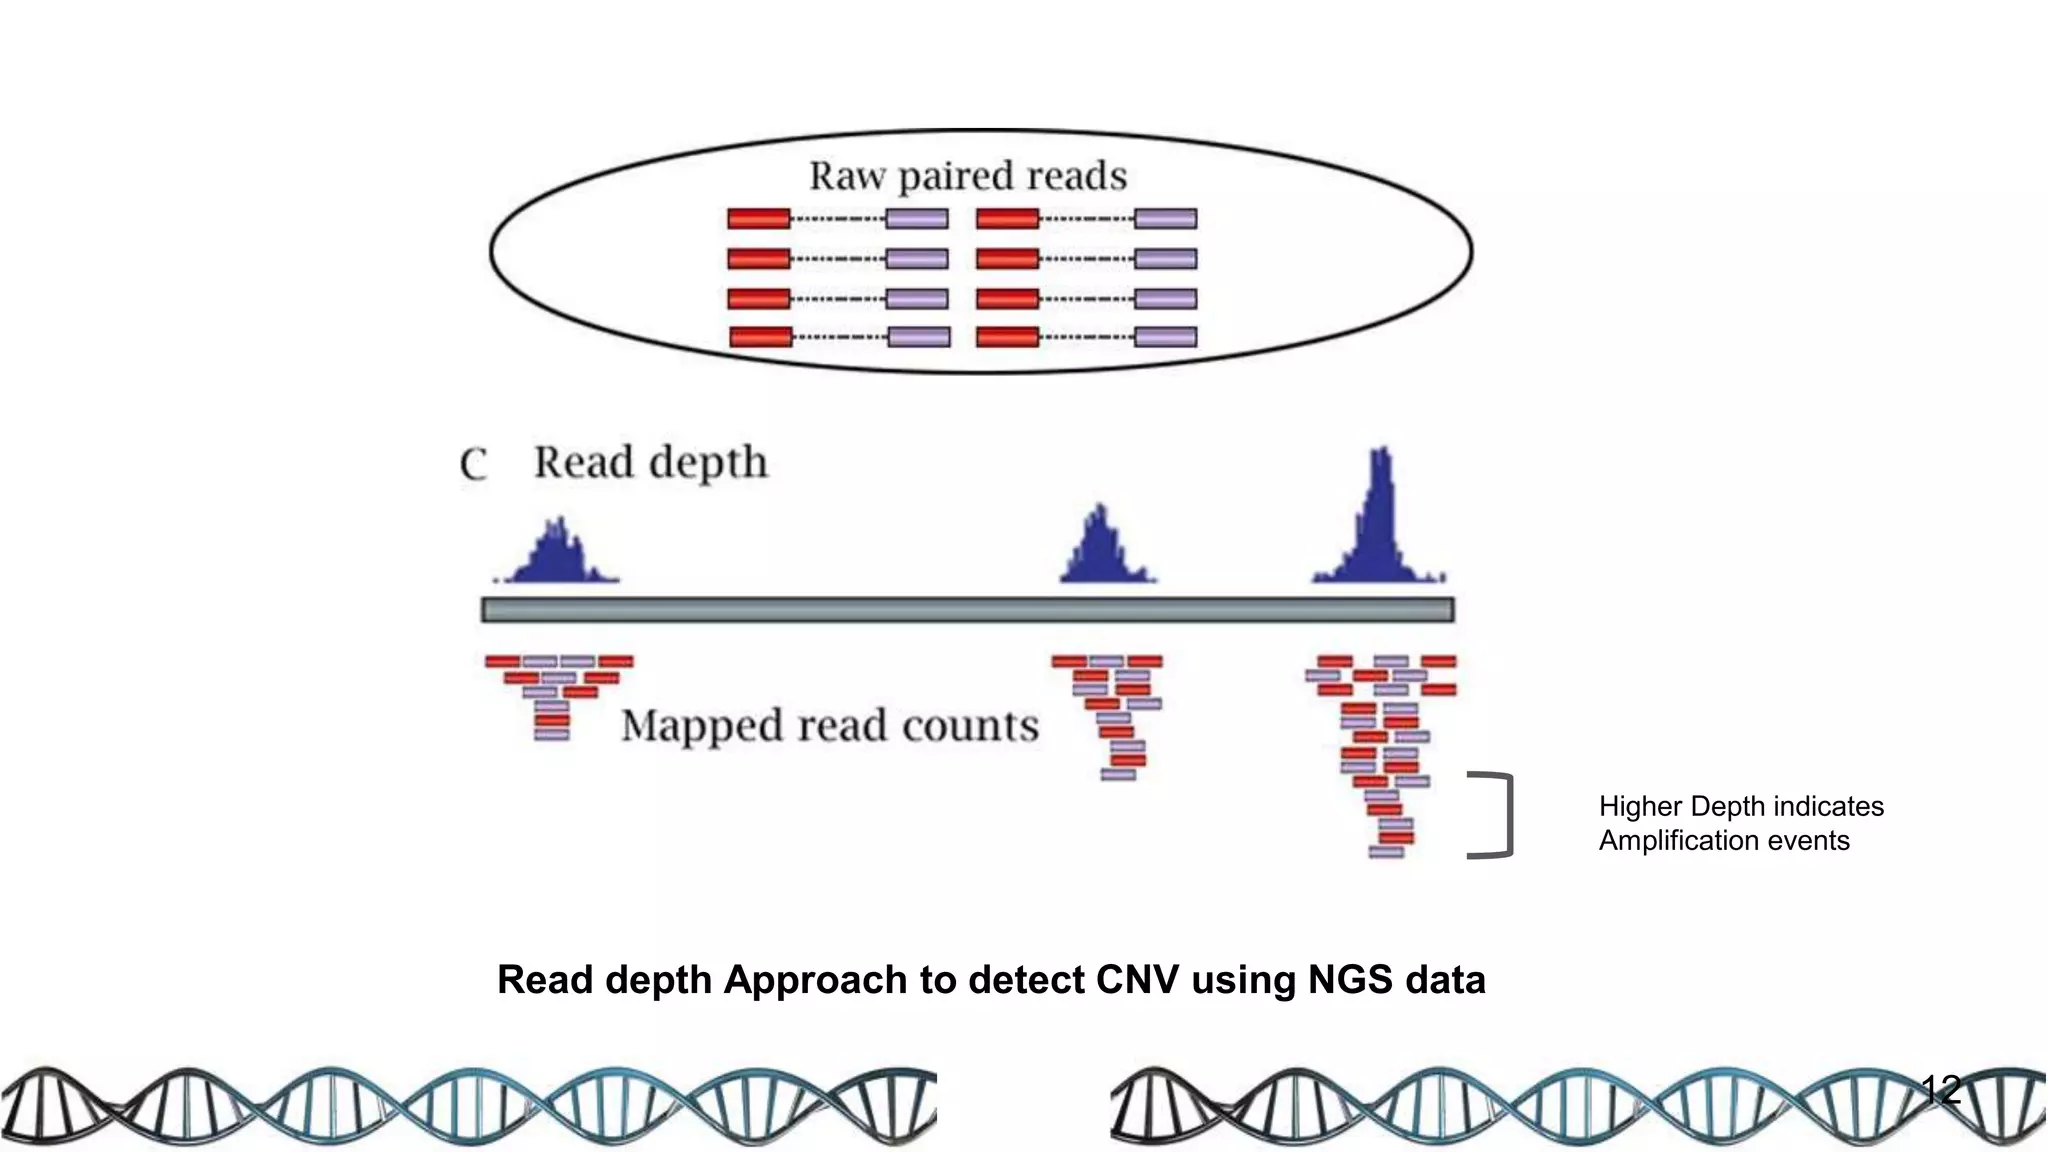
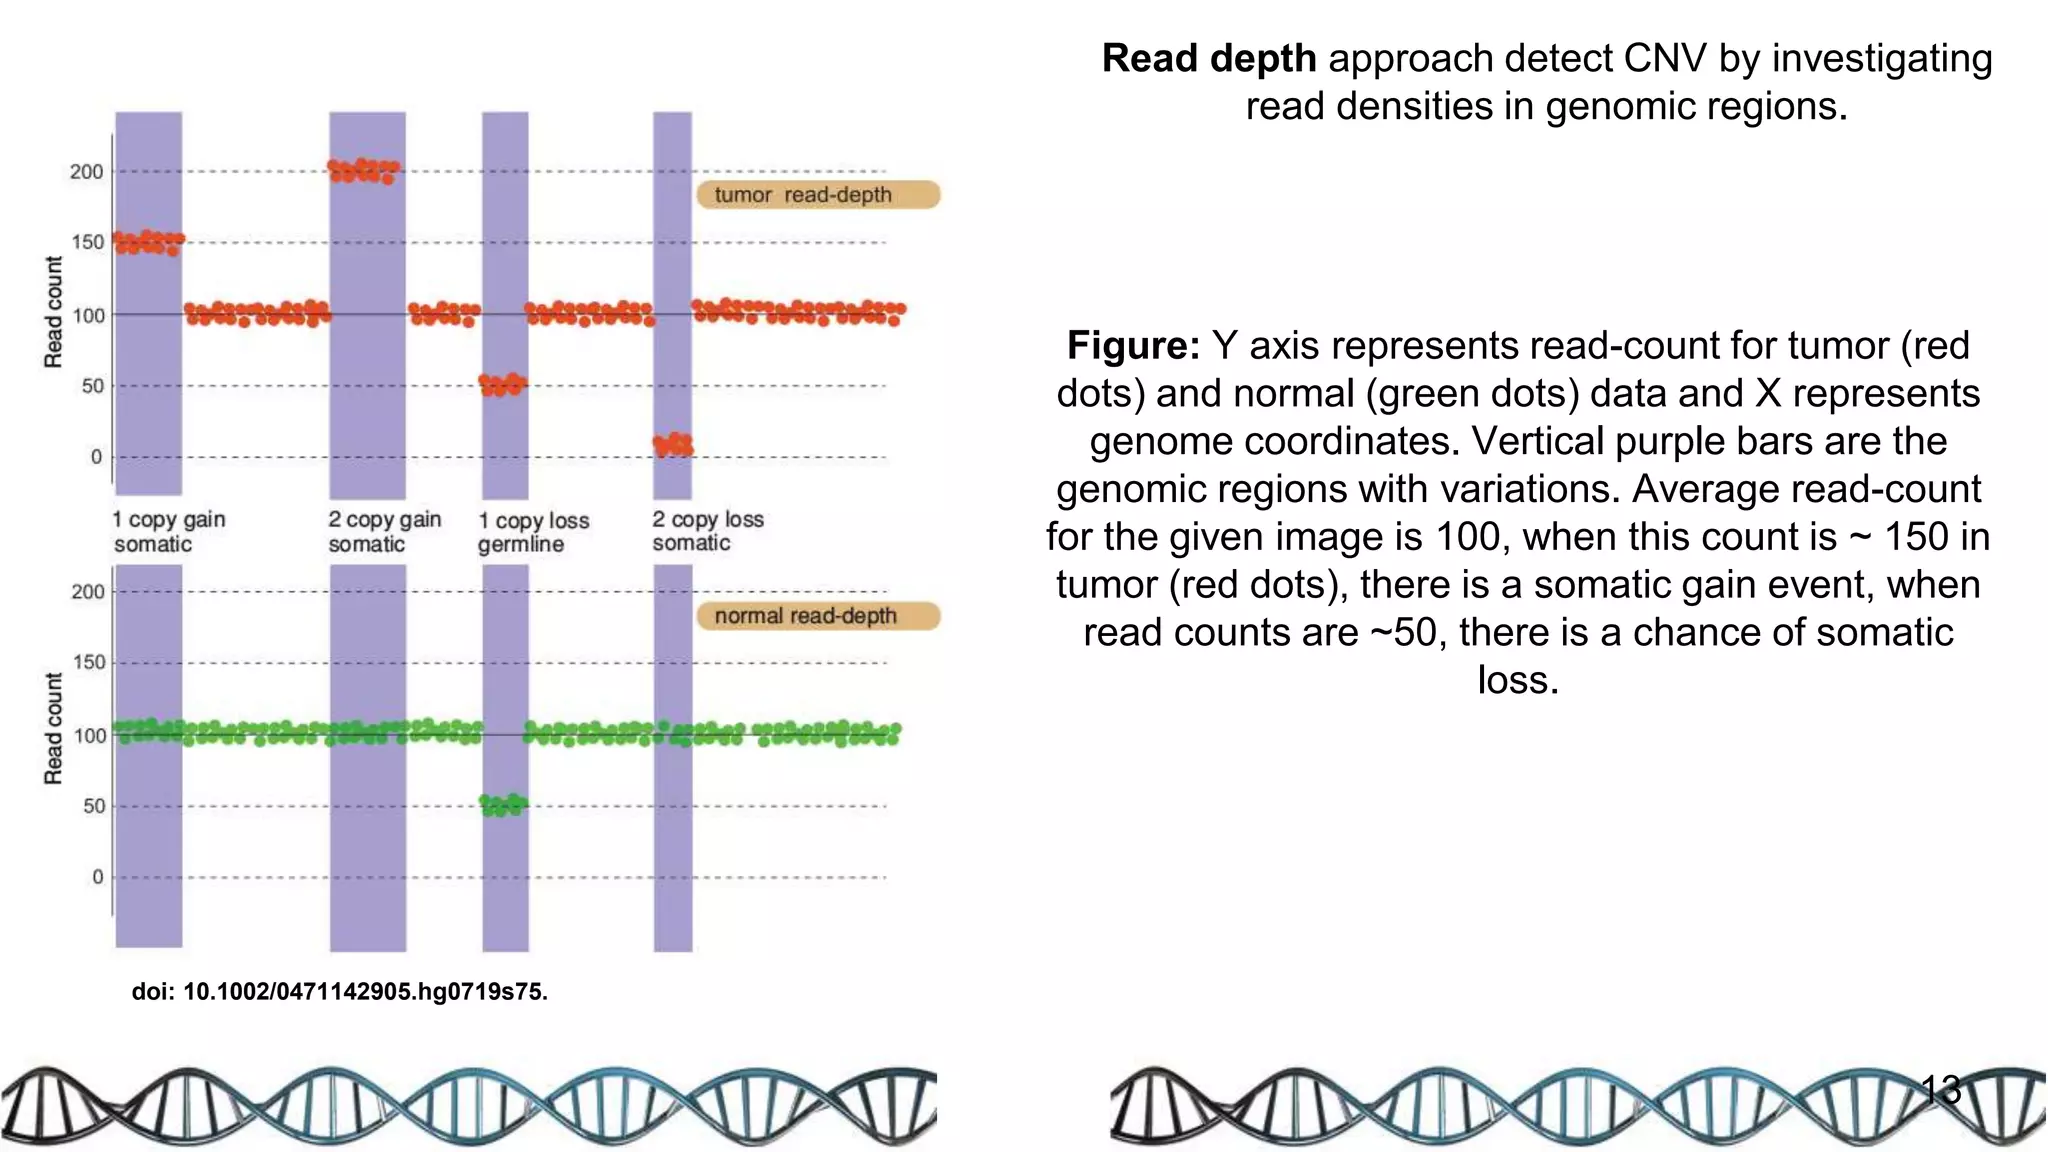
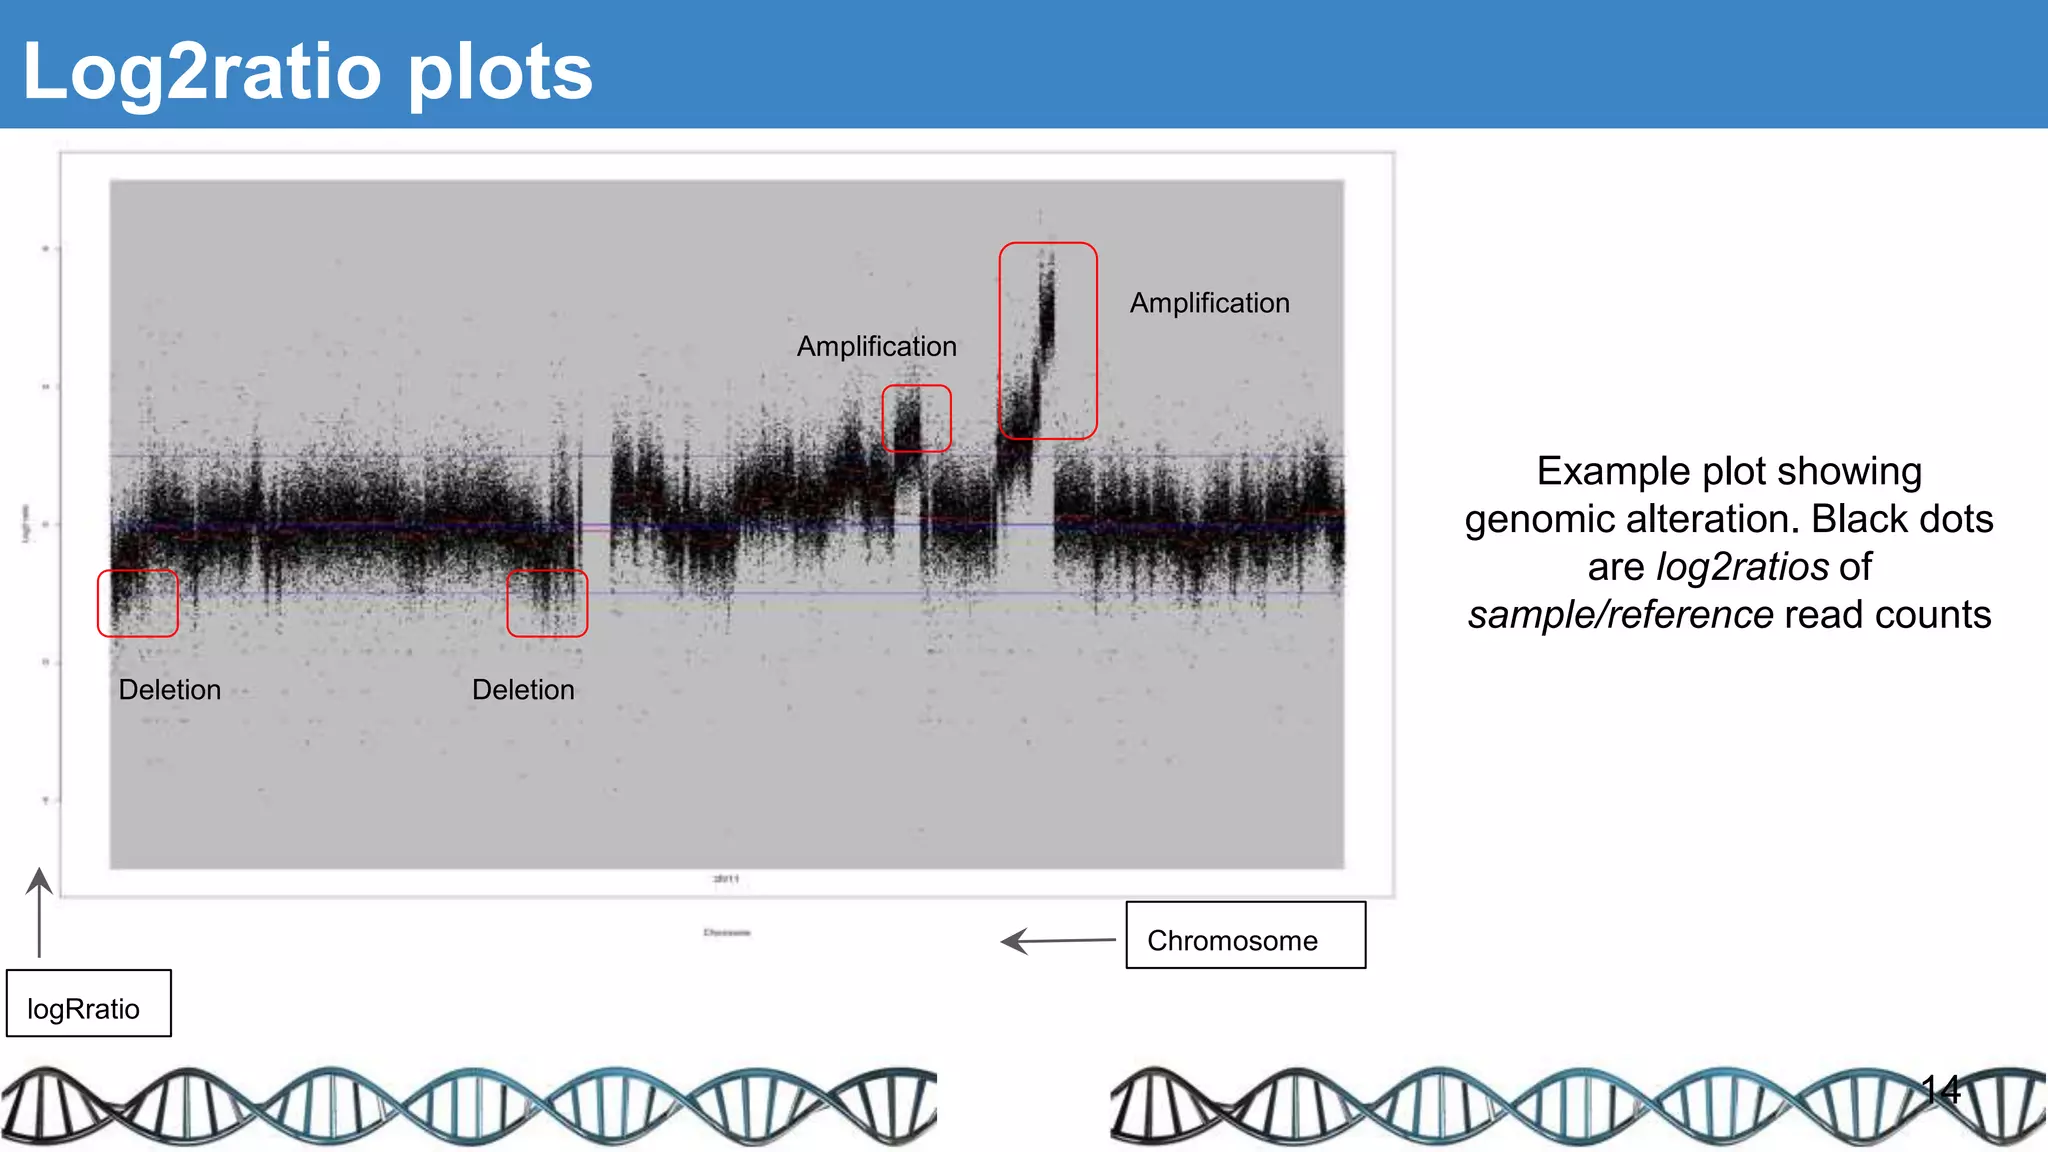
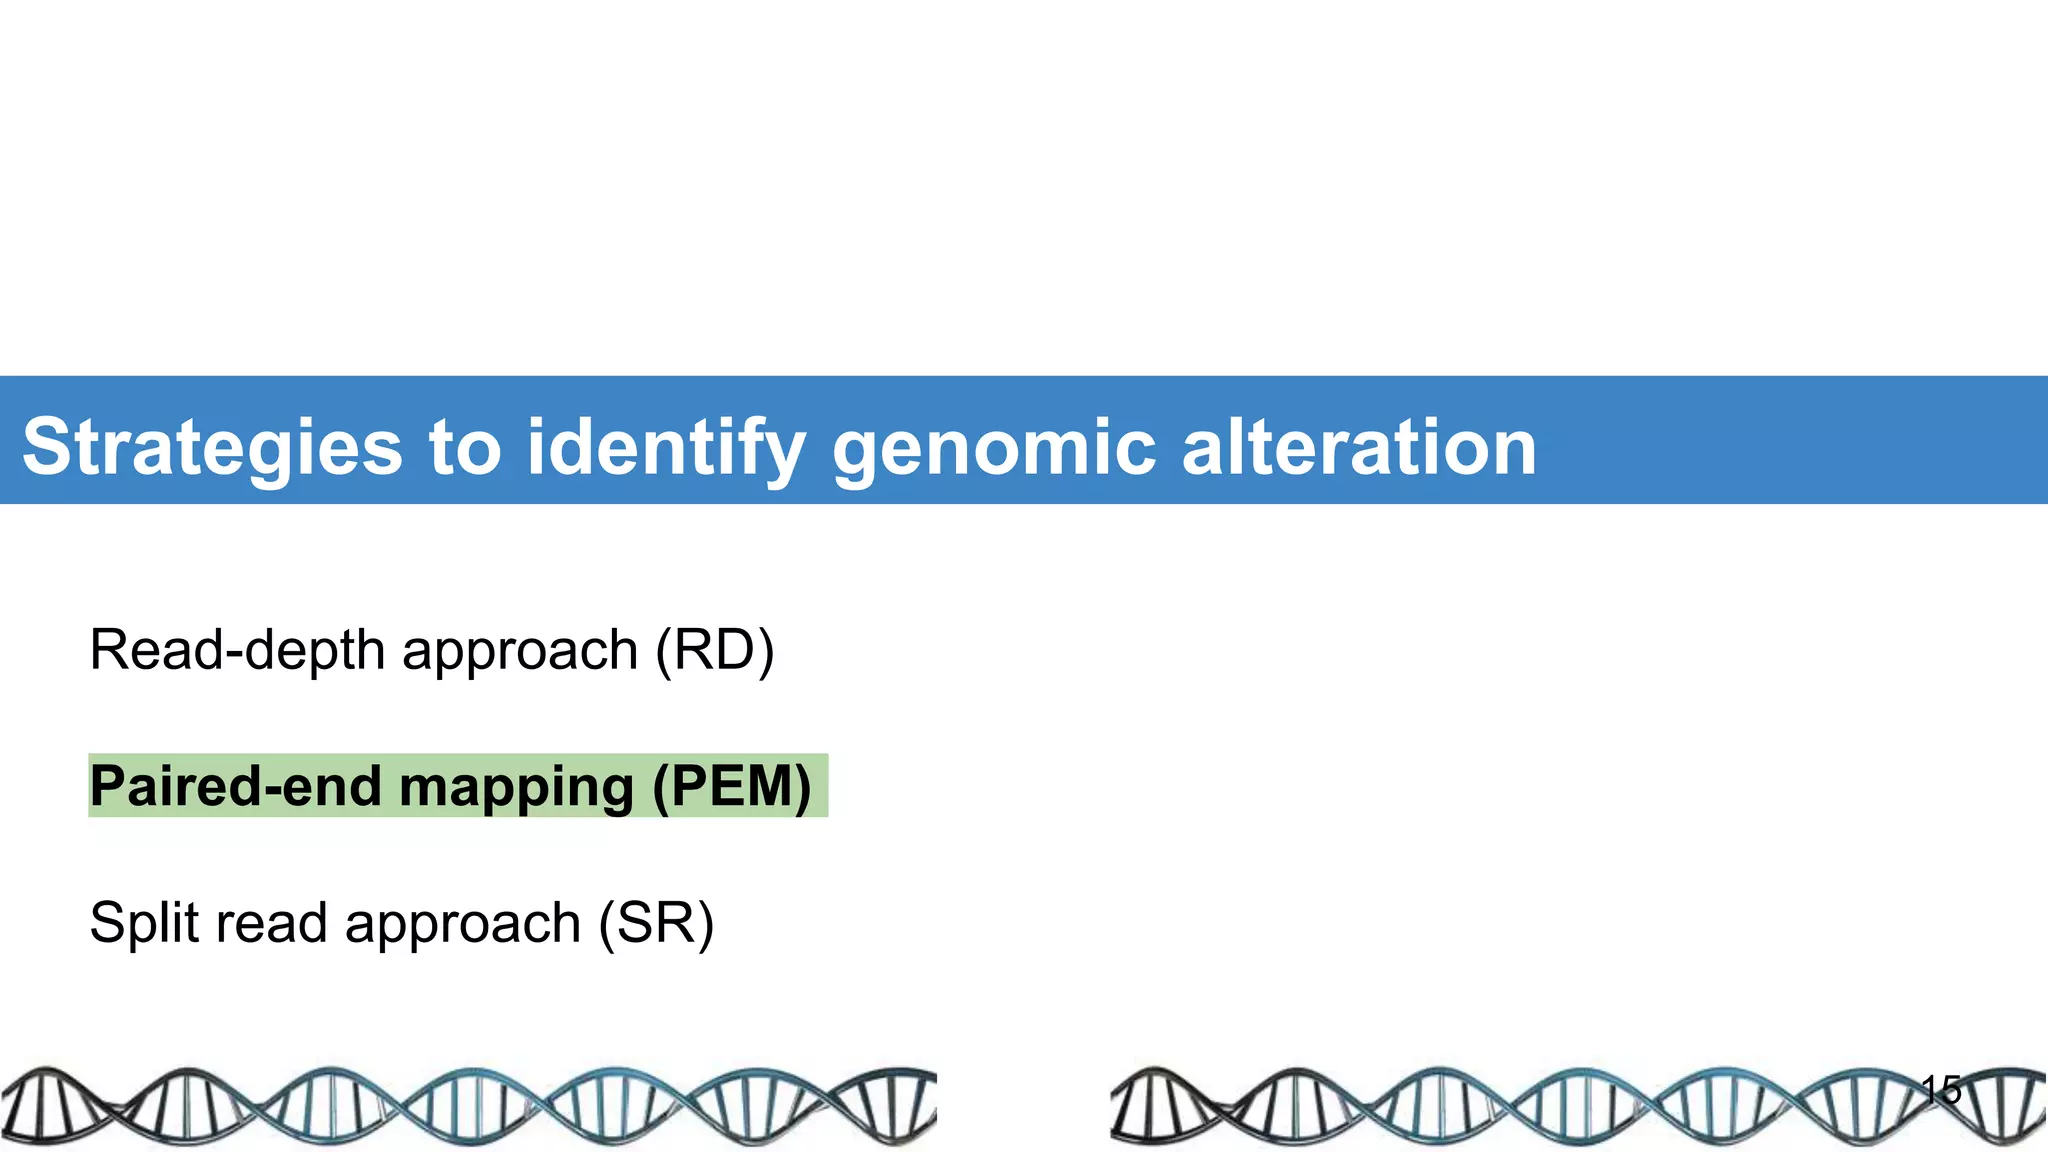
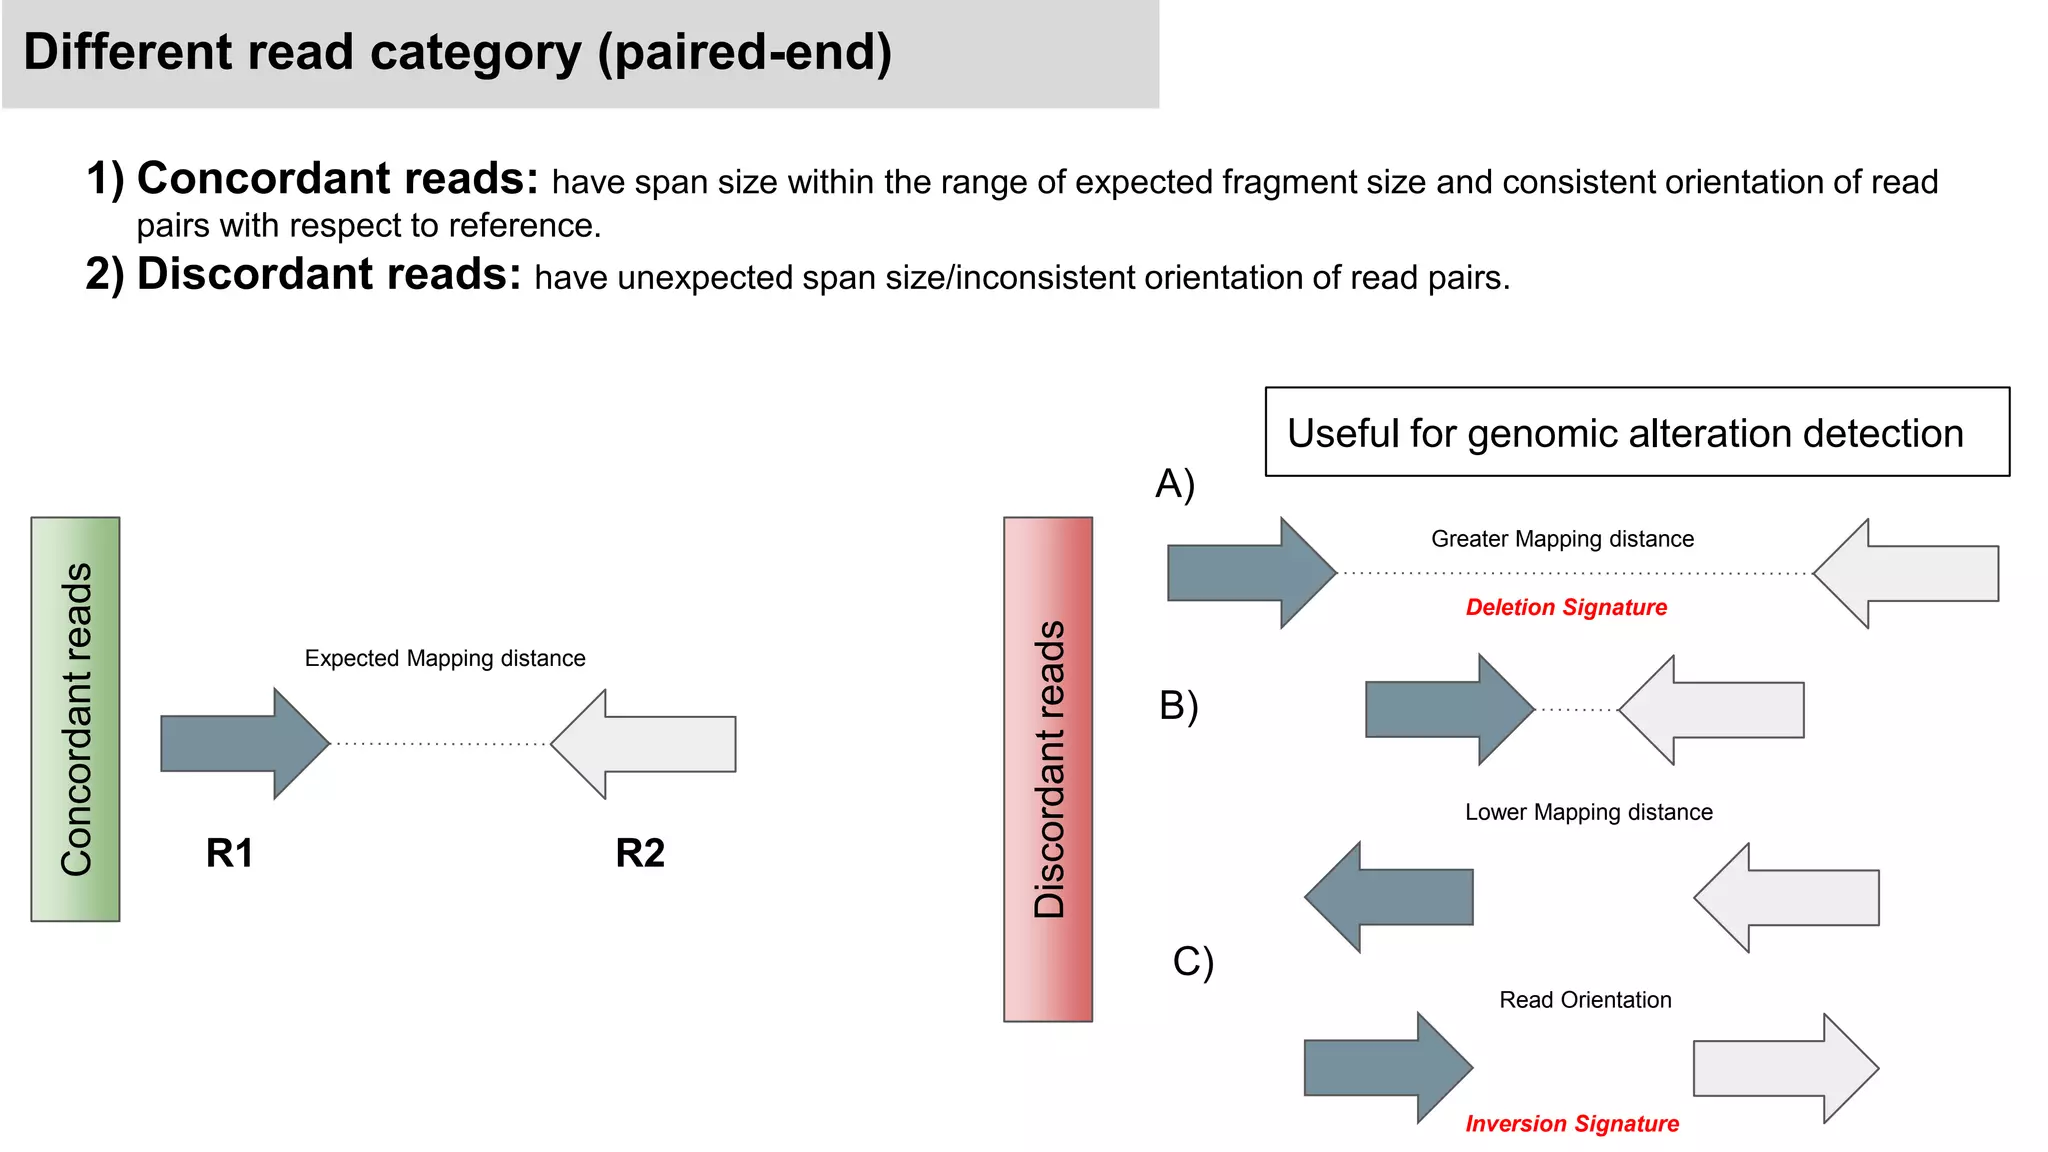
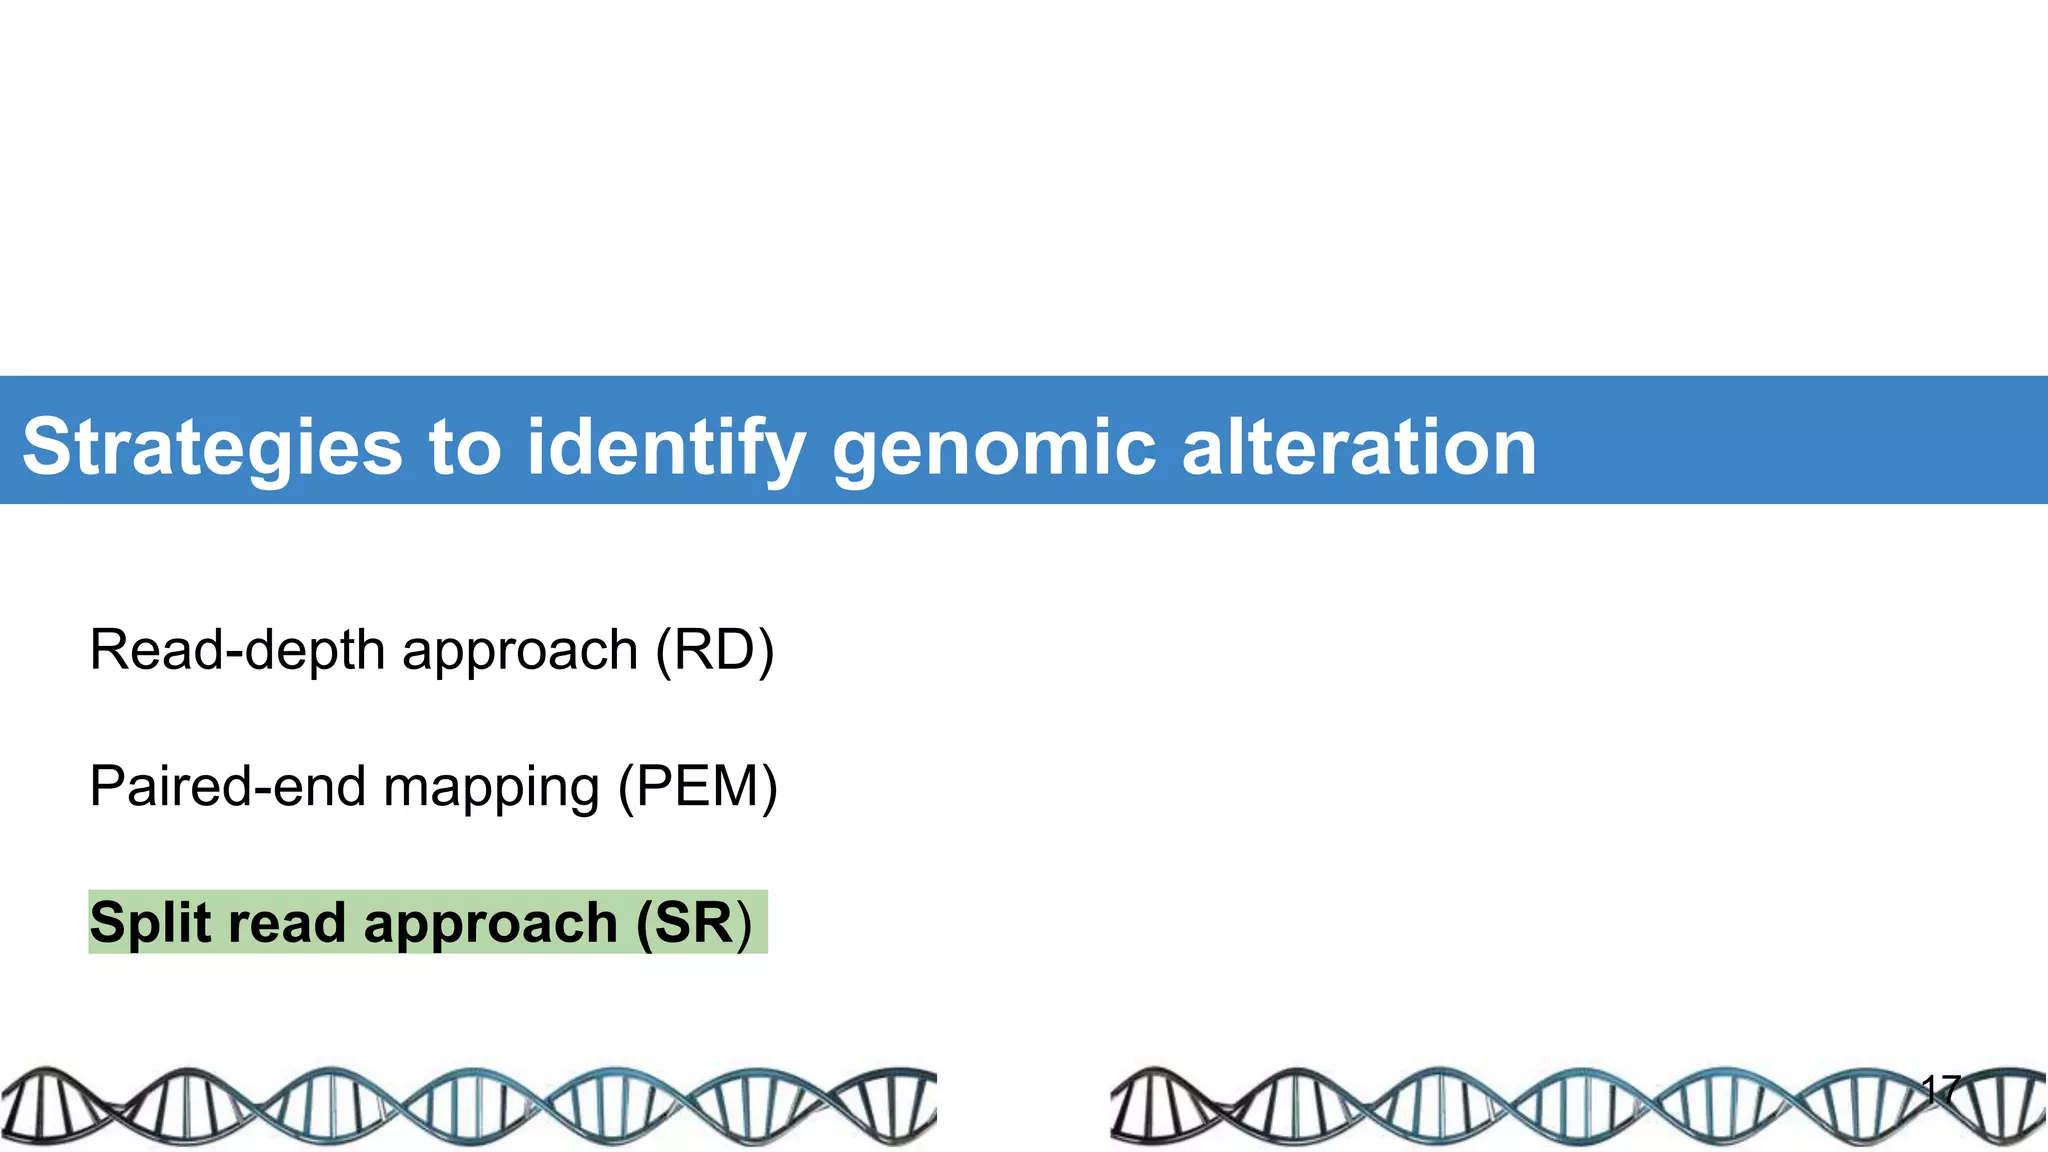
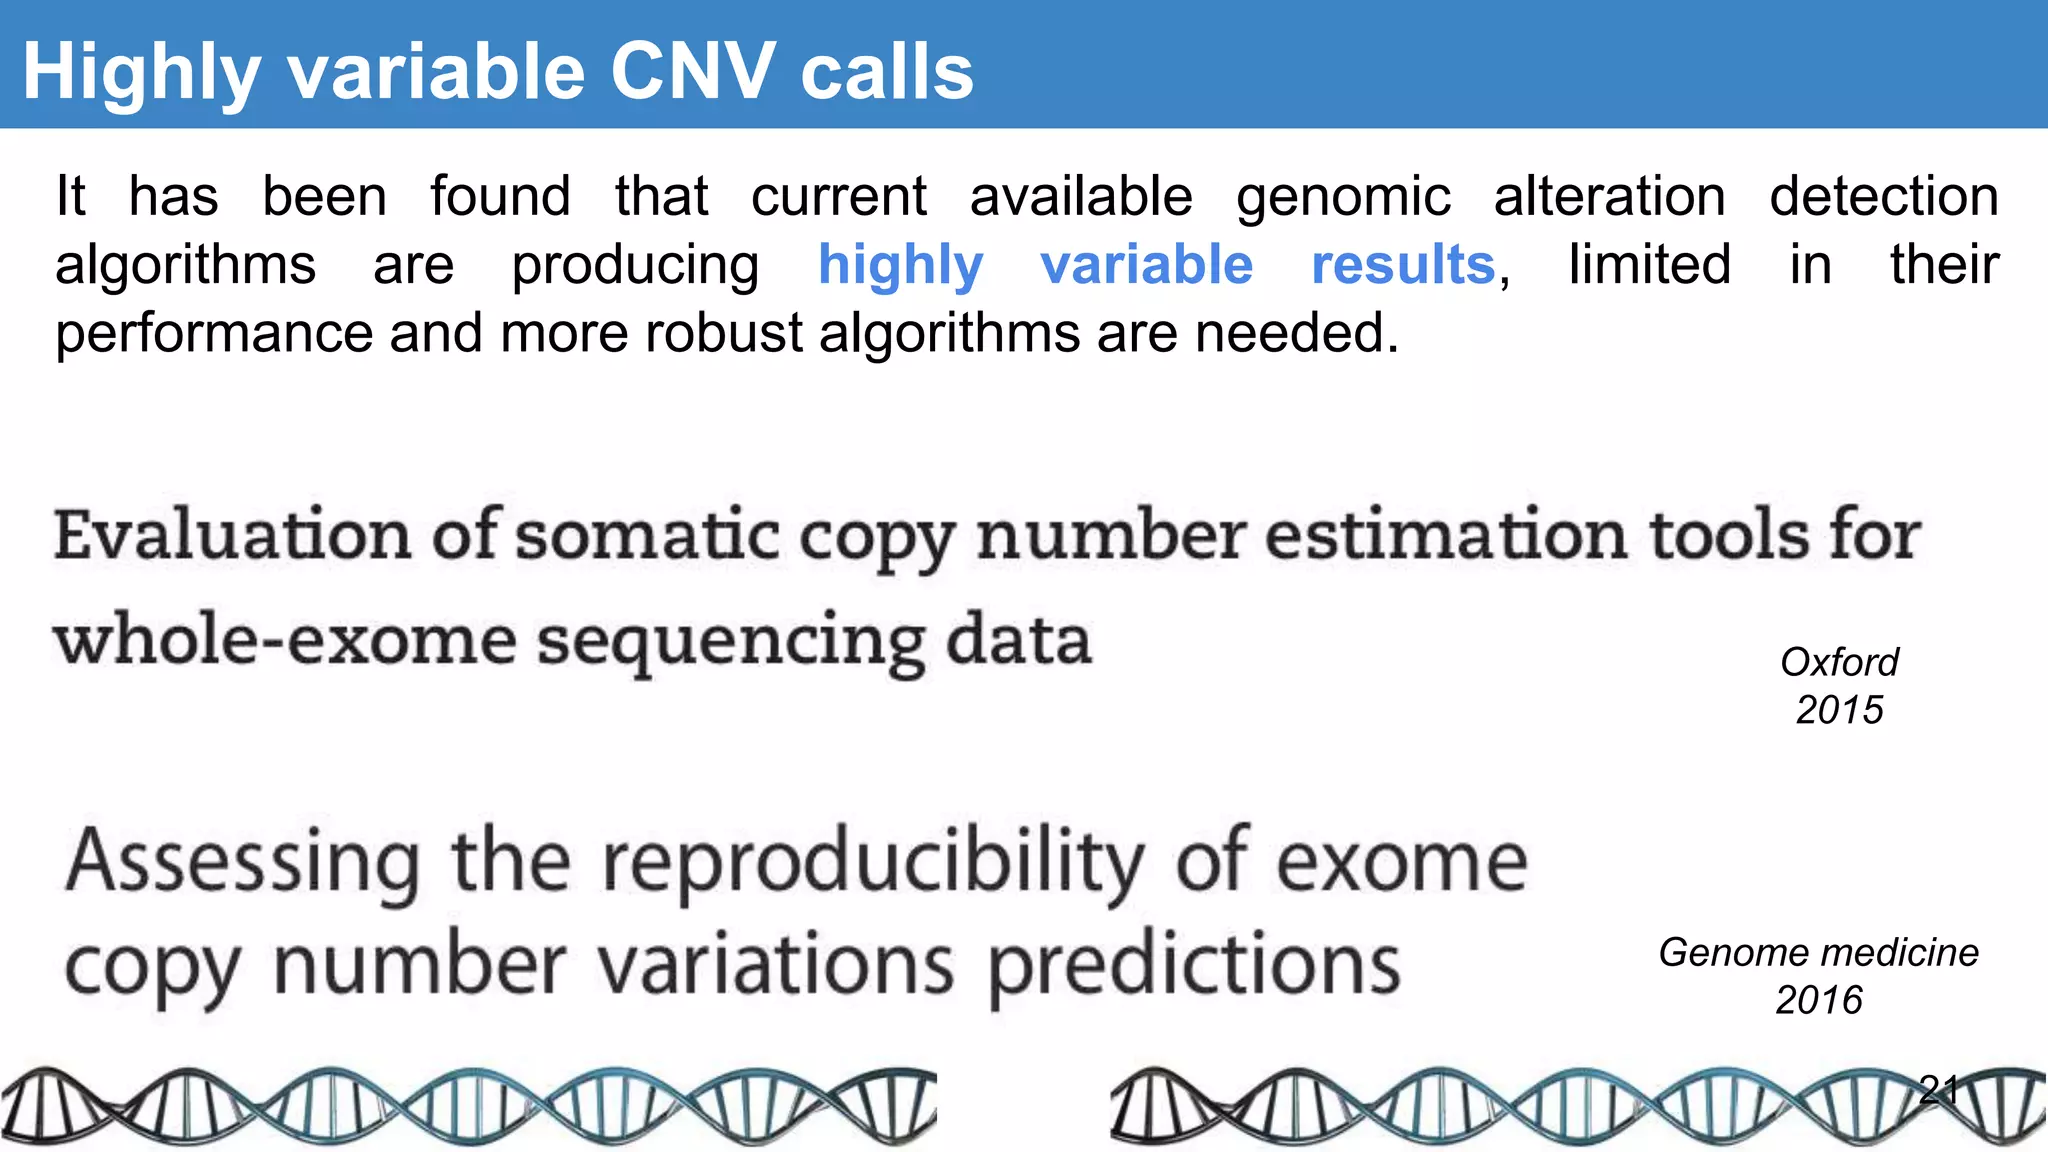
Analyzing
Genomic Alteration
in human genome using sequencing
data
Samarth Kulshrestha
National Institute of Biomedical
Genomics Kalyani, W.B, India
Genomic alteration
2
Structural Variations (SV) are defined as genomic alterations that involves DNA segments with a length of
>1Kb.
There are different categories of genomic alterations:
● Copy number variation(CNV): This class includes Copy number deletion and Copy number duplication of
genomic segment.
● Insertion: The sequence of one or more nucleotides added between two adjacent nucleotides in the
sequence
● Inversion: A DNA segment that is reversed in the orientation with respect to other segments.
● Translocation: A process of exchange of chromosomal segment within the chromosome
(Intrachromosomal) or with other chromosomes (Interchromosomal).
Other complex alterations includes recently discovered complex rearrangement phenomenon
“Chromothripsis”
3
doi: https://doi.org/10.1182/blood-2006-06-030858
Genomic variation (A) A single nucleotide polymorphism (SNP) occurs as a result of a single base substitution at an individual site in the DNA
sequence (B) A deletion is the loss/absence of DNA sequence. (C) An inversion is a rearrangement causing a segment of DNA to be present in
reverse orientation. (D) A copy number variant (CNV) is a segment of DNA that is 1 kb or larger and is present at a variable copy number in
comparison with a reference genome. CNVs can be either deletion variants where there is loss of copy number relative to the reference
sequence or multicopy duplications where there is gain of copy number relative to the reference sample. (E) A segmental duplication is a
segment of DNA at least 1 kb in size that occurs in 2 or more copies per haploid genome, with the different copies sharing at least 90%
sequence identity.
Copy number variation (CNV)
Copy Number Variation (CNV) is a prevalent form of genetic variation
that leads to abnormal number of copies of large genomic region in a
cell.
Copy number variation play an important role in pathogenesis and
progression of Cancer and variety of other human disorders.
CNV length varies from 1 Kb (Kilobases) to several Mb (Megabases).
4
CNV Disease Association
Nature 2011
Nature 2014
Nature 2009
5
Nature 2010 n=3131 26 histological types
Nature 2013 n=4934 11 cancer types
6
CNV detection using sequencing data
7
CELL 2013
Sample=811
Nature comm 2015
Sample=1070
Genome Medicine 2013
Sample=25
CNV Detection Technologies
Different CNV detection methods are available based on:
1. Array CGH (Comparative Genomic Hybridization)
1. SNP Chips
low spatial resolution, low throughput
3. Sequencing data
Precise characterization of breakpoints
8
Strategies to identify structural alteration (CNV)
9
Read-depth approach (RD)
Paired-end mapping (PEM)
Split read approach (SR)
CNV Detection using Large-Scale genome sequencing
Methods for sequencing based CNV detection
Analysis Method Alteration category
Pair-end or Mate-pair mapping Deletion, Duplication, Insertion, Inversion,
Translocation
Split-read mapping Deletion, Duplication, Insertion, Inversion,
Translocation
Read depth Deletions and duplication
10
Methods for sequencing based CNV detection
Analysis Method Alteration category
Pair-end or Mate-pair mapping Deletion, Duplication, Insertion, Inversion,
Translocation
Split-read mapping Deletion, Duplication, Insertion, Inversion,
Translocation
Read depth Deletions and duplication
11
CNV Detection using Large-Scale genome sequencing
Read depth Approach to detect CNV using NGS data
12
Higher Depth indicates
Amplification events
13
Read depth approach detect CNV by investigating
read densities in genomic regions.
doi: 10.1002/0471142905.hg0719s75.
Figure: Y axis represents read-count for tumor (red
dots) and normal (green dots) data and X represents
genome coordinates. Vertical purple bars are the
genomic regions with variations. Average read-count
for the given image is 100, when this count is ~ 150 in
tumor (red dots), there is a somatic gain event, when
read counts are ~50, there is a chance of somatic
loss.
Log2ratio plots
14
logRratio
Chromosome
Amplification
Deletion
Example plot showing
genomic alteration. Black dots
are log2ratios of
sample/reference read counts
Deletion
Amplification
Strategies to identify genomic alteration
15
Read-depth approach (RD)
Paired-end mapping (PEM)
Split read approach (SR)
1) Concordant reads: have span size within the range of expected fragment size and consistent orientation of read
pairs with respect to reference.
2) Discordant reads: have unexpected span size/inconsistent orientation of read pairs.
Concordantreads
Discordantreads
Greater Mapping distance
Lower Mapping distance
Expected Mapping distance
Read Orientation
Useful for genomic alteration detection
A)
B)
C)
Deletion Signature
Different read category (paired-end)
R1 R2
Inversion Signature
Strategies to identify genomic alteration
17
Read-depth approach (RD)
Paired-end mapping (PEM)
Split read approach (SR)
18
Split-read
Split reads are incompletely mapped reads
Reference genome
Mapped reads
Read Depth based tools
SegSeq
CNV-seq
BIC-seq
ReadDepth
CMDS
CNVnator
PEM/SR based tools
BreakDancer
PEMer
Pindel
GASV
VariationHunter
DELLY
Combinatorial Methods
CNVer
GASVPro
Genome STRiP
SVDetect
inGAP-sv
FASTQ
BAM
SAM
Pileup
19
Input format
Available tools for CNV detection (Genome/Exome)
Tools for CNV detection using exome data
Tools Input requirement
Control-FREEC SAM/BAM
CoNIFER BAM
XHMM BAM
ExomeDepth BAM
ExomeCNV BAM/pileup
VarScan2 BAM/pileup
20
*Control-FREEC detect CNV for both the datasets (Genome and Exome)
Highly variable CNV calls
21
It has been found that current available genomic alteration detection
algorithms are producing highly variable results, limited in their
performance and more robust algorithms are needed.
Genome medicine
2016
Oxford
2015
Array vs Sequencing
22
Microarrays are generally unable to resolve breakpoints at the single-base-pair level.
Microarrays offer a distinct advantage in terms of throughput and cost.
The most important benefit of NGS technologies is that it is possible to discover a
multitude of variant classes with a single sequencing experiment.
Sequencing data offers different approaches: 1) Read-depth 2) Pair-end 3) Split
read strategies to detect genomic alteration at base pair level resolution.
ARRAY
Sequencing
23
Drop in coverage
Deletion event in IGV
doi:10.1038/npjgenmed.2016.26
Figure: A deletion event visualization using paired-
end reads in an IGV interface. All gray color reads
are concordant reads with no mapping
abnormalities while red color reads are discordant
deletion supportive read pairs with abnormal read
mapping. There is a coverage drop in the region too
which supports deletion event.
SV detection using discordants read pairs
CNV Data Visualization
24
CNV Data Visualization
25
IGV Interface
Circos Plot
(Integrative Genomics Viewer)
IGV
26
Different approaches for IGV visualization:
● Genomic coordinate based chr:Start-Stop
● Gene based Any
amplified/deleted gene
name
● HeatMap
Gene based: Read density
Heat Map
Somatic Amplification event
27
Tumor
BAM
Normal
BAM
Somatic Amplification event visualization through IGV
Read density
Higher read density for
Tumor data when
compared to Normal
data in a given window
of ~17kb for an
amplification event
indicates possibility of
somatic event
IGV visualisation based on Gene
based or coordinate based search
Somatic Deletion event
28
Read density
Lower read density for
Tumor data when
compared to Normal
data in a given window
of ~28kb for a deletion
event indicates
possibility of somatic
deletion event
Somatic Amplification event visualization through IGV
Tumor
BAM
Normal
BAM
IGV visualisation based on Gene
based or coordinate based search
File require for Heat map visualization= segmentation file generated from CNV caller
FORMAT of .seg file is :
pat_ID chr start
stop ratio
p113 chr1 10001
810000 -0.1616
p113 chr1 810001 1700000
-0.7475
p113 chr1 1700001 2251000
-0.6318
p113 chr1 2251001 2290000
-1.1409
p113 chr1 2290001 2694000
-0.6104
p113 chr1 2694001 4119000
-0.4411
p113 chr1 4119001 4814000
-0.2095
.
.
p119 chr8 70240001
70702000 0.3316
p119 chr8 70702001
71018000 -0.0404
p119 chr8 71018001
.seg file extension determines
Copy number data
IGV Heatmap Visualization
30
Load BICseq.seg
file using given path.
.seg file should contains
logRratio information of all
patients
31
Data Type Default Graph Type Default Data Range
Default Colors
Copy number Heatmap -1.5 - 1.5
Blue to red
Gene Expression Heatmap -1.5 - 1.5
Blue to red
DNA Methylation Heatmap 0 to 1 (methylation score)
Green
.
.
.
Different Data type and display option in IGV
32
Red: Amplification
Blue: Deletion
Sample ID
Chromosomes
IGV heatmap visualization of CNV events generated by CNV caller
Public forum
33
https://www.biostars.org/
http://seqanswers.com/
Availability
Availability
Thanks for your kind attention
34

Genome alteration detection using high throughput data

  • 1.
    Analyzing Genomic Alteration in humangenome using sequencing data Samarth Kulshrestha National Institute of Biomedical Genomics Kalyani, W.B, India
  • 2.
    Genomic alteration 2 Structural Variations(SV) are defined as genomic alterations that involves DNA segments with a length of >1Kb. There are different categories of genomic alterations: ● Copy number variation(CNV): This class includes Copy number deletion and Copy number duplication of genomic segment. ● Insertion: The sequence of one or more nucleotides added between two adjacent nucleotides in the sequence ● Inversion: A DNA segment that is reversed in the orientation with respect to other segments. ● Translocation: A process of exchange of chromosomal segment within the chromosome (Intrachromosomal) or with other chromosomes (Interchromosomal). Other complex alterations includes recently discovered complex rearrangement phenomenon “Chromothripsis”
  • 3.
    3 doi: https://doi.org/10.1182/blood-2006-06-030858 Genomic variation(A) A single nucleotide polymorphism (SNP) occurs as a result of a single base substitution at an individual site in the DNA sequence (B) A deletion is the loss/absence of DNA sequence. (C) An inversion is a rearrangement causing a segment of DNA to be present in reverse orientation. (D) A copy number variant (CNV) is a segment of DNA that is 1 kb or larger and is present at a variable copy number in comparison with a reference genome. CNVs can be either deletion variants where there is loss of copy number relative to the reference sequence or multicopy duplications where there is gain of copy number relative to the reference sample. (E) A segmental duplication is a segment of DNA at least 1 kb in size that occurs in 2 or more copies per haploid genome, with the different copies sharing at least 90% sequence identity.
  • 4.
    Copy number variation(CNV) Copy Number Variation (CNV) is a prevalent form of genetic variation that leads to abnormal number of copies of large genomic region in a cell. Copy number variation play an important role in pathogenesis and progression of Cancer and variety of other human disorders. CNV length varies from 1 Kb (Kilobases) to several Mb (Megabases). 4
  • 5.
    CNV Disease Association Nature2011 Nature 2014 Nature 2009 5
  • 6.
    Nature 2010 n=313126 histological types Nature 2013 n=4934 11 cancer types 6
  • 7.
    CNV detection usingsequencing data 7 CELL 2013 Sample=811 Nature comm 2015 Sample=1070 Genome Medicine 2013 Sample=25
  • 8.
    CNV Detection Technologies DifferentCNV detection methods are available based on: 1. Array CGH (Comparative Genomic Hybridization) 1. SNP Chips low spatial resolution, low throughput 3. Sequencing data Precise characterization of breakpoints 8
  • 9.
    Strategies to identifystructural alteration (CNV) 9 Read-depth approach (RD) Paired-end mapping (PEM) Split read approach (SR)
  • 10.
    CNV Detection usingLarge-Scale genome sequencing Methods for sequencing based CNV detection Analysis Method Alteration category Pair-end or Mate-pair mapping Deletion, Duplication, Insertion, Inversion, Translocation Split-read mapping Deletion, Duplication, Insertion, Inversion, Translocation Read depth Deletions and duplication 10
  • 11.
    Methods for sequencingbased CNV detection Analysis Method Alteration category Pair-end or Mate-pair mapping Deletion, Duplication, Insertion, Inversion, Translocation Split-read mapping Deletion, Duplication, Insertion, Inversion, Translocation Read depth Deletions and duplication 11 CNV Detection using Large-Scale genome sequencing
  • 12.
    Read depth Approachto detect CNV using NGS data 12 Higher Depth indicates Amplification events
  • 13.
    13 Read depth approachdetect CNV by investigating read densities in genomic regions. doi: 10.1002/0471142905.hg0719s75. Figure: Y axis represents read-count for tumor (red dots) and normal (green dots) data and X represents genome coordinates. Vertical purple bars are the genomic regions with variations. Average read-count for the given image is 100, when this count is ~ 150 in tumor (red dots), there is a somatic gain event, when read counts are ~50, there is a chance of somatic loss.
  • 14.
    Log2ratio plots 14 logRratio Chromosome Amplification Deletion Example plotshowing genomic alteration. Black dots are log2ratios of sample/reference read counts Deletion Amplification
  • 15.
    Strategies to identifygenomic alteration 15 Read-depth approach (RD) Paired-end mapping (PEM) Split read approach (SR)
  • 16.
    1) Concordant reads:have span size within the range of expected fragment size and consistent orientation of read pairs with respect to reference. 2) Discordant reads: have unexpected span size/inconsistent orientation of read pairs. Concordantreads Discordantreads Greater Mapping distance Lower Mapping distance Expected Mapping distance Read Orientation Useful for genomic alteration detection A) B) C) Deletion Signature Different read category (paired-end) R1 R2 Inversion Signature
  • 17.
    Strategies to identifygenomic alteration 17 Read-depth approach (RD) Paired-end mapping (PEM) Split read approach (SR)
  • 18.
    18 Split-read Split reads areincompletely mapped reads Reference genome Mapped reads
  • 19.
    Read Depth basedtools SegSeq CNV-seq BIC-seq ReadDepth CMDS CNVnator PEM/SR based tools BreakDancer PEMer Pindel GASV VariationHunter DELLY Combinatorial Methods CNVer GASVPro Genome STRiP SVDetect inGAP-sv FASTQ BAM SAM Pileup 19 Input format Available tools for CNV detection (Genome/Exome)
  • 20.
    Tools for CNVdetection using exome data Tools Input requirement Control-FREEC SAM/BAM CoNIFER BAM XHMM BAM ExomeDepth BAM ExomeCNV BAM/pileup VarScan2 BAM/pileup 20 *Control-FREEC detect CNV for both the datasets (Genome and Exome)
  • 21.
    Highly variable CNVcalls 21 It has been found that current available genomic alteration detection algorithms are producing highly variable results, limited in their performance and more robust algorithms are needed. Genome medicine 2016 Oxford 2015
  • 22.
    Array vs Sequencing 22 Microarraysare generally unable to resolve breakpoints at the single-base-pair level. Microarrays offer a distinct advantage in terms of throughput and cost. The most important benefit of NGS technologies is that it is possible to discover a multitude of variant classes with a single sequencing experiment. Sequencing data offers different approaches: 1) Read-depth 2) Pair-end 3) Split read strategies to detect genomic alteration at base pair level resolution. ARRAY Sequencing
  • 23.
    23 Drop in coverage Deletionevent in IGV doi:10.1038/npjgenmed.2016.26 Figure: A deletion event visualization using paired- end reads in an IGV interface. All gray color reads are concordant reads with no mapping abnormalities while red color reads are discordant deletion supportive read pairs with abnormal read mapping. There is a coverage drop in the region too which supports deletion event. SV detection using discordants read pairs
  • 24.
  • 25.
    CNV Data Visualization 25 IGVInterface Circos Plot (Integrative Genomics Viewer)
  • 26.
    IGV 26 Different approaches forIGV visualization: ● Genomic coordinate based chr:Start-Stop ● Gene based Any amplified/deleted gene name ● HeatMap Gene based: Read density Heat Map
  • 27.
    Somatic Amplification event 27 Tumor BAM Normal BAM SomaticAmplification event visualization through IGV Read density Higher read density for Tumor data when compared to Normal data in a given window of ~17kb for an amplification event indicates possibility of somatic event IGV visualisation based on Gene based or coordinate based search
  • 28.
    Somatic Deletion event 28 Readdensity Lower read density for Tumor data when compared to Normal data in a given window of ~28kb for a deletion event indicates possibility of somatic deletion event Somatic Amplification event visualization through IGV Tumor BAM Normal BAM IGV visualisation based on Gene based or coordinate based search
  • 29.
    File require forHeat map visualization= segmentation file generated from CNV caller FORMAT of .seg file is : pat_ID chr start stop ratio p113 chr1 10001 810000 -0.1616 p113 chr1 810001 1700000 -0.7475 p113 chr1 1700001 2251000 -0.6318 p113 chr1 2251001 2290000 -1.1409 p113 chr1 2290001 2694000 -0.6104 p113 chr1 2694001 4119000 -0.4411 p113 chr1 4119001 4814000 -0.2095 . . p119 chr8 70240001 70702000 0.3316 p119 chr8 70702001 71018000 -0.0404 p119 chr8 71018001 .seg file extension determines Copy number data IGV Heatmap Visualization
  • 30.
    30 Load BICseq.seg file usinggiven path. .seg file should contains logRratio information of all patients
  • 31.
    31 Data Type DefaultGraph Type Default Data Range Default Colors Copy number Heatmap -1.5 - 1.5 Blue to red Gene Expression Heatmap -1.5 - 1.5 Blue to red DNA Methylation Heatmap 0 to 1 (methylation score) Green . . . Different Data type and display option in IGV
  • 32.
    32 Red: Amplification Blue: Deletion SampleID Chromosomes IGV heatmap visualization of CNV events generated by CNV caller
  • 33.
  • 34.
    Thanks for yourkind attention 34

Editor's Notes

  • #5 Redon, R., et al. Global variation in copy number in the human genome. Reference for point 3 ) A copy number variation map of the human genome
  • #9 Agilent, Nimblegen: ArrayCGH SNP chips: Affymetrix, Illumina Sequencing : Sequencing data Precise characterization of breakpoints Chip Image: Affymetrix Inc. has unveiled its Genome-Wide Human SNP Array 6.0. The single microarray measures more than 1.8 million markers for genetic variation, enabling more powerful whole-genome association studies by genotyping more markers from more individuals. The array contains more than 900,000 single-nucleotide polymorphisms (SNPs) and more than 946,000 nonpolymorphic probes for the detection of copy number variation
  • #13 Agilent, Nimblegen: ArrayCGH SNP chips: Affymetrix, Illumina Sequencing : Chip Image: Affymetrix Inc. has unveiled its Genome-Wide Human SNP Array 6.0. The single microarray measures more than 1.8 million markers for genetic variation, enabling more powerful whole-genome association studies by genotyping more markers from more individuals. The array contains more than 900,000 single-nucleotide polymorphisms (SNPs) and more than 946,000 nonpolymorphic probes for the detection of copy number variation
  • #14 A survey of copy-number variation detection tools based on high-throughput sequencing data. Xi R1, Lee S, Park PJ.
  • #15 LogRratio:
  • #20 Some tools require case-control both the data for CNV detection Some tools use multiple samples as input Reference: Computational tools for copy number variation (CNV) detection using next-generation sequencing data: features and perspectives
  • #22 Add Evaluation of somatic copy number estimation tools for whole-exome sequencing data (check for image)
  • #23 http://www.nature.com/nrg/journal/v12/n5/full/nrg2958.html
  • #27 CNV visualization using IGV interface: (Heat Map + patient specific)