


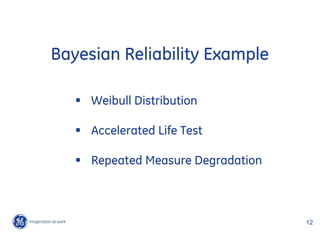
![Weibull Distribution
1
t t
T ~ weibull t , ,
exp t 1 exp t
Parameter of t p and sigma Parameter of original ME book
1
t p [ log(1 p)]
t p [ log(1 p)]
1
1
T ~ dweib x, v, v x v 1 exp x v
1
v Parameter used in WinBUGs
1
1
t p [ log(1 p)]
t [ log(1 p )]
p
14 14
/
GE Title or job number /
5/25/2012](https://image.slidesharecdn.com/generalbayesianmethodsfortypicalreliabilitydataanalysis14jun2012rev1-120612105802-phpapp02/85/General-bayesian-methods-for-typical-reliability-data-analysis-16-320.jpg)
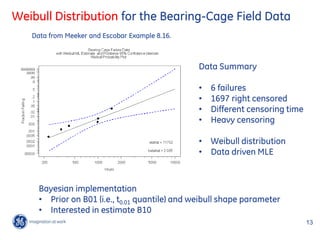
![OpenBUGs Implementation
model {
log.B01 ~ dunif(4.6051,8.5172)
B01 <- exp(log.B01) Priors
log.sigma ~ dnorm(-1.151,31.562)
sigma <- exp(log.sigma) log t0.01 ~ unif log 100 , log 5000
v <- 1/sigma log ~ dnorm mean 1.151,sd 0.178
lamda <- pow(B01,-v)*0.01005034 Informative prior: 99% of the probability of
between 0.2 and 0.5.
for (iii in 1:6){ 24 exact failures
x.exact[iii] ~ dweib(v,lamda)
}
for (jjj in 1:19){
dummy[jjj] <- 0 1697 right censored
dummy[jjj] ~ dloglik(logLike[jjj])
logLike[jjj] <- weight[jjj]*(-lamda*pow(lower[jjj],v))
observation in groups
}
}
15 15
/
GE Title or job number /
5/25/2012](https://image.slidesharecdn.com/generalbayesianmethodsfortypicalreliabilitydataanalysis14jun2012rev1-120612105802-phpapp02/85/General-bayesian-methods-for-typical-reliability-data-analysis-17-320.jpg)


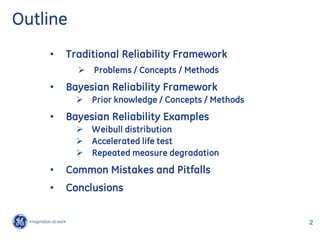
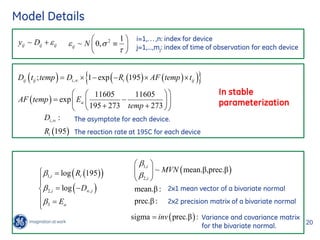
![OpenBUGs Implementation
model {
### For Temp=60C, i.e. 11605/(273+60) = 34.849850
B01.40 ~ dgamma(0.001,0.0001) ### 11 censored observations, and 9 exact observations
b1 ~ dnorm(0.65,294.8843) ## informative prior ### 11605/(273+60) - 11605/(273+40) = -2.226827
tau ~ dgamma(0.001,0.0001) mu.60 <- B01.40 + 2.326348*sigma - b1*2.226827
sigma <- 1/sqrt(tau) for (i in 1:11){
dummy.60[i] <- 0
b0 <- B01.40 + 2.326348*sigma - b1*37.076677 dummy.60[i] ~ dloglik(logLike.60[i])
B10.10 <- mu.10 - 1.281552*sigma logLike.60[i] <- ( 1-phi((8.517193-mu.60)*sqrt(tau)) )
}
### For Temp=10C, i.e. 11605/(273+10) = 41.007067 for (j in 1:9){
### All 30 observations are censored. Y.log.60[j] ~ dnorm(mu.60,tau)
### 11605/(273+10) - 11605/(273+40) = 3.93039 }
mu.10 <- B01.40 + 2.326348*sigma + b1*3.93039
for (i in 1:30){
dummy.10[i] <- 0 ### For Temp=80C, i.e. 11605/(273+80) = 32.875354
dummy.10[i] ~ dloglik(logLike.10[i]) ### 11 censored observations, and 9 exact observations
logLike.10[i] <- ( 1-phi((8.517193-mu.10)*sqrt(tau)) ) ### 11605/(273+80) - 11605/(273+40) = -4.201323
} mu.80 <- B01.40 + 2.326348*sigma - b1*4.201323
for (i in 1:1){
### For Temp=40C, i.e. 11605/(273+40) = 37.076677 dummy.80[i] <- 0
### 90 censored observations, and 10 exact observations dummy.80[i] ~ dloglik(logLike.80[i])
### 11605/(273+40) - 11605/(273+40) = 0 logLike.80[i] <- ( 1-phi((8.517193-mu.80)*sqrt(tau)) )
mu.40 <- B01.40 + 2.326348*sigma }
for (i in 1:90){ for (j in 1:14){
dummy.40[i] <- 0 Y.log.80[j] ~ dnorm(mu.80,tau)
dummy.40[i] ~ dloglik(logLike.40[i]) }
logLike.40[i] <- ( 1-phi((8.517193-mu.40)*sqrt(tau)) )
} }
for (j in 1:10){
Y.log.40[j] ~ dnorm(mu.40,tau)
}
18 18
/
GE Title or job number /
5/25/2012](https://image.slidesharecdn.com/generalbayesianmethodsfortypicalreliabilitydataanalysis14jun2012rev1-120612105802-phpapp02/85/General-bayesian-methods-for-typical-reliability-data-analysis-20-320.jpg)

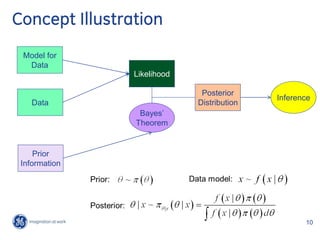
![OpenBUGs Implementation
*(1-exp(-R195[iii+7]*data[231+(iii-1)*17+jjj,2]))
model { data[231+(iii-1)*17+jjj,1] ~ dnorm(mu.195[(iii-1)*17+jjj],tau)
}
for(iii in 1:34){ }
bbb[iii,1:2] ~ dmnorm(mean.bbb[1:2],prec.bbb[1:2,1:2])
Dinf[iii] <- -exp(bbb[iii,2])
R195[iii] <- exp(bbb[iii,1]) #### Data and Model for Temp=237 ###
} #### 11605/(195+273) - 11605/(237+273) = 2.042107
#### Index shift for data is: 33*7 + 12*17 = 435
sigma[1:2,1:2] <- inverse(prec.bbb[1:2,1:2]) #### Index shift for group is: 7+12=19
mean.bbb[1:2] ~ dmnorm(M[1:2], A[1:2,1:2]) for(iii in 1:15){
prec.bbb[1:2,1:2] ~ dwish(B[1:2,1:2 ], 2) for(jjj in 1:9){
mu.237[(iii-1)*9+jjj] <- Dinf[iii+19]
b3 ~ dnorm(0.7,663.5) *(1-exp(-R195[iii+19]*exp(b3*2.042107)
tau ~ dgamma(0.001,0.001) *data[435+(iii-1)*9+jjj,2]) )
sigma.error <- 1/sqrt(tau) data[435+(iii-1)*9+jjj,1] ~ dnorm(mu.237[(iii-1)*9+jjj],tau)
}
#### Data and Model for Temp=150C ### }
#### 11605/(195+273) - 11605/(150+273) = -2.637980
for(iii in 1:7){ }
Priors
for(jjj in 1:33){
mu.150[(iii-1)*33+jjj] <- Dinf[iii]*(1-exp(-R195[iii] 0 106 0
mean.β ~ dmnorm , 6
*exp(-b3*2.637980) *data[(iii-1)*33+jjj,2]) ) 0
data[(iii-1)*33+jjj,1] ~ dnorm(mu.150[(iii-1)*33+jjj],tau) 0 10
}
} 103 0
prec.β ~ dwish
0 103
,2
#### Data and Model for Temp=195 ###
#### 11605/(195+273) - 11605/(195+273) = 0
#### Index shift for data is: 33*7=231 ~ dgamma 0.001, 0.001
#### Index shift for group is: 7
3 ~ dnorm 0.7, 663.5
for(iii in 1:12){
for(jjj in 1:17){
mu.195[(iii-1)*17+jjj] <- Dinf[iii+7] Informative prior: put 99% of the 21 21
/
probability between 0.6 and 0.8 for 35/25/2012
.
GE Title or job number /](https://image.slidesharecdn.com/generalbayesianmethodsfortypicalreliabilitydataanalysis14jun2012rev1-120612105802-phpapp02/85/General-bayesian-methods-for-typical-reliability-data-analysis-23-320.jpg)


The document summarizes a Bayesian webinar on general Bayesian methods for reliability data analysis. It provides an outline of the webinar covering traditional vs Bayesian reliability frameworks, examples of applying Bayesian methods to Weibull distribution, accelerated life test data and repeated measure degradation data. OpenBUGS code is presented for the examples. The webinar aims to illustrate how Bayesian methods allow incorporating prior knowledge and provide advantages over traditional methods in certain applications.