Download to read offline

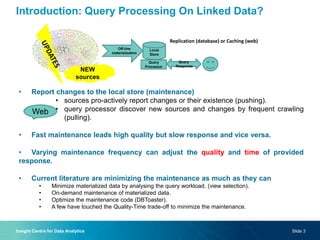
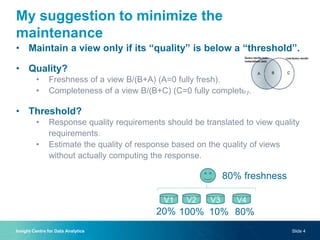
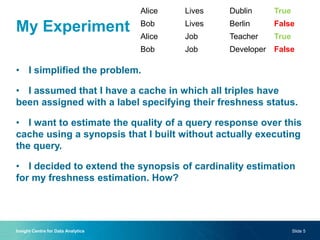

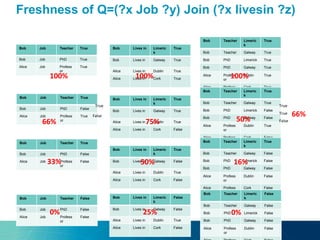
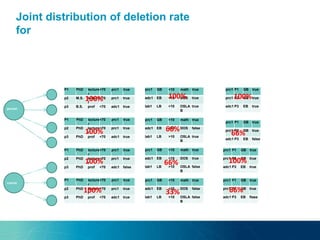
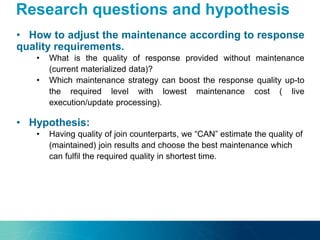
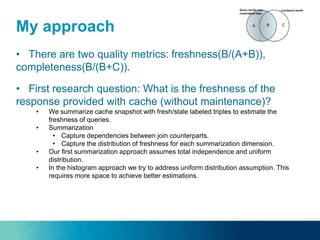

The document discusses a novel approach to on-demand maintenance of views in dynamic linked data sets, focusing on optimizing response quality based on freshness and completeness. It proposes using summaries and probabilistic graphical models to estimate query freshness without executing full maintenance, aiming to reduce unnecessary updates and improve response times. The suggested methodology emphasizes capturing data distribution and dependencies to enhance accuracy in freshness estimation.