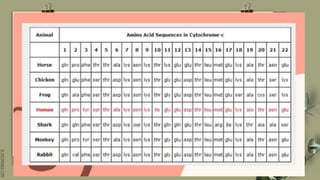
SLIDESMANIA.COM
EVOLUTIONARY
RELATIONSHIPS
OF ORGANISMS
SLIDESMANIA.COM
 Recognize how comparisons of similarities
and differences can suggest evolutionary
relationships.
 Explain the significance of using multiple
lines of evidence to identify evolutionary
relationships.
 Infer the degree of relationships and
among organisms based on the amino acid
sequence in the cytochrome c, molecule.
SLIDESMANIA.COM
INFERRING RELATIONSHIPS FROM EVIDENCES OF
EVOLUTION
 Living things share some biomolecules which may be
used to prove relationships. These chemicals include DNA
and proteins. The building blocks of these chemicals may
be analyzed to show similarities and differences among
organisms. The more similarities, the closer the
relationships.
SLIDESMANIA.COM
MOLECULAR COMPARISONS
One of these is the protein cytochrome-c, an important
enzyme found in virtually all organisms. It is a highly
conserved protein which functions in the electron transport
chain system of the mitochondria which is needed for the
release of energy from food. It also performs a role in
apoptosis (programmed cell death) by being released into
the cytosol activating the events of cell death.
SLIDESMANIA.COM
MOLECULAR COMPARISONS
There are 104 amino acids in the human cytochrome c, 37
of which have been found at the same position in every
cytochrome c that has been sequenced. The molecules are
assumed to have descended from a primitive microbial
cytochrome that existed over two billion years ago.
SLIDESMANIA.COM
SLIDESMANIA.COM
AMINO ACID WHEEL
SLIDESMANIA.COM
A cladogram is a diagram used to represent a hypothetical
relationship between groups of animals, called a phylogeny.
A cladogram is used by a scientist studying phylogenetic
systematics to visualize the groups of organisms being
compared, how they are related, and their most common
ancestors.
SLIDESMANIA.COM
 A phylogeny is a hypothetical relationship between groups
of organisms being compared. A phylogeny is often
depicted using a phylogenetic tree.
SLIDESMANIA.COM
A phylogenetic tree is a diagram used to reflect evolutionary
relationships among organisms or groups of organisms.
Scientists consider phylogenetic trees to be a hypothesis of
the evolutionary past since one cannot go back to confirm the
proposed relationships. In other words, a “tree of life” can be
constructed to illustrate when different organisms evolved and
to show the relationships among different organisms
SLIDESMANIA.COM
SLIDESMANIA.COM
Scientists call such trees rooted, which means there is a single
ancestral lineage (typically drawn from the bottom or left) to
which all organisms represented in the diagram relate. Notice in
the rooted phylogenetic tree that the three domains— Bacteria,
Archaea, and Eukarya—diverge from a single point and branch
off. The small branch that plants and animals (including humans)
occupy in this What’s is it diagram shows how recent and
miniscule these groups are compared with other organisms.
Unrooted trees don’t show a common ancestor but do show
relationships among species.
SLIDESMANIA.COM
SLIDESMANIA.COM
SLIDESMANIA.COM
ACTIVITY 1: DIRECTION: OBSERVE AND WRITE WHICH CHARACTERISTICS ARE
MORE OR LESS COMMONLY HELD AMONG THE GIVEN ORGANISMS. WRITE YOUR
CONCLUSION ABOUT YOUR FINDINGS.
SLIDESMANIA.COM
Clearly, animals know more
than we think, and think a
great deal more than we know.
― Irene M. Pepperberg
SLIDESMANIA.COM
Thank
you!
Do you have any
questions?

GEN BIO 2 LESSON 8.pptx

  • 1.
  • 2.
    SLIDESMANIA.COM  Recognize howcomparisons of similarities and differences can suggest evolutionary relationships.  Explain the significance of using multiple lines of evidence to identify evolutionary relationships.  Infer the degree of relationships and among organisms based on the amino acid sequence in the cytochrome c, molecule.
  • 3.
    SLIDESMANIA.COM INFERRING RELATIONSHIPS FROMEVIDENCES OF EVOLUTION  Living things share some biomolecules which may be used to prove relationships. These chemicals include DNA and proteins. The building blocks of these chemicals may be analyzed to show similarities and differences among organisms. The more similarities, the closer the relationships.
  • 4.
    SLIDESMANIA.COM MOLECULAR COMPARISONS One ofthese is the protein cytochrome-c, an important enzyme found in virtually all organisms. It is a highly conserved protein which functions in the electron transport chain system of the mitochondria which is needed for the release of energy from food. It also performs a role in apoptosis (programmed cell death) by being released into the cytosol activating the events of cell death.
  • 5.
    SLIDESMANIA.COM MOLECULAR COMPARISONS There are104 amino acids in the human cytochrome c, 37 of which have been found at the same position in every cytochrome c that has been sequenced. The molecules are assumed to have descended from a primitive microbial cytochrome that existed over two billion years ago.
  • 6.
  • 7.
  • 8.
    SLIDESMANIA.COM A cladogram isa diagram used to represent a hypothetical relationship between groups of animals, called a phylogeny. A cladogram is used by a scientist studying phylogenetic systematics to visualize the groups of organisms being compared, how they are related, and their most common ancestors.
  • 9.
    SLIDESMANIA.COM  A phylogenyis a hypothetical relationship between groups of organisms being compared. A phylogeny is often depicted using a phylogenetic tree.
  • 10.
    SLIDESMANIA.COM A phylogenetic treeis a diagram used to reflect evolutionary relationships among organisms or groups of organisms. Scientists consider phylogenetic trees to be a hypothesis of the evolutionary past since one cannot go back to confirm the proposed relationships. In other words, a “tree of life” can be constructed to illustrate when different organisms evolved and to show the relationships among different organisms
  • 11.
  • 12.
    SLIDESMANIA.COM Scientists call suchtrees rooted, which means there is a single ancestral lineage (typically drawn from the bottom or left) to which all organisms represented in the diagram relate. Notice in the rooted phylogenetic tree that the three domains— Bacteria, Archaea, and Eukarya—diverge from a single point and branch off. The small branch that plants and animals (including humans) occupy in this What’s is it diagram shows how recent and miniscule these groups are compared with other organisms. Unrooted trees don’t show a common ancestor but do show relationships among species.
  • 13.
  • 14.
  • 15.
    SLIDESMANIA.COM ACTIVITY 1: DIRECTION:OBSERVE AND WRITE WHICH CHARACTERISTICS ARE MORE OR LESS COMMONLY HELD AMONG THE GIVEN ORGANISMS. WRITE YOUR CONCLUSION ABOUT YOUR FINDINGS.
  • 16.
    SLIDESMANIA.COM Clearly, animals knowmore than we think, and think a great deal more than we know. ― Irene M. Pepperberg
  • 17.