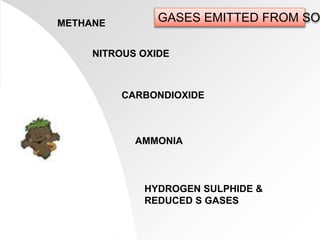
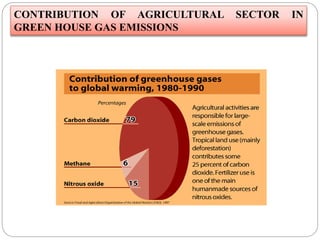
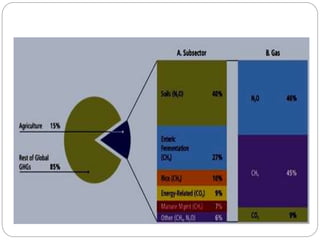
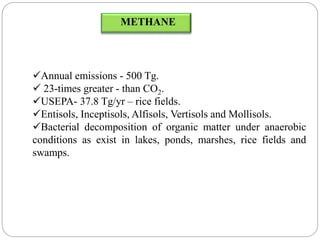
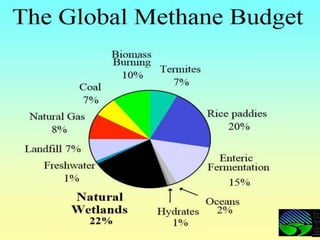
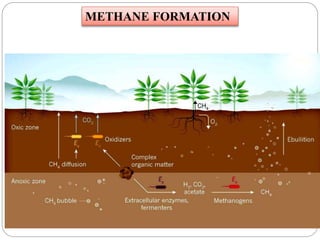
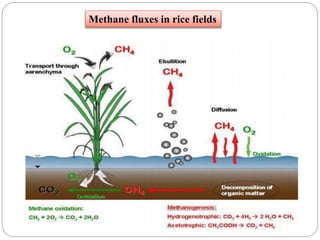
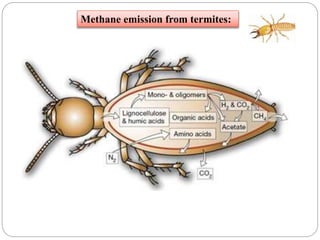
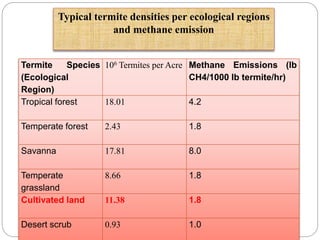
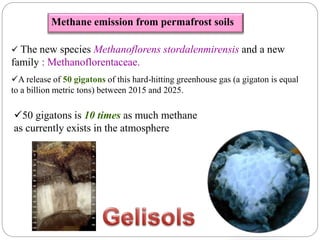
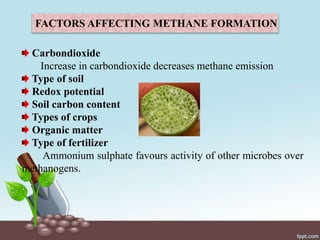
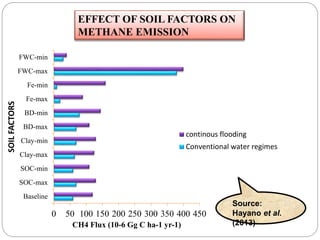
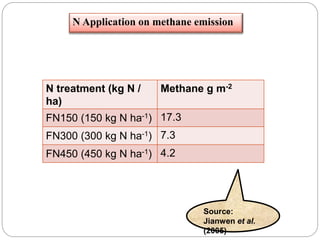
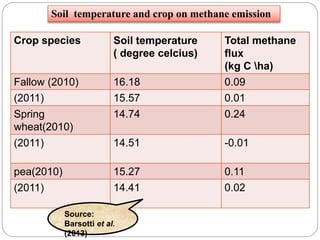
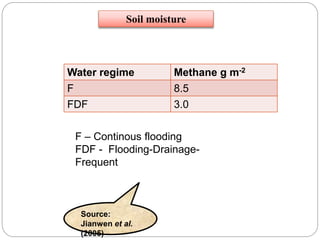
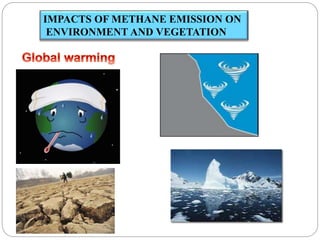
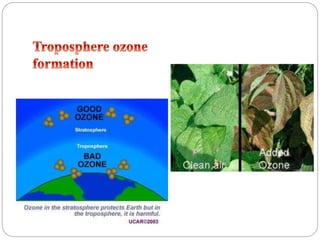
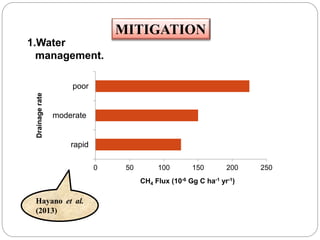
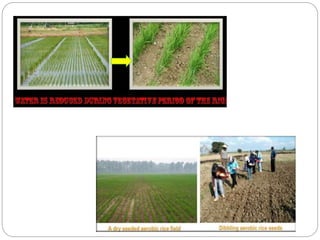
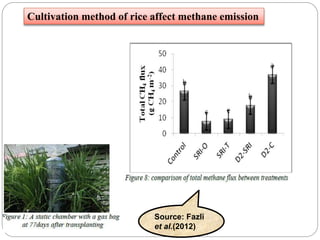
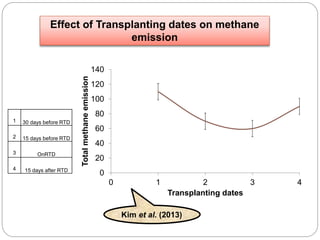
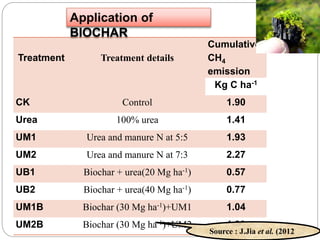
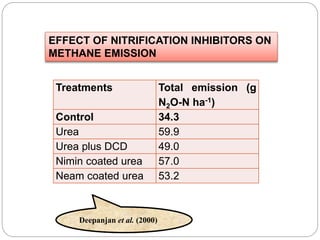
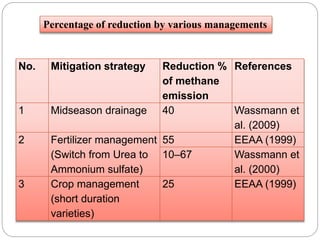
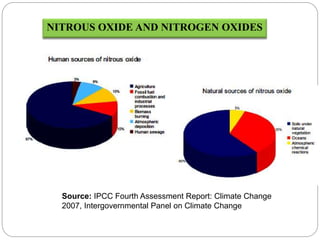
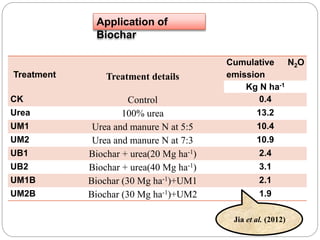
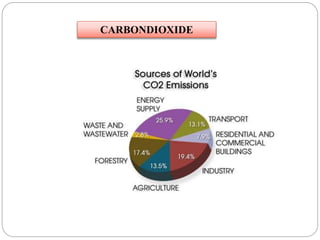
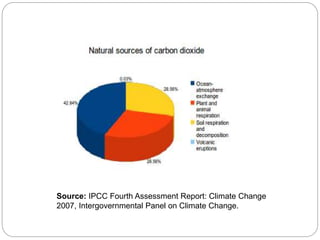
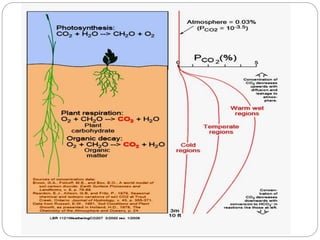
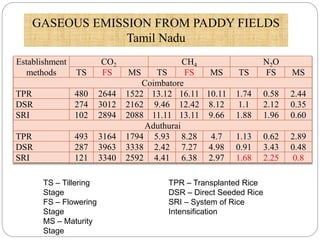
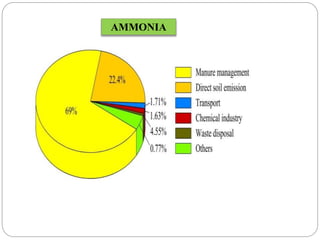
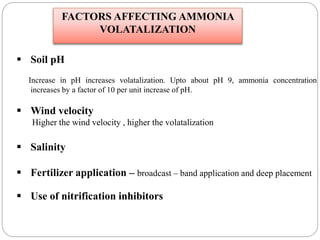
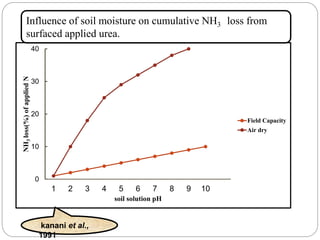
GASEOUS EMISSION FROM
AGRICULTURAL FIELDS, ITS EFFECTS
AND MITIGATION
Student
INIYALAKSHIMI.B.R
13-515-902
Chairman
Dr. M.BASKAR
Asst. Prof.(SS&AC).
Members
Dr. P.BALASUBRAMANIAM
Prof. & Head (SS&AC)
Dr. T.RAMESH
Asst. Prof. (AGR)
INTRODUCTION
o Ambient air - nitrogen (78%), oxygen (21%), Carbondioxide
(0.03%) and other inert gases.
o Every day, we breathe - 23,000 times, inhaling about 2000 litres of
air along with wide variety of pollutants released into the air by
automobiles, factories, power plants and other sources.
o Number of harmful gases are being added to atmosphere which
adversely affect air quality and make it unfit for living organisms.
o Rise in concentration of green house gases has led to enhanced
greenhouse effect resulting in global warming and global climate
change.
• Agricultural fields also contributes majorly in the
emission of these gases.
•Soil contains air, which differs from atmospheric
air concentration.
• The percentage of carbondioxide which is 10
times higher (0.3%) than the atmospheric
carbondioxide.
METHANE
NITROUS OXIDE
CARBONDIOXIDE
AMMONIA
HYDROGEN SULPHIDE &
REDUCED S GASES
GASES EMITTED FROM SO
CONTRIBUTION OF AGRICULTURAL SECTOR IN
GREEN HOUSE GAS EMISSIONS
Annual emissions - 500 Tg.
 23-times greater - than CO2.
USEPA- 37.8 Tg/yr – rice fields.
Entisols, Inceptisols, Alfisols, Vertisols and Mollisols.
Bacterial decomposition of organic matter under anaerobic
conditions as exist in lakes, ponds, marshes, rice fields and
swamps.
METHANE
METHANE FORMATION
MICROBES INVOLVED
The methanogenic bacteria are anaerobes belonging to the
genera Methanosarcina, Methanobacillus, Methanobacterium,
Methanospirillum and Methanococcus.
Some other methanogenic bacteria reduce carbon monoxide
to methane, while some metabolize methyl mercaptan and
dimethyl sulphide to CO2 and CH4.
Methane fluxes in rice fields
Methane emission from termites:
Typical termite densities per ecological regions
and methane emission
Termite Species
(Ecological
Region)
106 Termites per Acre Methane Emissions (lb
CH4/1000 lb termite/hr)
Tropical forest 18.01 4.2
Temperate forest 2.43 1.8
Savanna 17.81 8.0
Temperate
grassland
8.66 1.8
Cultivated land 11.38 1.8
Desert scrub 0.93 1.0
Methane emission from permafrost soils
 The new species Methanoflorens stordalenmirensis and a new
family : Methanoflorentaceae.
A release of 50 gigatons of this hard-hitting greenhouse gas (a gigaton is equal
to a billion metric tons) between 2015 and 2025.
50 gigatons is 10 times as much methane
as currently exists in the atmosphere
FACTORS AFFECTING METHANE FORMATION
Carbondioxide
Increase in carbondioxide decreases methane emission
Type of soil
Redox potential
Soil carbon content
Types of crops
Organic matter
Type of fertilizer
Ammonium sulphate favours activity of other microbes over
methanogens.
0 50 100 150 200 250 300 350 400 450
Baseline
SOC-max
SOC-min
Clay-max
Clay-min
BD-max
BD-min
Fe-max
Fe-min
FWC-max
FWC-min
CH4 Flux (10-6 Gg C ha-1 yr-1)
SOILFACTORS
continous flooding
Conventional water regimes
Source:
Hayano et al.
(2013)
EFFECT OF SOIL FACTORS ON
METHANE EMISSION
N treatment (kg N /
ha)
Methane g m-2
FN150 (150 kg N ha-1) 17.3
FN300 (300 kg N ha-1) 7.3
FN450 (450 kg N ha-1) 4.2
Source:
Jianwen et al.
(2005)
N Application on methane emission
Crop species Soil temperature
( degree celcius)
Total methane
flux
(kg C ha)
Fallow (2010) 16.18 0.09
(2011) 15.57 0.01
Spring
wheat(2010)
14.74 0.24
(2011) 14.51 -0.01
pea(2010) 15.27 0.11
(2011) 14.41 0.02
Source:
Barsotti et al.
(2013)
Soil temperature and crop on methane emission
Water regime Methane g m-2
F 8.5
FDF 3.0
F – Continous flooding
FDF - Flooding-Drainage-
Frequent
Source:
Jianwen et al.
(2005)
Soil moisture
IMPACTS OF METHANE EMISSION ON
ENVIRONMENT AND VEGETATION
1.Water
management.
Hayano et al.
(2013)
0 50 100 150 200 250
rapid
moderate
poor
CH4 Flux (10-6 Gg C ha-1 yr-1)
Drainagerate
MITIGATION
Cultivation method of rice affect methane emission
Source: Fazli
et al.(2012)
0
20
40
60
80
100
120
140
0 1 2 3 4
Totalmethaneemission
Transplanting dates
1 30 days before RTD
2 15 days before RTD
3 OnRTD
4 15 days after RTD
Effect of Transplanting dates on methane
emission
Kim et al. (2013)
Treatment Treatment details
Cumulative
CH4
emission
Kg C ha-1
CK Control 1.90
Urea 100% urea 1.41
UM1 Urea and manure N at 5:5 1.93
UM2 Urea and manure N at 7:3 2.27
UB1 Biochar + urea(20 Mg ha-1) 0.57
UB2 Biochar + urea(40 Mg ha-1) 0.77
UM1B Biochar (30 Mg ha-1)+UM1 1.04
UM2B Biochar (30 Mg ha-1)+UM2 1.29
Application of
BIOCHAR
Source : J.Jia et al. (2012
Rice cultivars.
Fertilization and other cultivation
Ricebased cropping systems
Treatments Total emission (g
N2O-N ha-1)
Control 34.3
Urea 59.9
Urea plus DCD 49.0
Nimin coated urea 57.0
Neam coated urea 53.2
Deepanjan et al. (2000)
EFFECT OF NITRIFICATION INHIBITORS ON
METHANE EMISSION
No. Mitigation strategy Reduction %
of methane
emission
References
1 Midseason drainage 40 Wassmann et
al. (2009)
2 Fertilizer management
(Switch from Urea to
Ammonium sulfate)
55 EEAA (1999)
10–67 Wassmann et
al. (2000)
3 Crop management
(short duration
varieties)
25 EEAA (1999)
Percentage of reduction by various managements
NITROUS OXIDE AND NITROGEN OXIDES
Source: IPCC Fourth Assessment Report: Climate Change
2007, Intergovernmental Panel on Climate Change
NITRIFICATION
Nitrification is a oxidation process which involves oxidation of
ammonium ions to nitrate by nitrifying microorganisms.
DENITRIFICATION
Denitrification is the reduction process of NO3
- to N2, mediated
by facultative anaerobic bacteria, which correspond to 0.1-5.0%
of the total bacteria population in the soil (Moreira & Siqueira
2006).
Production of nitrogen gases
The denitrifiers are facultative aerobes such as Pseudomonas
denitrificans, Paracoccus denitrificans and Thiobacillus
denitrificans.
N2O is also formed by the oxidation of ammonium by the autotrophic
nitrifier, Nitrosomonas europea, by the reduction of nitrate by
heterotrophic bacteria such as B.subtilis, E.coli and Aerobacter
aerogens and
By the reduction of nitrite by soil fungi such as Aspergillus flavus,
Penicillium atrovelltum, Fusarium oxysporum and F.solani.
Microbes involved
 Chemical decomposition of nitrite (chemidenitrification) and hydroxylamine
oxidation (NH2OH).
 Chemidenitrification - decomposition of NO2
- - neutral and acidic soils,
causing volatilization and fixation of NO2
- in the soil organic matter.
The amount of N2O produced this way is almost negligible.
 Hydroxylamine - intermediate compound in the oxidation of NH4
+ to NO3
-
that can produce much more N2O than the chemidenitrification process.
 In neutral and acidic soils, N2O is the main product of the NH2OH
oxidation, due to its reaction with Mn and Fe, while in calcareous soils (pH
from 7.8 to 8.2) the NH2OH reacts with CaCO3 and the main product is N2.
Source: Bremner et al.
1980
Gas emitted from Non-biological process
Factors affecting emission:
1) N application
0
10
20
30
40
50
Before irrigation After irrigation
N2Oflux(µg/m2/hr)
Unfertilized
Fertilized
Source: Su
et al. (1995)
Source: Jianwen
et al. (2005)
Water regime Nitrous oxide mg
m-2
F 6
FDF 155
F – Continous flooding
FDF - Flooding-Drainage-Frequent
Soil moisture on nitrous oxide emission
Wetting
Soil pH
Gas diffusion and Oxygen – compaction, fine texture,
surface sealing- limit gas diffusion- denitrification -
reconsuming. Limited oxygen- nitrification – produces nitrous
oxide.
Relief position
Soil characteristics
Influence of Available carbon
0
100
200
300
400
0 100 200 300 400
Denitrification(ppm
N2O+N2)
Organic C(ppm)
Sainz Rozas et al.
(2001)
AGRICULTURAL MANAGEMENT FACTORS
Crop type
Mosquera et al. (1992)
0
1
2
3
4
5
6
7
8
Maize Grass land
N2OemissionKgha-1
Control
Mineral fertilizer
Cattle slurry,
surface spreading
Cattle slurry,
Narrow-band
application
Fertilizer management
Soil and crop management – uncultivated soil
Residues quality – C:N
IMPACTS ON ENVIRONMENT
i) Global warming:
ii)Formation of Acidrain
iii) Formation of secondary pollutant ozone:
Prioritizing the use of low N2O emission fertilizers
Managing the N-fertilizer application – deep placement, split
application.
Managing the soil chemistry and microbiology – lime in acid soil
Slow release fertilizers
Site specific nutrient management techniques
Tillage management – no till, reduced tillage
Water management- drip, sprinkler, soil moisture sensors
MITIGATION
Treatments Cumulative N2O emission (mg N2O
m-2)
Chemical Fertilizer
(CF)
30.2
Lime Nitrogen (LN) 10.7
CF with Dicyanamide
(CFD)
24.3
Yamamoto et al. (2013)
TABLE: Cumulative nitrous oxide emission over 63 days in each of the plots fertilized
with CF, LN, CFD
Form a nitrification inhibitor (dicyanamide, DCD)
during the decomposition process of lime-nitrogen
Lime-nitrogen application
Treatment Treatment details
Cumulative N2O
emission
Kg N ha-1
CK Control 0.4
Urea 100% urea 13.2
UM1 Urea and manure N at 5:5 10.4
UM2 Urea and manure N at 7:3 10.9
UB1 Biochar + urea(20 Mg ha-1) 2.4
UB2 Biochar + urea(40 Mg ha-1) 3.1
UM1B Biochar (30 Mg ha-1)+UM1 2.1
UM2B Biochar (30 Mg ha-1)+UM2 1.9
Jia et al. (2012)
Application of
Biochar
CARBONDIOXIDE
Source: IPCC Fourth Assessment Report: Climate Change
2007, Intergovernmental Panel on Climate Change.
SOURCES OF CARBONDIOXIDE FROM SOIL:
Fermentation
Tricarboxylic acid (TCA) cycle
Root respiration
Rhizosphere respiration
Soil animals
Biome Below ground
mortmass
decomposition
Litter
decompositi
on
SOM
decompositi
on
Root
respiratio
n
Polar desert 0.2 0.2 0.1 0.2
Tundra 194.4 119.8 18.1 108.6
Forest tundra 248.2 340 17.0 210.8
Taiga 476 996 42.0 672.7
Mixed-
decidious
168 246.4 11.2 243.0
Forest-steppe 341 233.2 11.0 221.7
Steppe 549 182.5 9.4 232.1
Subtropical
woodland
2.6 2.2 0.1 2.3
Desert and
semi desert
487 182.7 5.2 215.8
Carbondioxide emission from different biomes
Kolchugin et al. (1995)
Effect of soil moisture on carbondioxide emission
David Risk et al. (2002)
Effect of soil temperature on
carbondioxide production
David Risk et al. (2002)
a
d
bcdab
d bcd
abc
cd
d
0
1
2
3
4
5
A G F
cumulativeCO2production
gCO2kg-1d.s.12week
N0
N30
N150
Influence of N application
Kong et al.
2013
IMPACTS
Tropospheric ozone formation
Global warming
Sequestration of C in soil
•Reduced tillage and no tillage practices
•Promoting agro-forestry, Afforetration.
•Increasing the passive or inert fraction of soil organic pool
•Organic farming
•Precision farming
Establishment
methods
CO2 CH4 N2O
TS FS MS TS FS MS TS FS MS
Coimbatore
TPR 480 2644 1522 13.12 16.11 10.11 1.74 0.58 2.44
DSR 274 3012 2162 9.46 12.42 8.12 1.1 2.12 0.35
SRI 102 2894 2088 11.11 13.11 9.66 1.88 1.96 0.60
Aduthurai
TPR 493 3164 1794 5.93 8.28 4.7 1.13 0.62 2.89
DSR 287 3963 3338 2.42 7.27 4.98 0.91 3.43 0.48
SRI 121 3340 2592 4.41 6.38 2.97 1.68 2.25 0.8
GASEOUS EMISSION FROM PADDY FIELDS
Tamil Nadu
TS – Tillering
Stage
FS – Flowering
Stage
MS – Maturity
Stage
TPR – Transplanted Rice
DSR – Direct Seeded Rice
SRI – System of Rice
Intensification
AMMONIA
 Soil pH
Increase in pH increases volatalization. Upto about pH 9, ammonia concentration
increases by a factor of 10 per unit increase of pH.
 Wind velocity
Higher the wind velocity , higher the volatalization
 Salinity
 Fertilizer application – broadcast – band application and deep placement
 Use of nitrification inhibitors
FACTORS AFFECTING AMMONIA
VOLATALIZATION
0
10
20
30
40
1 2 3 4 5 6 7 8 9 10
NH3loss(%)ofappliedN
soil solution pH
Field Capacity
Air dry
kanani et al.,
1991
Influence of soil moisture on cumulative NH3 loss from
surfaced applied urea.
0
500
1000
1500
2000
2500
3000
3500
Spring Summer Fall Winter
Kgammonia
Season
Emissions from soil
Emissions from lagoons
Roelle et
al. (2002)
Diurnal and seasonal variability
kanani et al.,
1991
Effect of soil temperature on ammonia emission
Roelle et
al. (2002)
Effect of over grazing on ammonia volatilization
Yunhai
Zhang et al
Impacts
 Eutrophication
 Soil acidification
 Fertilization of vegetation
IMPACTS ON VEGETATION
Plants, trees and crops - water. large release of
ammonia occurs the vapor will likely burn the
leaves of nearby downwind vegetation.
Excess exposure leads to death of sensitive plants. Especially lichens, mosses,etc
Shift in dominance from mosses, lichens and ericoids (heath species) towards
grasses like Deschampsia flexuosa, Molinia caerulea and ruderal
species, e.g. Chamerion angustifolium, Rumex acetosella, Rubus idaeus.
MITIGATION
Slow release N fertilizers, Urease and nitrification
inhibitors :
Slow release fertilizers such as urea super granules (USG),
sulphur coated urea, neem cake coated urea, neem oil
coated urea, etc can be used to minimize the ammonia
volatilization.
Method and time of fertilizer application
Site-specific N management
Fertigation and foliar application
Types of fertilizers
Emission factors based on fertilizer
application (kg-NH3 / Mg-N)
Fertilizer Group I
soils
Group II
soils
Group III
Soils
Anhydrous ammonia 48 48 48
Nitrogen solutions (urea &
AN)
97 97 97
Urea 242 182 182
Diammonium phosphate 61 61 61
Ammonium nitrate (AN) 36 24 12
Liquidammonium
polyphosphate
61 61 61
Aqueous ammonia 97 97 97
Ammonium thiosulfate 30 30 30
Calcium ammonium nitrate 36 24 12
Potassium nitrate 12 12 12
Monoammonium phosphate 61 61 61
Ammonium sulfate 182 121 61
AMMONIA EMISSION FROM DIFFERENT
FERTILIZER APPLICATION
Source: William
Battye et al.
(2004)
SULPHIDE AND SULPHUR GASES
The annual rate of sulfur emission
associates with human activities has
been estimated of about 80 Tg S .
Aerated soils the emissions were
between 0.8 and 27 μg m−2 h−1 H2S
REDUCED S GASES FROM SOIL
 Hydrogen sulfide (H2S)
 Carbonyl sulfide (COS)
 Carbon disulfide (CS2)
 Methyl mercaptan (CH3SH)
 Dimethyl sulfide (DMS)and
 Dimethyl disulfide (DMDS)
 Sulphur dioxide – In ASS –only trace amount.
ORGANISMS INVOLVED IN SULPHATE REDUCTION
 Desulfotomaculatum (3species),
 Desulfovibrio (5 species),
 Desulfobacterium,
 Desulfococcus,
 Desulfosarcina,
 Desulforomonas, and
 Desulfomonas.
Other heterotropic organisms include some bacteria actinomycetes,
fungi, algae (Clostridium nitrificans, Aspergillus niger, A.nidulans,
Pencilium chyrsogenum, chlorella pyrenecidosa, etc.)
FACTORS FAVOURING SULPHATE REDUCTION
Organic matter – heterotropic microbes
C:S ratio
Presence of nitrogen and sulphur source
Presence of iron and manganese
Application of fertilizers and manures
Redox potential
Reaction Redox potential
O2-H2O +380 to +320
NO3-N2. Mn4+-Mn2+ +280 to +220
Fe3+-Fe2+ +180 to +150
SO4
2—S2- -120 to -180
CO2-CH4 -200to -280
Gas
During cropping After harvest
N0-N Mineral Straw N0-N Mineral Straw
DMS 3.9 5.7 5.4 0.6 1.1 0.7
COS -0.2 -0.5 -0.2 0.5 0.3 2.1
CS2 0.4 0.4 0.3 0.4 0.7 1.7
Total 4.1 5.7 5.5 1.5 2.7 4.5
Source: K.Kanda et al. (1992).
Emission of reduced sulphur gases under mineral fertilizer without
nitrogen(N0-N), mineral fertilizer(mineral), mineral fertilizer with rice
straw application(straw).
Influence of mineral fertilizer on sulphide gas
emission
IMPACTS
H2S at low levels can increase plant growth
“fertilizer” effect
concentration and time of exposure increased there is a decrease
in shoot height and root length ,
 Decrease in fresh and dry weight,
 Decrease in chlorophyll a,
 Decrease in carbohydrase ,
 Reduced activity of nitrate reductase and glutamate dehydrogenase,
 Increase in peroxidase activity,
 Increase in cysteine,
 Decrease in serine ,
 Increase in amino-N.
Occurrence of rotten egg smell and root discoloration
have been observed.
Soil and water samples containing high sulphur contents
of 25 and 65 ppm in Thiruvaiaru and 23 and 60 ppm in
Kumbakonam blocks respectively.
The H2S symptoms are normally noticed in Cauvery Old
Delta (Thanjavur,Thiruvarur and Nagapattinam) in kuruvai
season during the years of poor rainfall coupled with
delayed receipt of canal water.
H2S injury in Cauvery Delta Zone
Source: ARW for Rice
(2013)
MITIGATION
• AWD for soil aeration
• Inter cultivation with cono weeder,
• Summer ploughing
• Split application and use of high MOP @ 43 kg/ha.
• Avoid the use of high sulphate containing water for irrigation.
• Drain the water fully and apply 10kg urea+10 kg potash
evenly. After 2 days irrigate the field with small amount of
water. And repeat the same in 7-10 days interval.
• Apply iron containing fertilizers – sulphur precipitates as
ferrous sulphate.
• If the canal water contains high amount of sulphur
compounds, store it in ponds and then irrigate through
furrows, so that some amount of sulphur will evaporate
NOBLE GASES?
THEY TOO EMITTED FROM SOIL…………………….
SOUL OF INFINITE LIFE
CONCLUSION
Gaseous emission from agricultural fields

Gaseous emission from agricultural fields

  • 1.
    GASEOUS EMISSION FROM AGRICULTURALFIELDS, ITS EFFECTS AND MITIGATION Student INIYALAKSHIMI.B.R 13-515-902 Chairman Dr. M.BASKAR Asst. Prof.(SS&AC). Members Dr. P.BALASUBRAMANIAM Prof. & Head (SS&AC) Dr. T.RAMESH Asst. Prof. (AGR)
  • 2.
    INTRODUCTION o Ambient air- nitrogen (78%), oxygen (21%), Carbondioxide (0.03%) and other inert gases. o Every day, we breathe - 23,000 times, inhaling about 2000 litres of air along with wide variety of pollutants released into the air by automobiles, factories, power plants and other sources. o Number of harmful gases are being added to atmosphere which adversely affect air quality and make it unfit for living organisms. o Rise in concentration of green house gases has led to enhanced greenhouse effect resulting in global warming and global climate change.
  • 3.
    • Agricultural fieldsalso contributes majorly in the emission of these gases. •Soil contains air, which differs from atmospheric air concentration. • The percentage of carbondioxide which is 10 times higher (0.3%) than the atmospheric carbondioxide.
  • 4.
  • 5.
    CONTRIBUTION OF AGRICULTURALSECTOR IN GREEN HOUSE GAS EMISSIONS
  • 7.
    Annual emissions -500 Tg.  23-times greater - than CO2. USEPA- 37.8 Tg/yr – rice fields. Entisols, Inceptisols, Alfisols, Vertisols and Mollisols. Bacterial decomposition of organic matter under anaerobic conditions as exist in lakes, ponds, marshes, rice fields and swamps. METHANE
  • 9.
  • 10.
    MICROBES INVOLVED The methanogenicbacteria are anaerobes belonging to the genera Methanosarcina, Methanobacillus, Methanobacterium, Methanospirillum and Methanococcus. Some other methanogenic bacteria reduce carbon monoxide to methane, while some metabolize methyl mercaptan and dimethyl sulphide to CO2 and CH4.
  • 11.
    Methane fluxes inrice fields
  • 12.
  • 13.
    Typical termite densitiesper ecological regions and methane emission Termite Species (Ecological Region) 106 Termites per Acre Methane Emissions (lb CH4/1000 lb termite/hr) Tropical forest 18.01 4.2 Temperate forest 2.43 1.8 Savanna 17.81 8.0 Temperate grassland 8.66 1.8 Cultivated land 11.38 1.8 Desert scrub 0.93 1.0
  • 14.
    Methane emission frompermafrost soils  The new species Methanoflorens stordalenmirensis and a new family : Methanoflorentaceae. A release of 50 gigatons of this hard-hitting greenhouse gas (a gigaton is equal to a billion metric tons) between 2015 and 2025. 50 gigatons is 10 times as much methane as currently exists in the atmosphere
  • 15.
    FACTORS AFFECTING METHANEFORMATION Carbondioxide Increase in carbondioxide decreases methane emission Type of soil Redox potential Soil carbon content Types of crops Organic matter Type of fertilizer Ammonium sulphate favours activity of other microbes over methanogens.
  • 16.
    0 50 100150 200 250 300 350 400 450 Baseline SOC-max SOC-min Clay-max Clay-min BD-max BD-min Fe-max Fe-min FWC-max FWC-min CH4 Flux (10-6 Gg C ha-1 yr-1) SOILFACTORS continous flooding Conventional water regimes Source: Hayano et al. (2013) EFFECT OF SOIL FACTORS ON METHANE EMISSION
  • 17.
    N treatment (kgN / ha) Methane g m-2 FN150 (150 kg N ha-1) 17.3 FN300 (300 kg N ha-1) 7.3 FN450 (450 kg N ha-1) 4.2 Source: Jianwen et al. (2005) N Application on methane emission
  • 18.
    Crop species Soiltemperature ( degree celcius) Total methane flux (kg C ha) Fallow (2010) 16.18 0.09 (2011) 15.57 0.01 Spring wheat(2010) 14.74 0.24 (2011) 14.51 -0.01 pea(2010) 15.27 0.11 (2011) 14.41 0.02 Source: Barsotti et al. (2013) Soil temperature and crop on methane emission
  • 19.
    Water regime Methaneg m-2 F 8.5 FDF 3.0 F – Continous flooding FDF - Flooding-Drainage- Frequent Source: Jianwen et al. (2005) Soil moisture
  • 20.
    IMPACTS OF METHANEEMISSION ON ENVIRONMENT AND VEGETATION
  • 22.
    1.Water management. Hayano et al. (2013) 050 100 150 200 250 rapid moderate poor CH4 Flux (10-6 Gg C ha-1 yr-1) Drainagerate MITIGATION
  • 24.
    Cultivation method ofrice affect methane emission Source: Fazli et al.(2012)
  • 25.
    0 20 40 60 80 100 120 140 0 1 23 4 Totalmethaneemission Transplanting dates 1 30 days before RTD 2 15 days before RTD 3 OnRTD 4 15 days after RTD Effect of Transplanting dates on methane emission Kim et al. (2013)
  • 26.
    Treatment Treatment details Cumulative CH4 emission KgC ha-1 CK Control 1.90 Urea 100% urea 1.41 UM1 Urea and manure N at 5:5 1.93 UM2 Urea and manure N at 7:3 2.27 UB1 Biochar + urea(20 Mg ha-1) 0.57 UB2 Biochar + urea(40 Mg ha-1) 0.77 UM1B Biochar (30 Mg ha-1)+UM1 1.04 UM2B Biochar (30 Mg ha-1)+UM2 1.29 Application of BIOCHAR Source : J.Jia et al. (2012
  • 27.
    Rice cultivars. Fertilization andother cultivation Ricebased cropping systems
  • 28.
    Treatments Total emission(g N2O-N ha-1) Control 34.3 Urea 59.9 Urea plus DCD 49.0 Nimin coated urea 57.0 Neam coated urea 53.2 Deepanjan et al. (2000) EFFECT OF NITRIFICATION INHIBITORS ON METHANE EMISSION
  • 29.
    No. Mitigation strategyReduction % of methane emission References 1 Midseason drainage 40 Wassmann et al. (2009) 2 Fertilizer management (Switch from Urea to Ammonium sulfate) 55 EEAA (1999) 10–67 Wassmann et al. (2000) 3 Crop management (short duration varieties) 25 EEAA (1999) Percentage of reduction by various managements
  • 30.
    NITROUS OXIDE ANDNITROGEN OXIDES Source: IPCC Fourth Assessment Report: Climate Change 2007, Intergovernmental Panel on Climate Change
  • 31.
    NITRIFICATION Nitrification is aoxidation process which involves oxidation of ammonium ions to nitrate by nitrifying microorganisms. DENITRIFICATION Denitrification is the reduction process of NO3 - to N2, mediated by facultative anaerobic bacteria, which correspond to 0.1-5.0% of the total bacteria population in the soil (Moreira & Siqueira 2006). Production of nitrogen gases
  • 33.
    The denitrifiers arefacultative aerobes such as Pseudomonas denitrificans, Paracoccus denitrificans and Thiobacillus denitrificans. N2O is also formed by the oxidation of ammonium by the autotrophic nitrifier, Nitrosomonas europea, by the reduction of nitrate by heterotrophic bacteria such as B.subtilis, E.coli and Aerobacter aerogens and By the reduction of nitrite by soil fungi such as Aspergillus flavus, Penicillium atrovelltum, Fusarium oxysporum and F.solani. Microbes involved
  • 34.
     Chemical decompositionof nitrite (chemidenitrification) and hydroxylamine oxidation (NH2OH).  Chemidenitrification - decomposition of NO2 - - neutral and acidic soils, causing volatilization and fixation of NO2 - in the soil organic matter. The amount of N2O produced this way is almost negligible.  Hydroxylamine - intermediate compound in the oxidation of NH4 + to NO3 - that can produce much more N2O than the chemidenitrification process.  In neutral and acidic soils, N2O is the main product of the NH2OH oxidation, due to its reaction with Mn and Fe, while in calcareous soils (pH from 7.8 to 8.2) the NH2OH reacts with CaCO3 and the main product is N2. Source: Bremner et al. 1980 Gas emitted from Non-biological process
  • 35.
    Factors affecting emission: 1)N application 0 10 20 30 40 50 Before irrigation After irrigation N2Oflux(µg/m2/hr) Unfertilized Fertilized Source: Su et al. (1995)
  • 36.
    Source: Jianwen et al.(2005) Water regime Nitrous oxide mg m-2 F 6 FDF 155 F – Continous flooding FDF - Flooding-Drainage-Frequent Soil moisture on nitrous oxide emission
  • 37.
    Wetting Soil pH Gas diffusionand Oxygen – compaction, fine texture, surface sealing- limit gas diffusion- denitrification - reconsuming. Limited oxygen- nitrification – produces nitrous oxide. Relief position Soil characteristics
  • 38.
    Influence of Availablecarbon 0 100 200 300 400 0 100 200 300 400 Denitrification(ppm N2O+N2) Organic C(ppm) Sainz Rozas et al. (2001)
  • 39.
    AGRICULTURAL MANAGEMENT FACTORS Croptype Mosquera et al. (1992) 0 1 2 3 4 5 6 7 8 Maize Grass land N2OemissionKgha-1 Control Mineral fertilizer Cattle slurry, surface spreading Cattle slurry, Narrow-band application
  • 40.
    Fertilizer management Soil andcrop management – uncultivated soil Residues quality – C:N
  • 41.
    IMPACTS ON ENVIRONMENT i)Global warming: ii)Formation of Acidrain
  • 42.
    iii) Formation ofsecondary pollutant ozone:
  • 43.
    Prioritizing the useof low N2O emission fertilizers Managing the N-fertilizer application – deep placement, split application. Managing the soil chemistry and microbiology – lime in acid soil Slow release fertilizers Site specific nutrient management techniques Tillage management – no till, reduced tillage Water management- drip, sprinkler, soil moisture sensors MITIGATION
  • 44.
    Treatments Cumulative N2Oemission (mg N2O m-2) Chemical Fertilizer (CF) 30.2 Lime Nitrogen (LN) 10.7 CF with Dicyanamide (CFD) 24.3 Yamamoto et al. (2013) TABLE: Cumulative nitrous oxide emission over 63 days in each of the plots fertilized with CF, LN, CFD Form a nitrification inhibitor (dicyanamide, DCD) during the decomposition process of lime-nitrogen Lime-nitrogen application
  • 45.
    Treatment Treatment details CumulativeN2O emission Kg N ha-1 CK Control 0.4 Urea 100% urea 13.2 UM1 Urea and manure N at 5:5 10.4 UM2 Urea and manure N at 7:3 10.9 UB1 Biochar + urea(20 Mg ha-1) 2.4 UB2 Biochar + urea(40 Mg ha-1) 3.1 UM1B Biochar (30 Mg ha-1)+UM1 2.1 UM2B Biochar (30 Mg ha-1)+UM2 1.9 Jia et al. (2012) Application of Biochar
  • 46.
  • 47.
    Source: IPCC FourthAssessment Report: Climate Change 2007, Intergovernmental Panel on Climate Change.
  • 49.
    SOURCES OF CARBONDIOXIDEFROM SOIL: Fermentation Tricarboxylic acid (TCA) cycle Root respiration Rhizosphere respiration Soil animals
  • 50.
    Biome Below ground mortmass decomposition Litter decompositi on SOM decompositi on Root respiratio n Polardesert 0.2 0.2 0.1 0.2 Tundra 194.4 119.8 18.1 108.6 Forest tundra 248.2 340 17.0 210.8 Taiga 476 996 42.0 672.7 Mixed- decidious 168 246.4 11.2 243.0 Forest-steppe 341 233.2 11.0 221.7 Steppe 549 182.5 9.4 232.1 Subtropical woodland 2.6 2.2 0.1 2.3 Desert and semi desert 487 182.7 5.2 215.8 Carbondioxide emission from different biomes Kolchugin et al. (1995)
  • 51.
    Effect of soilmoisture on carbondioxide emission David Risk et al. (2002)
  • 52.
    Effect of soiltemperature on carbondioxide production David Risk et al. (2002)
  • 53.
    a d bcdab d bcd abc cd d 0 1 2 3 4 5 A GF cumulativeCO2production gCO2kg-1d.s.12week N0 N30 N150 Influence of N application Kong et al. 2013
  • 54.
  • 55.
    Sequestration of Cin soil •Reduced tillage and no tillage practices •Promoting agro-forestry, Afforetration. •Increasing the passive or inert fraction of soil organic pool •Organic farming •Precision farming
  • 57.
    Establishment methods CO2 CH4 N2O TSFS MS TS FS MS TS FS MS Coimbatore TPR 480 2644 1522 13.12 16.11 10.11 1.74 0.58 2.44 DSR 274 3012 2162 9.46 12.42 8.12 1.1 2.12 0.35 SRI 102 2894 2088 11.11 13.11 9.66 1.88 1.96 0.60 Aduthurai TPR 493 3164 1794 5.93 8.28 4.7 1.13 0.62 2.89 DSR 287 3963 3338 2.42 7.27 4.98 0.91 3.43 0.48 SRI 121 3340 2592 4.41 6.38 2.97 1.68 2.25 0.8 GASEOUS EMISSION FROM PADDY FIELDS Tamil Nadu TS – Tillering Stage FS – Flowering Stage MS – Maturity Stage TPR – Transplanted Rice DSR – Direct Seeded Rice SRI – System of Rice Intensification
  • 58.
  • 59.
     Soil pH Increasein pH increases volatalization. Upto about pH 9, ammonia concentration increases by a factor of 10 per unit increase of pH.  Wind velocity Higher the wind velocity , higher the volatalization  Salinity  Fertilizer application – broadcast – band application and deep placement  Use of nitrification inhibitors FACTORS AFFECTING AMMONIA VOLATALIZATION
  • 60.
    0 10 20 30 40 1 2 34 5 6 7 8 9 10 NH3loss(%)ofappliedN soil solution pH Field Capacity Air dry kanani et al., 1991 Influence of soil moisture on cumulative NH3 loss from surfaced applied urea.
  • 61.
    0 500 1000 1500 2000 2500 3000 3500 Spring Summer FallWinter Kgammonia Season Emissions from soil Emissions from lagoons Roelle et al. (2002) Diurnal and seasonal variability
  • 62.
  • 63.
    Effect of soiltemperature on ammonia emission Roelle et al. (2002)
  • 64.
    Effect of overgrazing on ammonia volatilization Yunhai Zhang et al
  • 65.
    Impacts  Eutrophication  Soilacidification  Fertilization of vegetation
  • 66.
    IMPACTS ON VEGETATION Plants,trees and crops - water. large release of ammonia occurs the vapor will likely burn the leaves of nearby downwind vegetation. Excess exposure leads to death of sensitive plants. Especially lichens, mosses,etc Shift in dominance from mosses, lichens and ericoids (heath species) towards grasses like Deschampsia flexuosa, Molinia caerulea and ruderal species, e.g. Chamerion angustifolium, Rumex acetosella, Rubus idaeus.
  • 67.
    MITIGATION Slow release Nfertilizers, Urease and nitrification inhibitors : Slow release fertilizers such as urea super granules (USG), sulphur coated urea, neem cake coated urea, neem oil coated urea, etc can be used to minimize the ammonia volatilization. Method and time of fertilizer application Site-specific N management Fertigation and foliar application Types of fertilizers
  • 68.
    Emission factors basedon fertilizer application (kg-NH3 / Mg-N) Fertilizer Group I soils Group II soils Group III Soils Anhydrous ammonia 48 48 48 Nitrogen solutions (urea & AN) 97 97 97 Urea 242 182 182 Diammonium phosphate 61 61 61 Ammonium nitrate (AN) 36 24 12 Liquidammonium polyphosphate 61 61 61 Aqueous ammonia 97 97 97 Ammonium thiosulfate 30 30 30 Calcium ammonium nitrate 36 24 12 Potassium nitrate 12 12 12 Monoammonium phosphate 61 61 61 Ammonium sulfate 182 121 61 AMMONIA EMISSION FROM DIFFERENT FERTILIZER APPLICATION Source: William Battye et al. (2004)
  • 69.
    SULPHIDE AND SULPHURGASES The annual rate of sulfur emission associates with human activities has been estimated of about 80 Tg S . Aerated soils the emissions were between 0.8 and 27 μg m−2 h−1 H2S
  • 70.
    REDUCED S GASESFROM SOIL  Hydrogen sulfide (H2S)  Carbonyl sulfide (COS)  Carbon disulfide (CS2)  Methyl mercaptan (CH3SH)  Dimethyl sulfide (DMS)and  Dimethyl disulfide (DMDS)  Sulphur dioxide – In ASS –only trace amount.
  • 72.
    ORGANISMS INVOLVED INSULPHATE REDUCTION  Desulfotomaculatum (3species),  Desulfovibrio (5 species),  Desulfobacterium,  Desulfococcus,  Desulfosarcina,  Desulforomonas, and  Desulfomonas. Other heterotropic organisms include some bacteria actinomycetes, fungi, algae (Clostridium nitrificans, Aspergillus niger, A.nidulans, Pencilium chyrsogenum, chlorella pyrenecidosa, etc.)
  • 73.
    FACTORS FAVOURING SULPHATEREDUCTION Organic matter – heterotropic microbes C:S ratio Presence of nitrogen and sulphur source Presence of iron and manganese Application of fertilizers and manures Redox potential Reaction Redox potential O2-H2O +380 to +320 NO3-N2. Mn4+-Mn2+ +280 to +220 Fe3+-Fe2+ +180 to +150 SO4 2—S2- -120 to -180 CO2-CH4 -200to -280
  • 74.
    Gas During cropping Afterharvest N0-N Mineral Straw N0-N Mineral Straw DMS 3.9 5.7 5.4 0.6 1.1 0.7 COS -0.2 -0.5 -0.2 0.5 0.3 2.1 CS2 0.4 0.4 0.3 0.4 0.7 1.7 Total 4.1 5.7 5.5 1.5 2.7 4.5 Source: K.Kanda et al. (1992). Emission of reduced sulphur gases under mineral fertilizer without nitrogen(N0-N), mineral fertilizer(mineral), mineral fertilizer with rice straw application(straw). Influence of mineral fertilizer on sulphide gas emission
  • 75.
    IMPACTS H2S at lowlevels can increase plant growth “fertilizer” effect
  • 76.
    concentration and timeof exposure increased there is a decrease in shoot height and root length ,  Decrease in fresh and dry weight,  Decrease in chlorophyll a,  Decrease in carbohydrase ,  Reduced activity of nitrate reductase and glutamate dehydrogenase,  Increase in peroxidase activity,  Increase in cysteine,  Decrease in serine ,  Increase in amino-N.
  • 79.
    Occurrence of rottenegg smell and root discoloration have been observed. Soil and water samples containing high sulphur contents of 25 and 65 ppm in Thiruvaiaru and 23 and 60 ppm in Kumbakonam blocks respectively. The H2S symptoms are normally noticed in Cauvery Old Delta (Thanjavur,Thiruvarur and Nagapattinam) in kuruvai season during the years of poor rainfall coupled with delayed receipt of canal water. H2S injury in Cauvery Delta Zone Source: ARW for Rice (2013)
  • 80.
    MITIGATION • AWD forsoil aeration • Inter cultivation with cono weeder, • Summer ploughing • Split application and use of high MOP @ 43 kg/ha. • Avoid the use of high sulphate containing water for irrigation. • Drain the water fully and apply 10kg urea+10 kg potash evenly. After 2 days irrigate the field with small amount of water. And repeat the same in 7-10 days interval. • Apply iron containing fertilizers – sulphur precipitates as ferrous sulphate. • If the canal water contains high amount of sulphur compounds, store it in ponds and then irrigate through furrows, so that some amount of sulphur will evaporate
  • 81.
    NOBLE GASES? THEY TOOEMITTED FROM SOIL……………………. SOUL OF INFINITE LIFE CONCLUSION