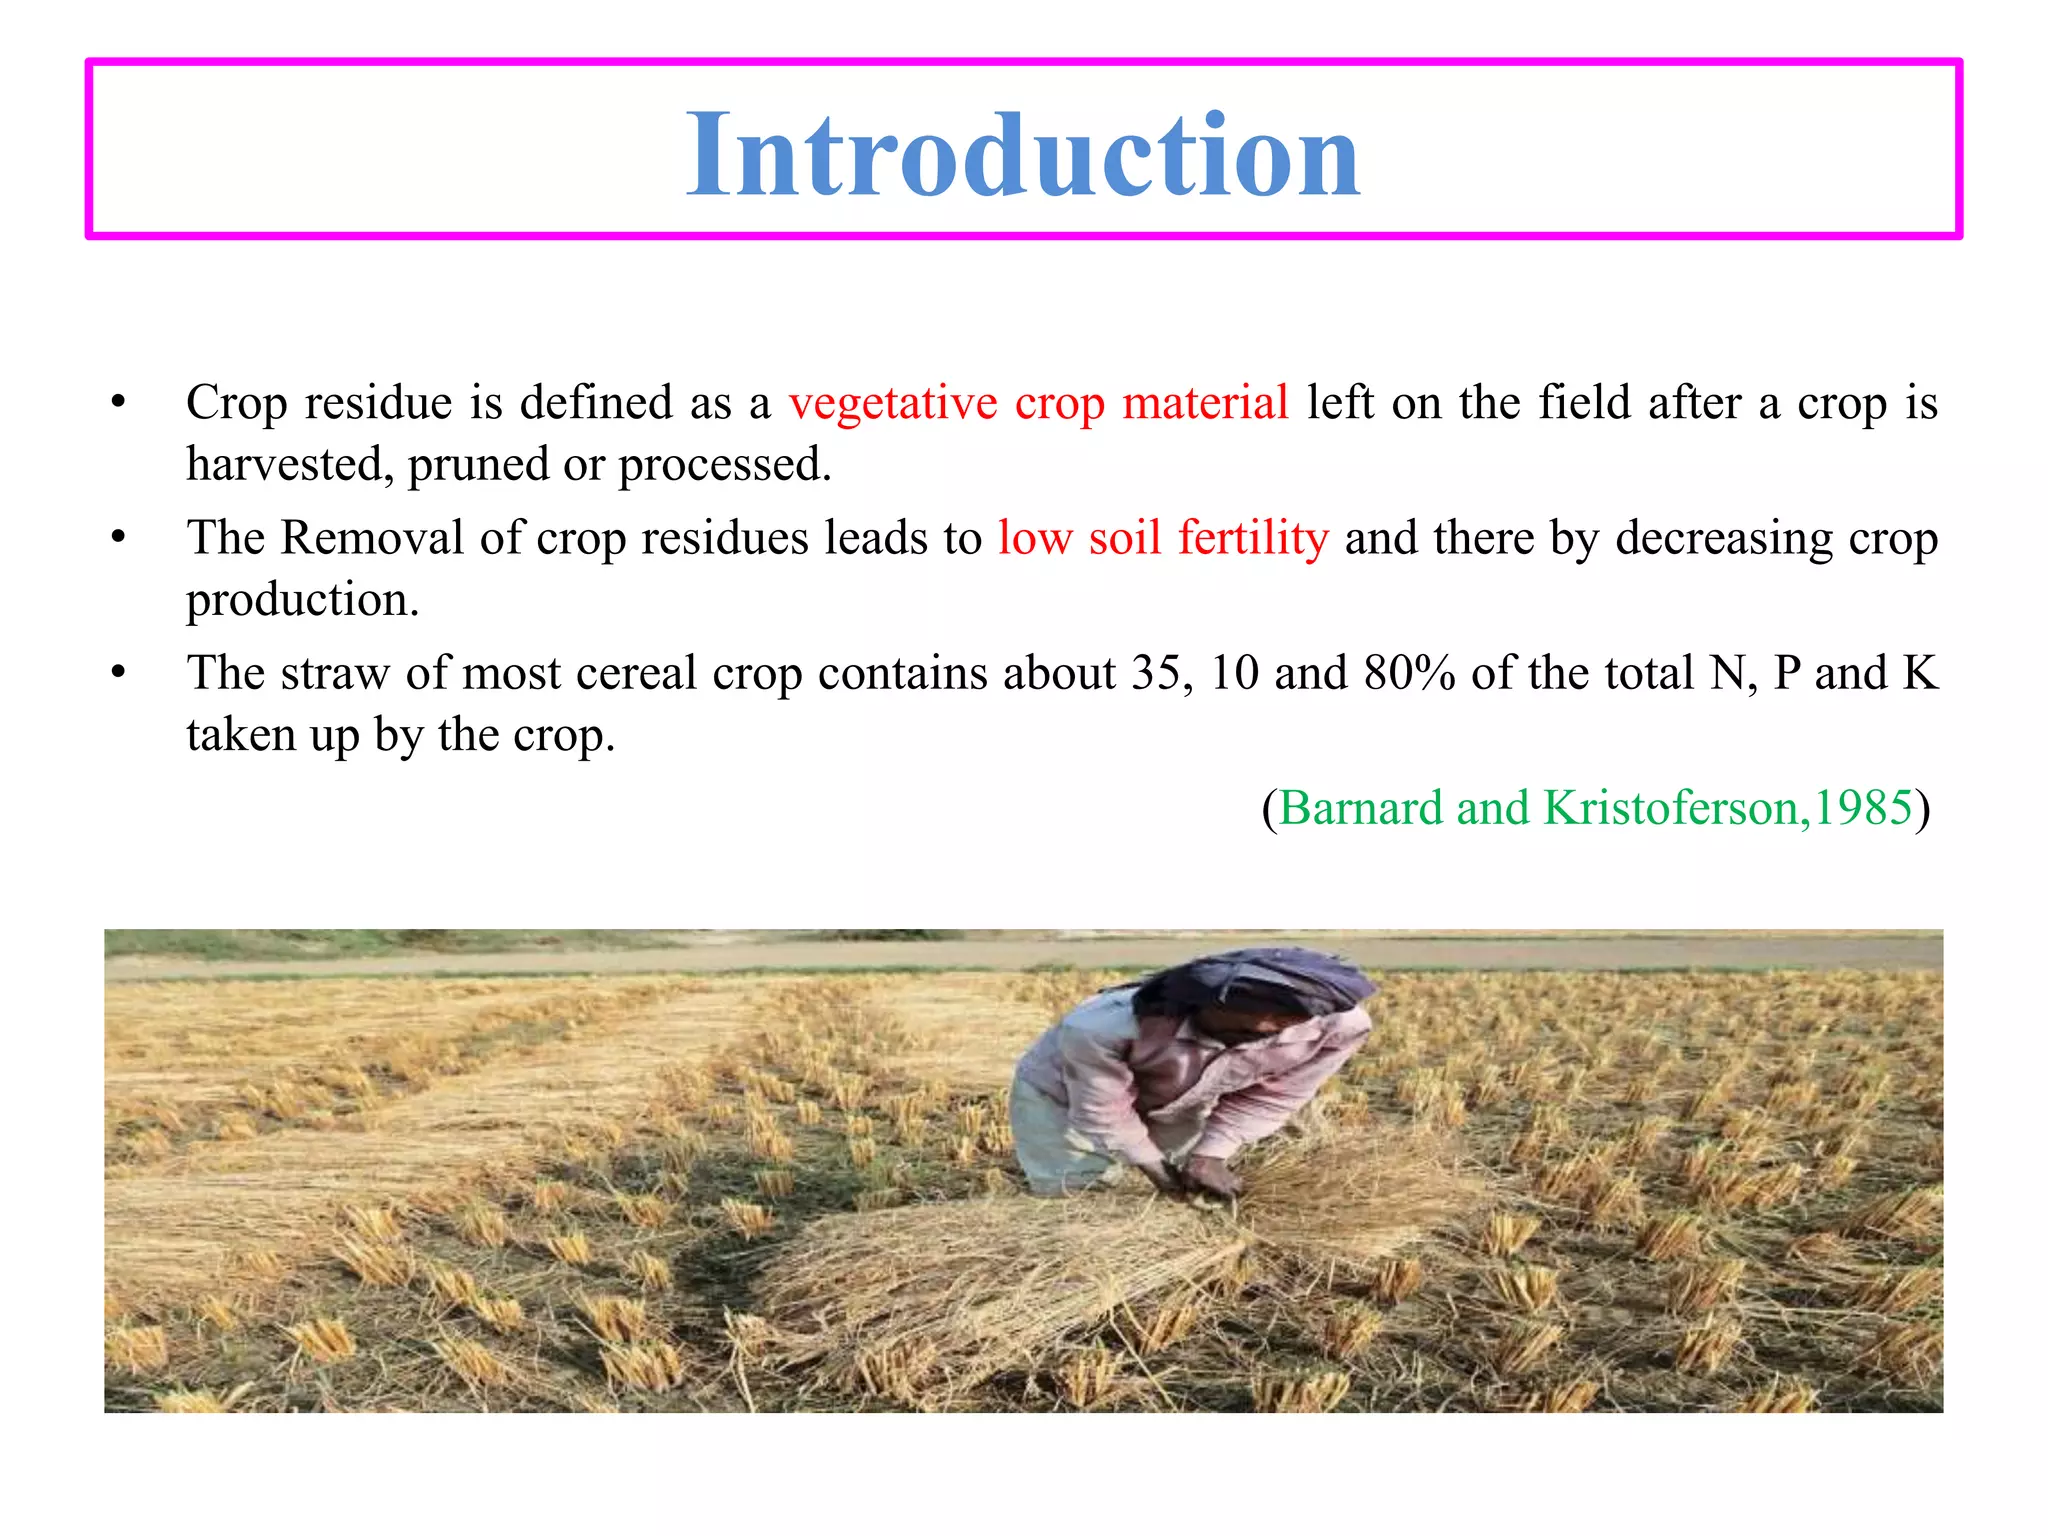
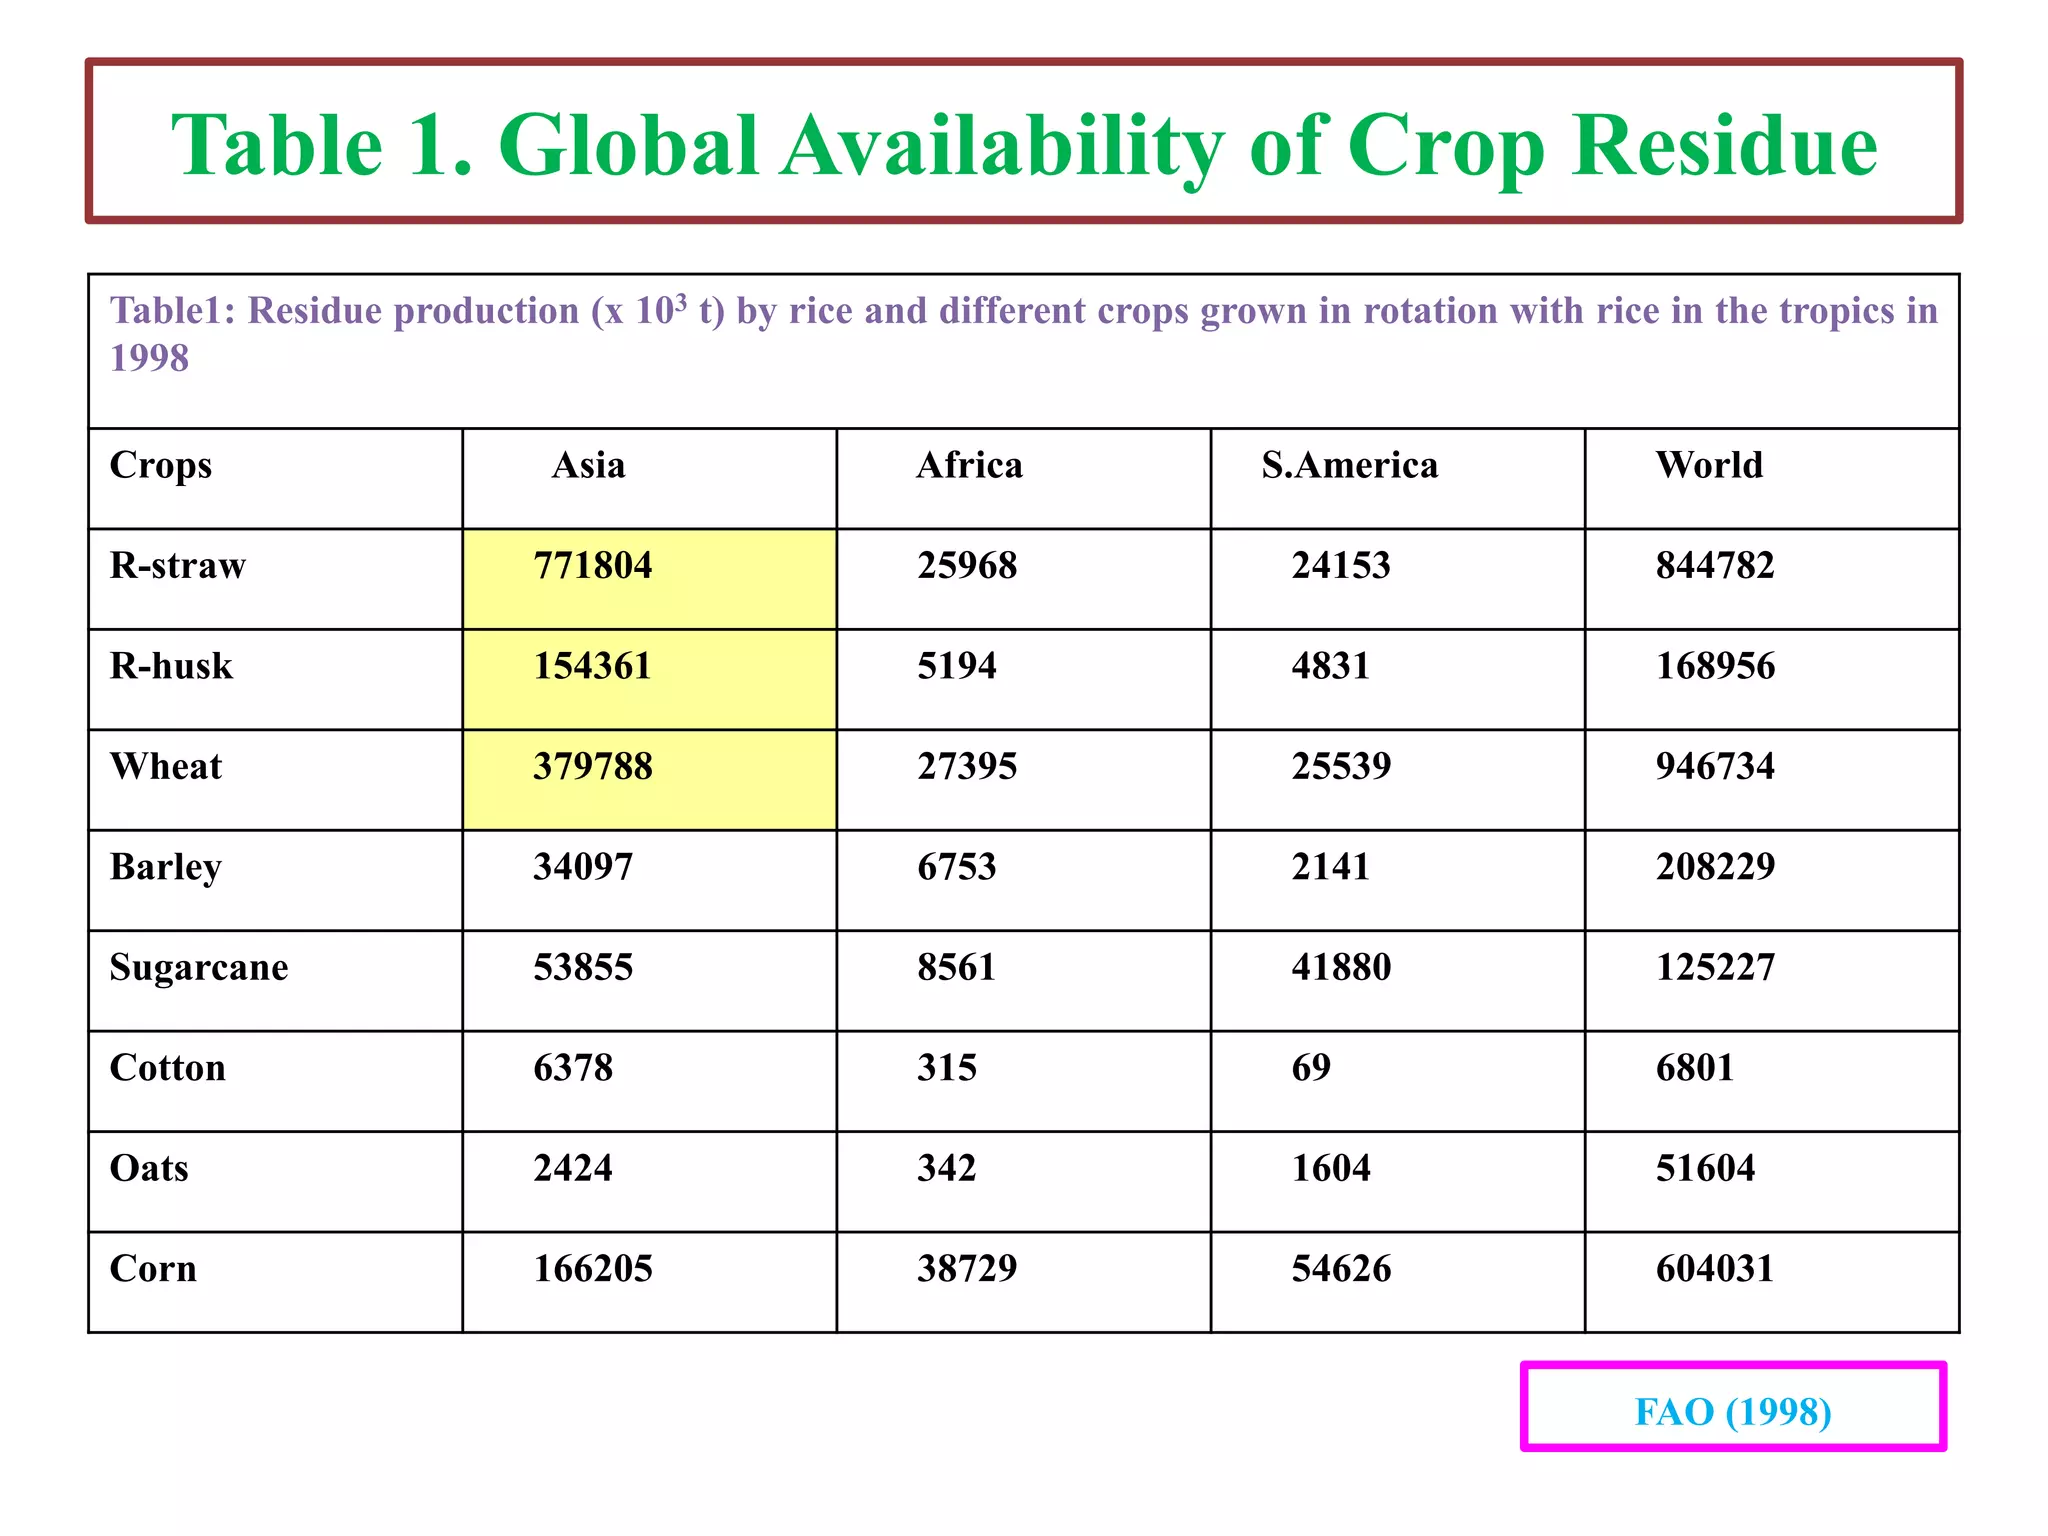
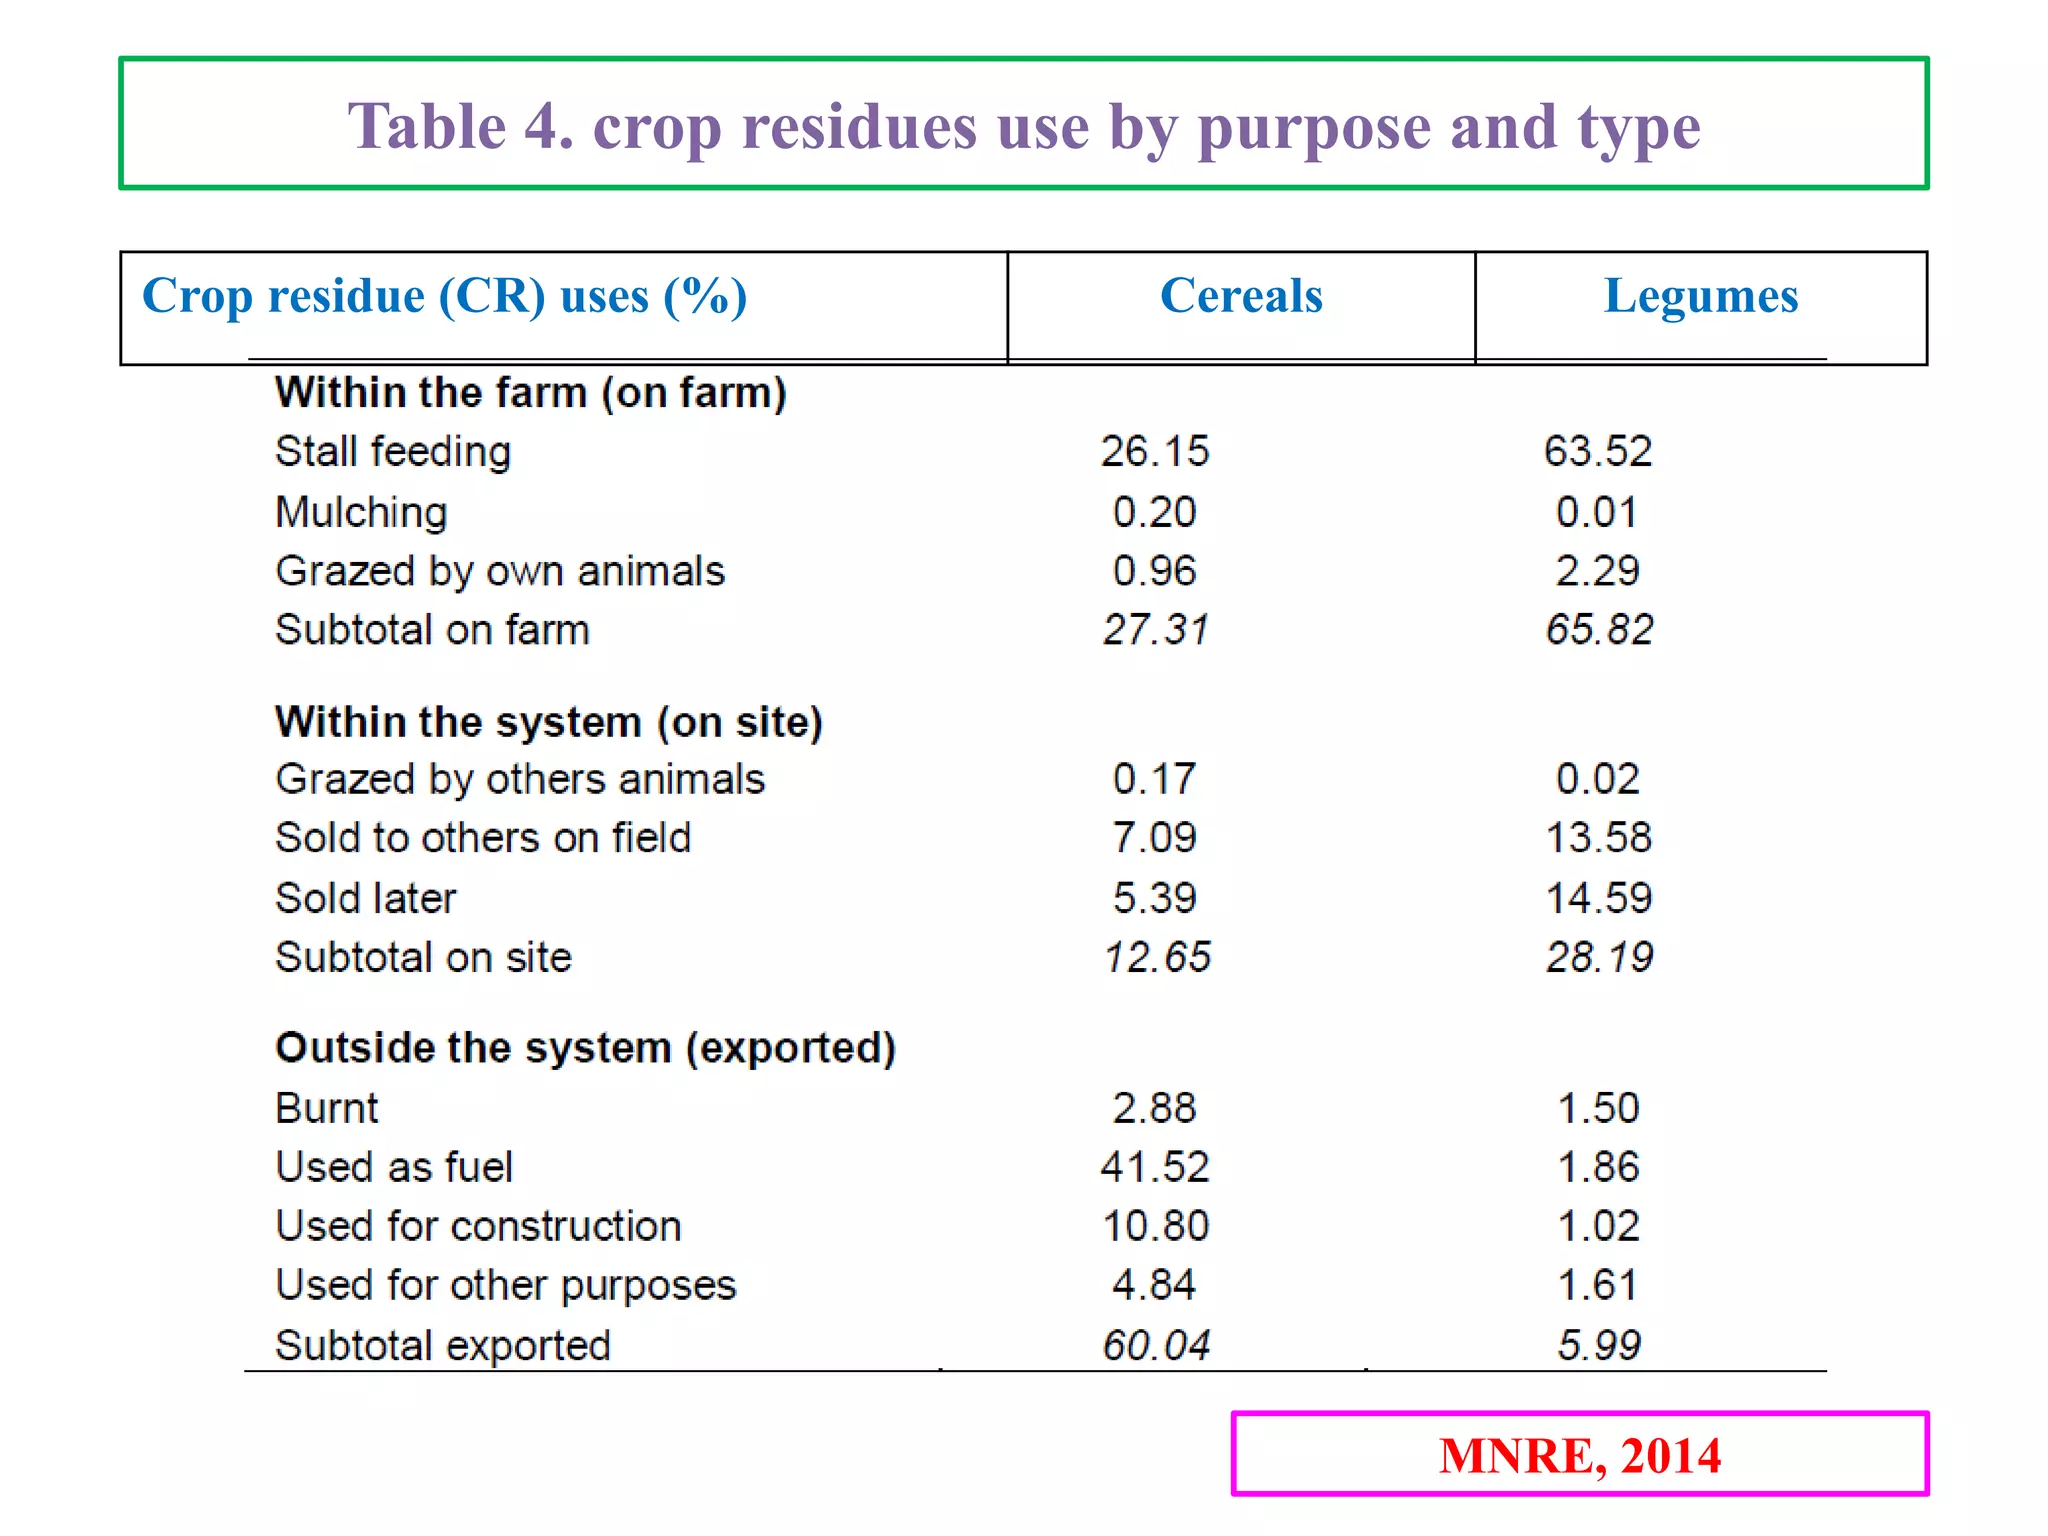
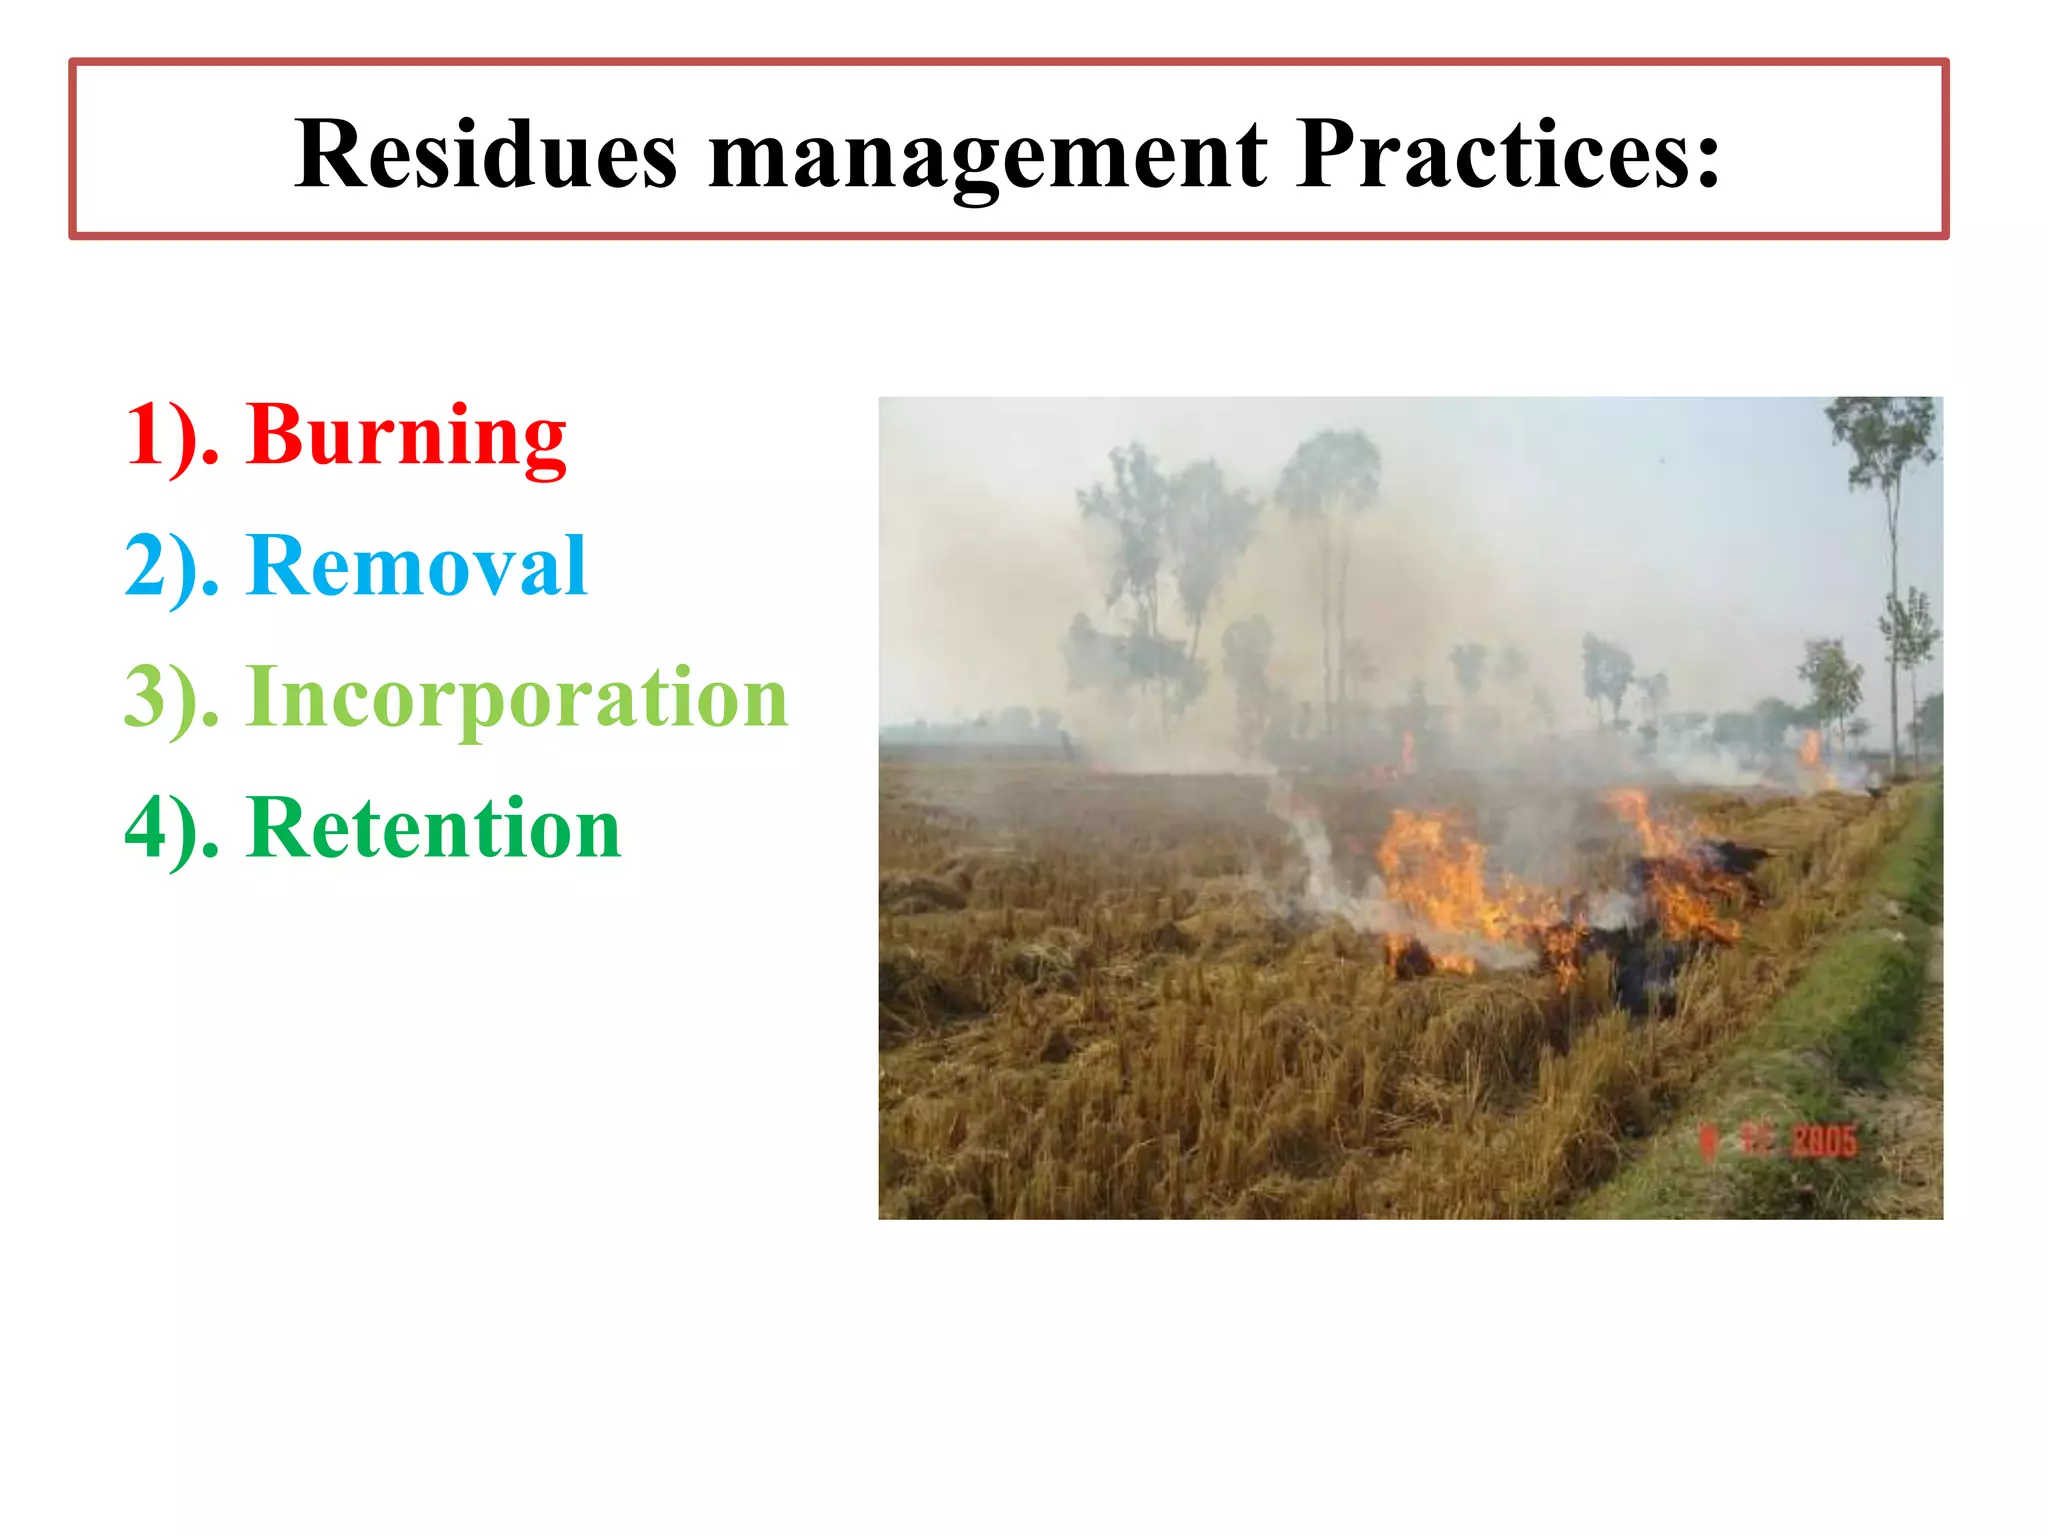
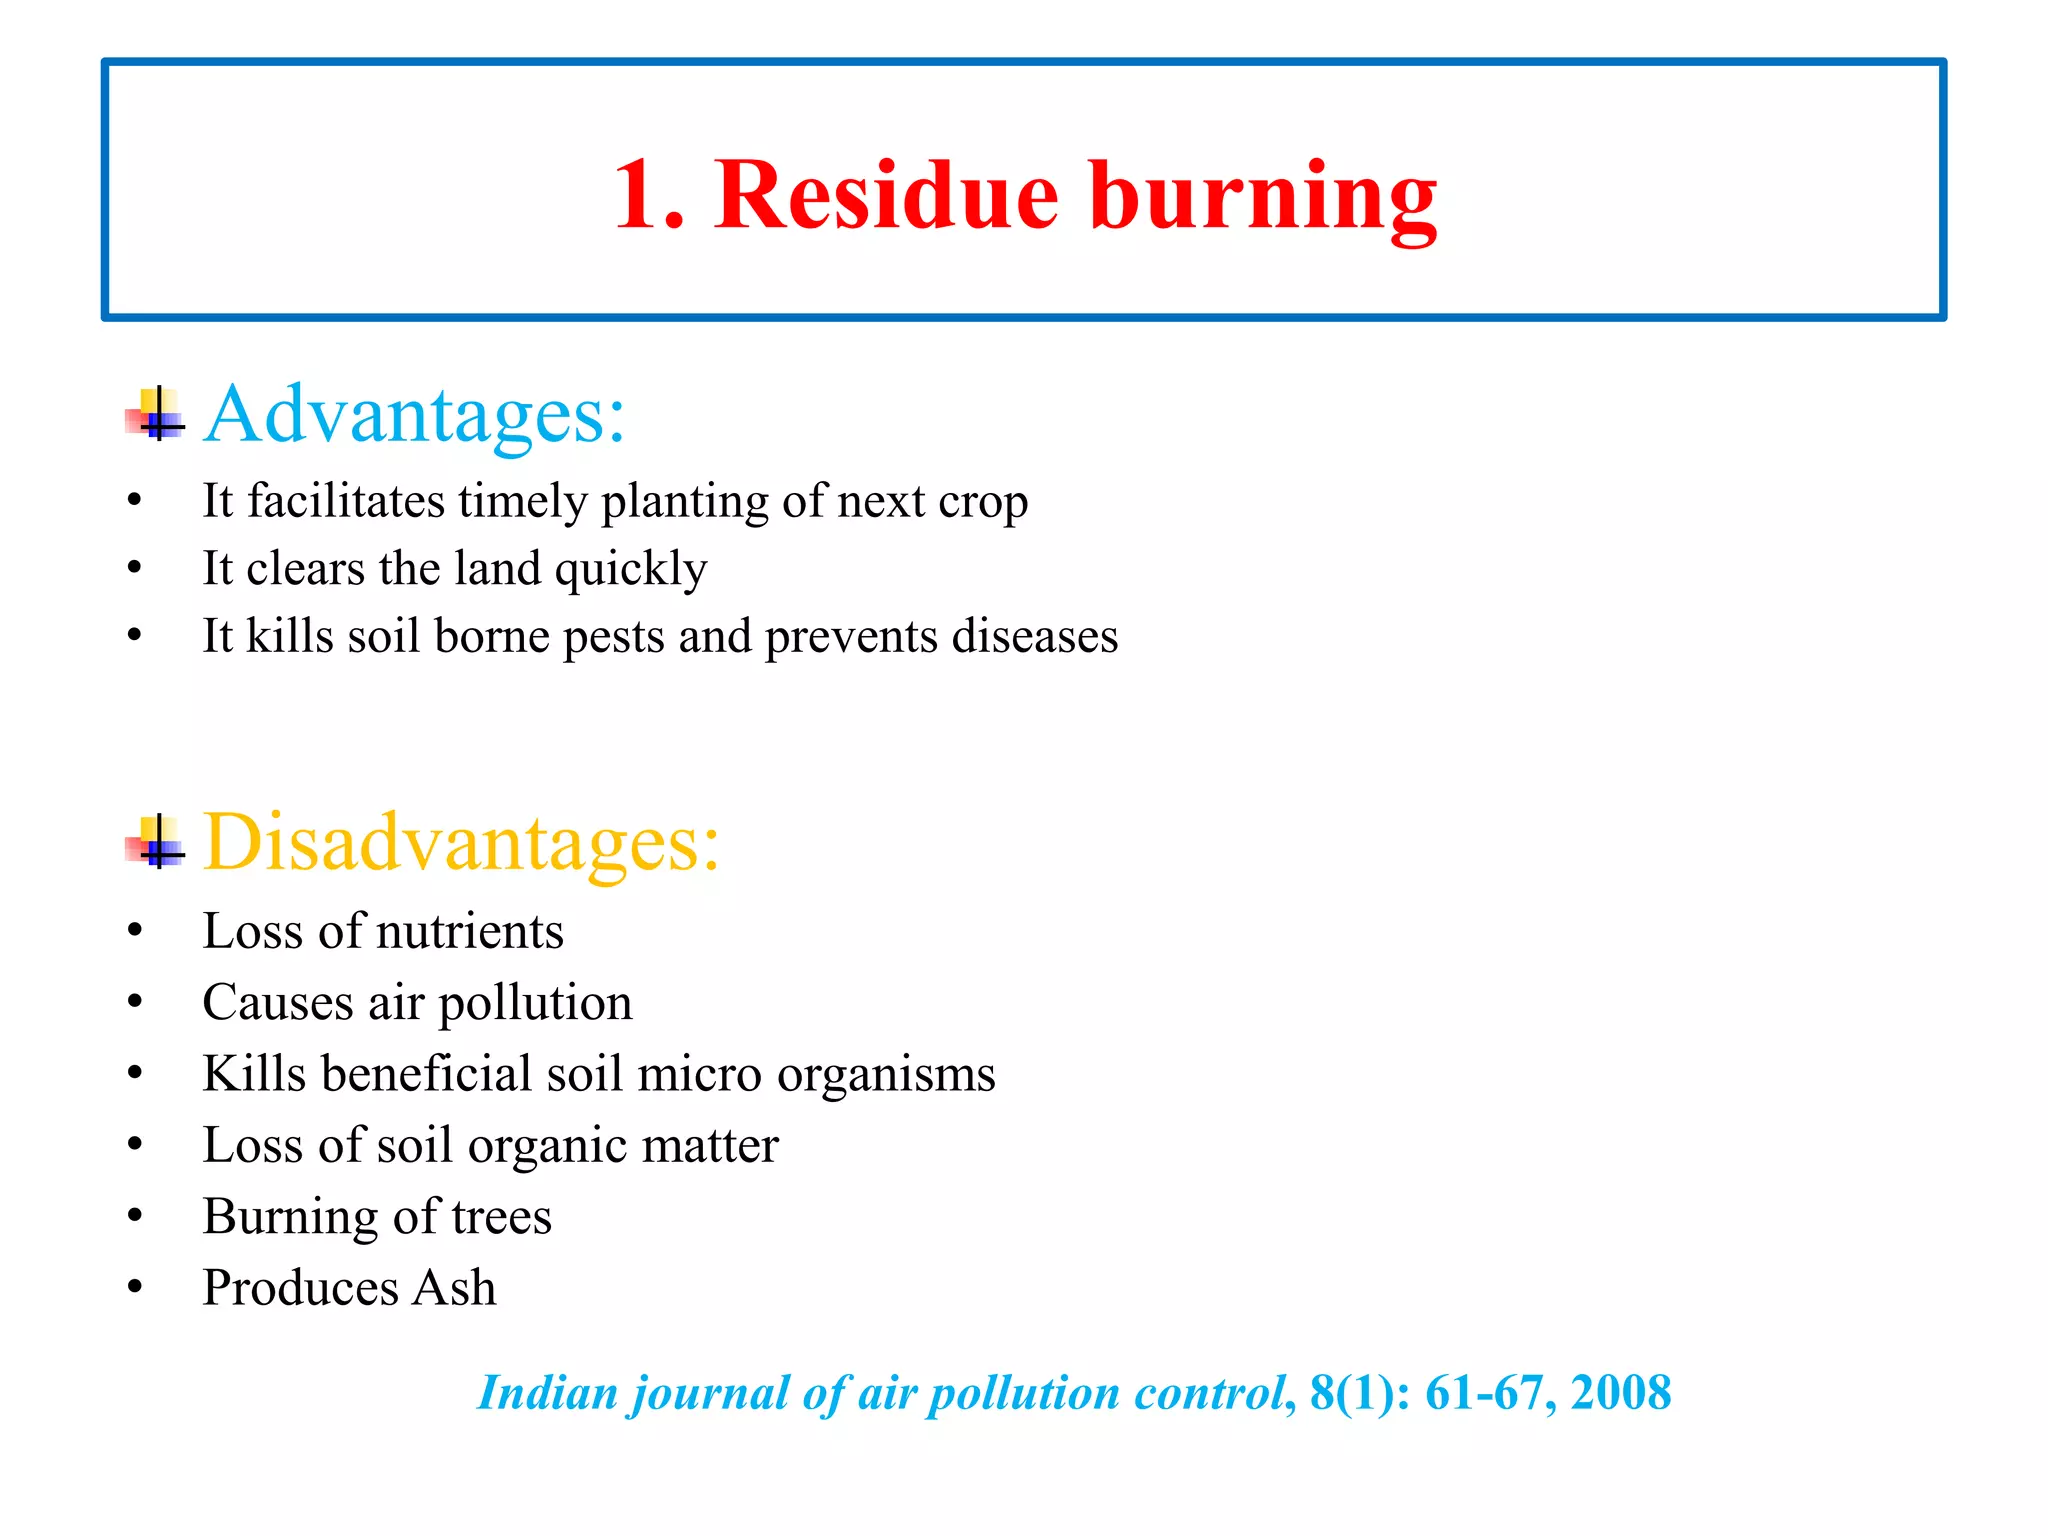
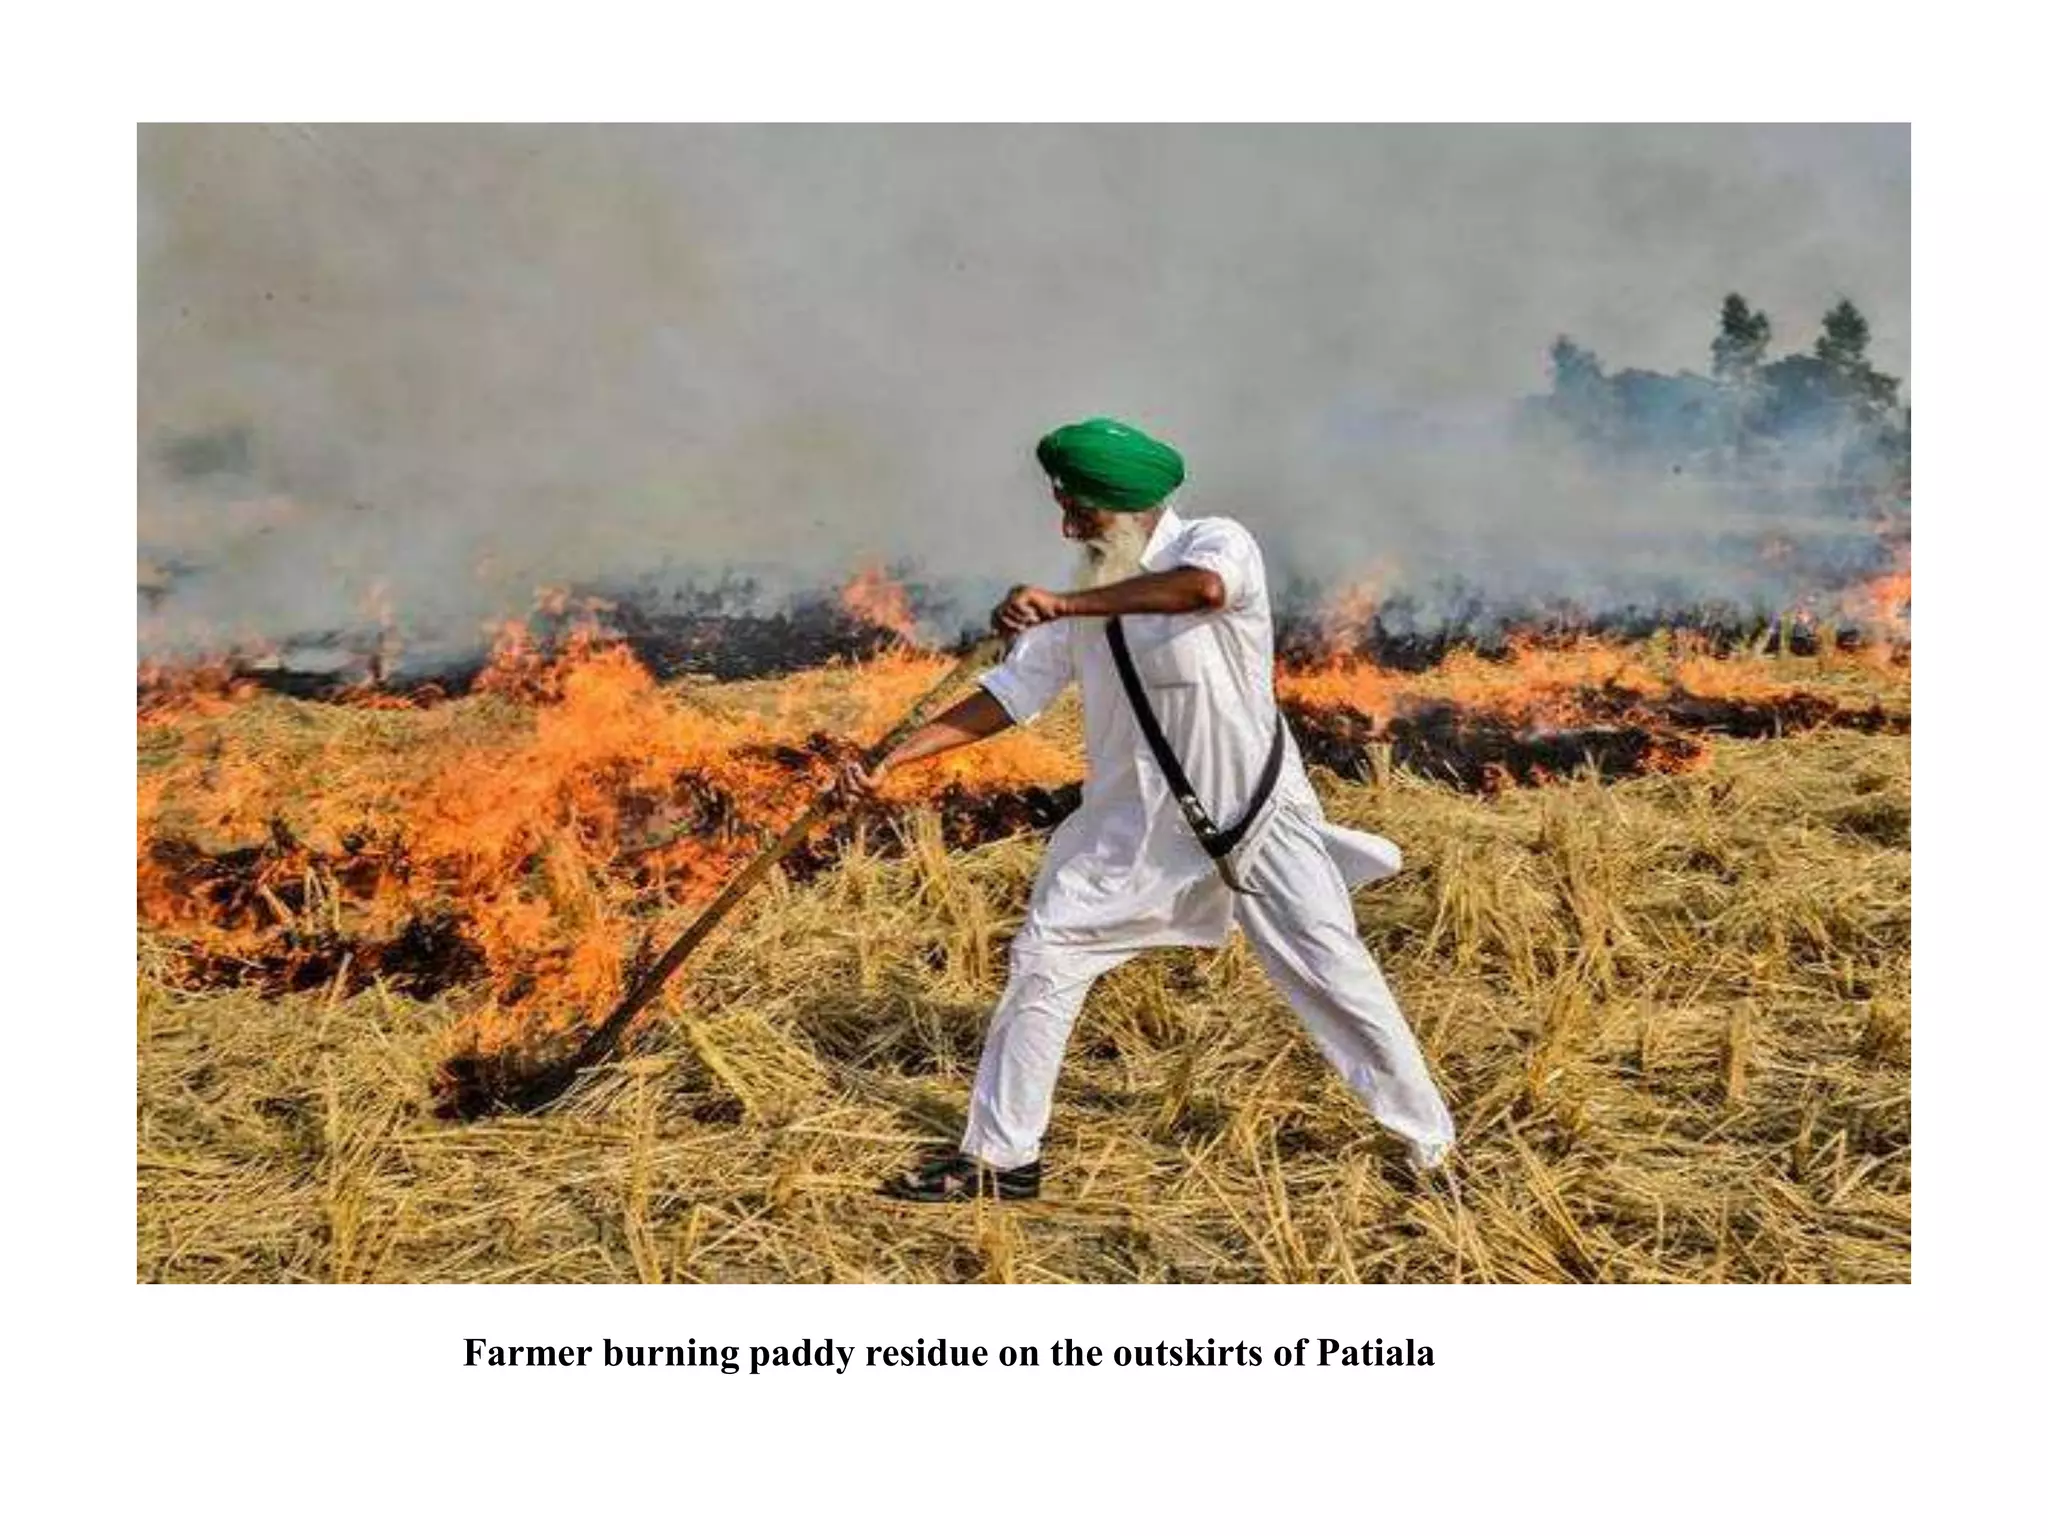
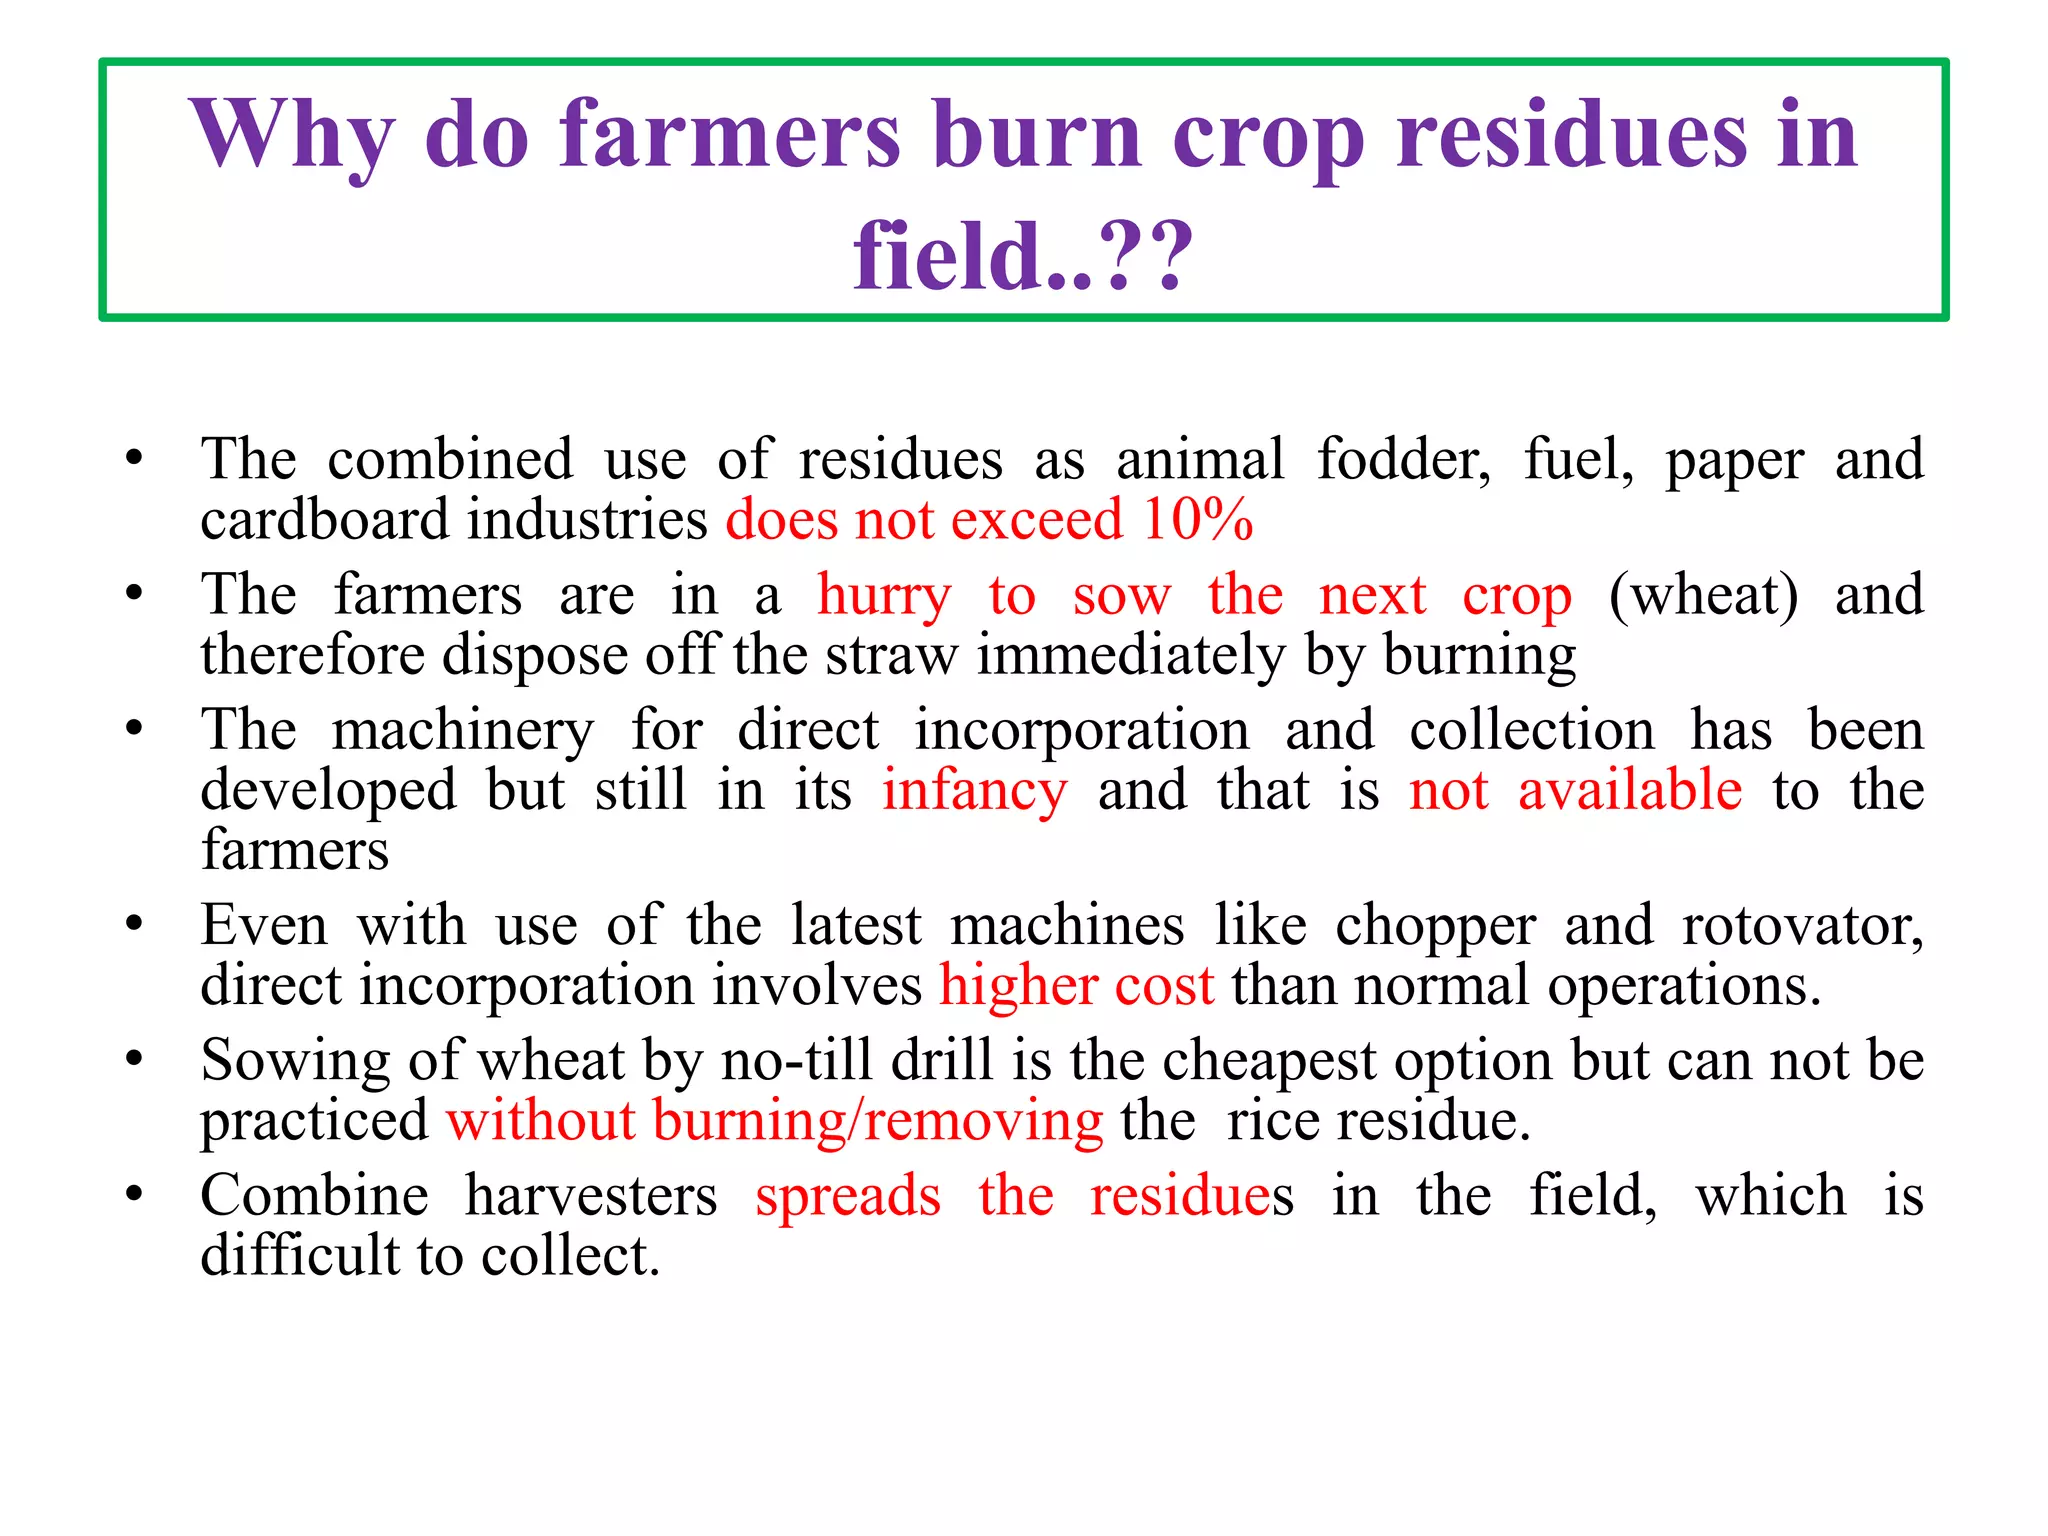
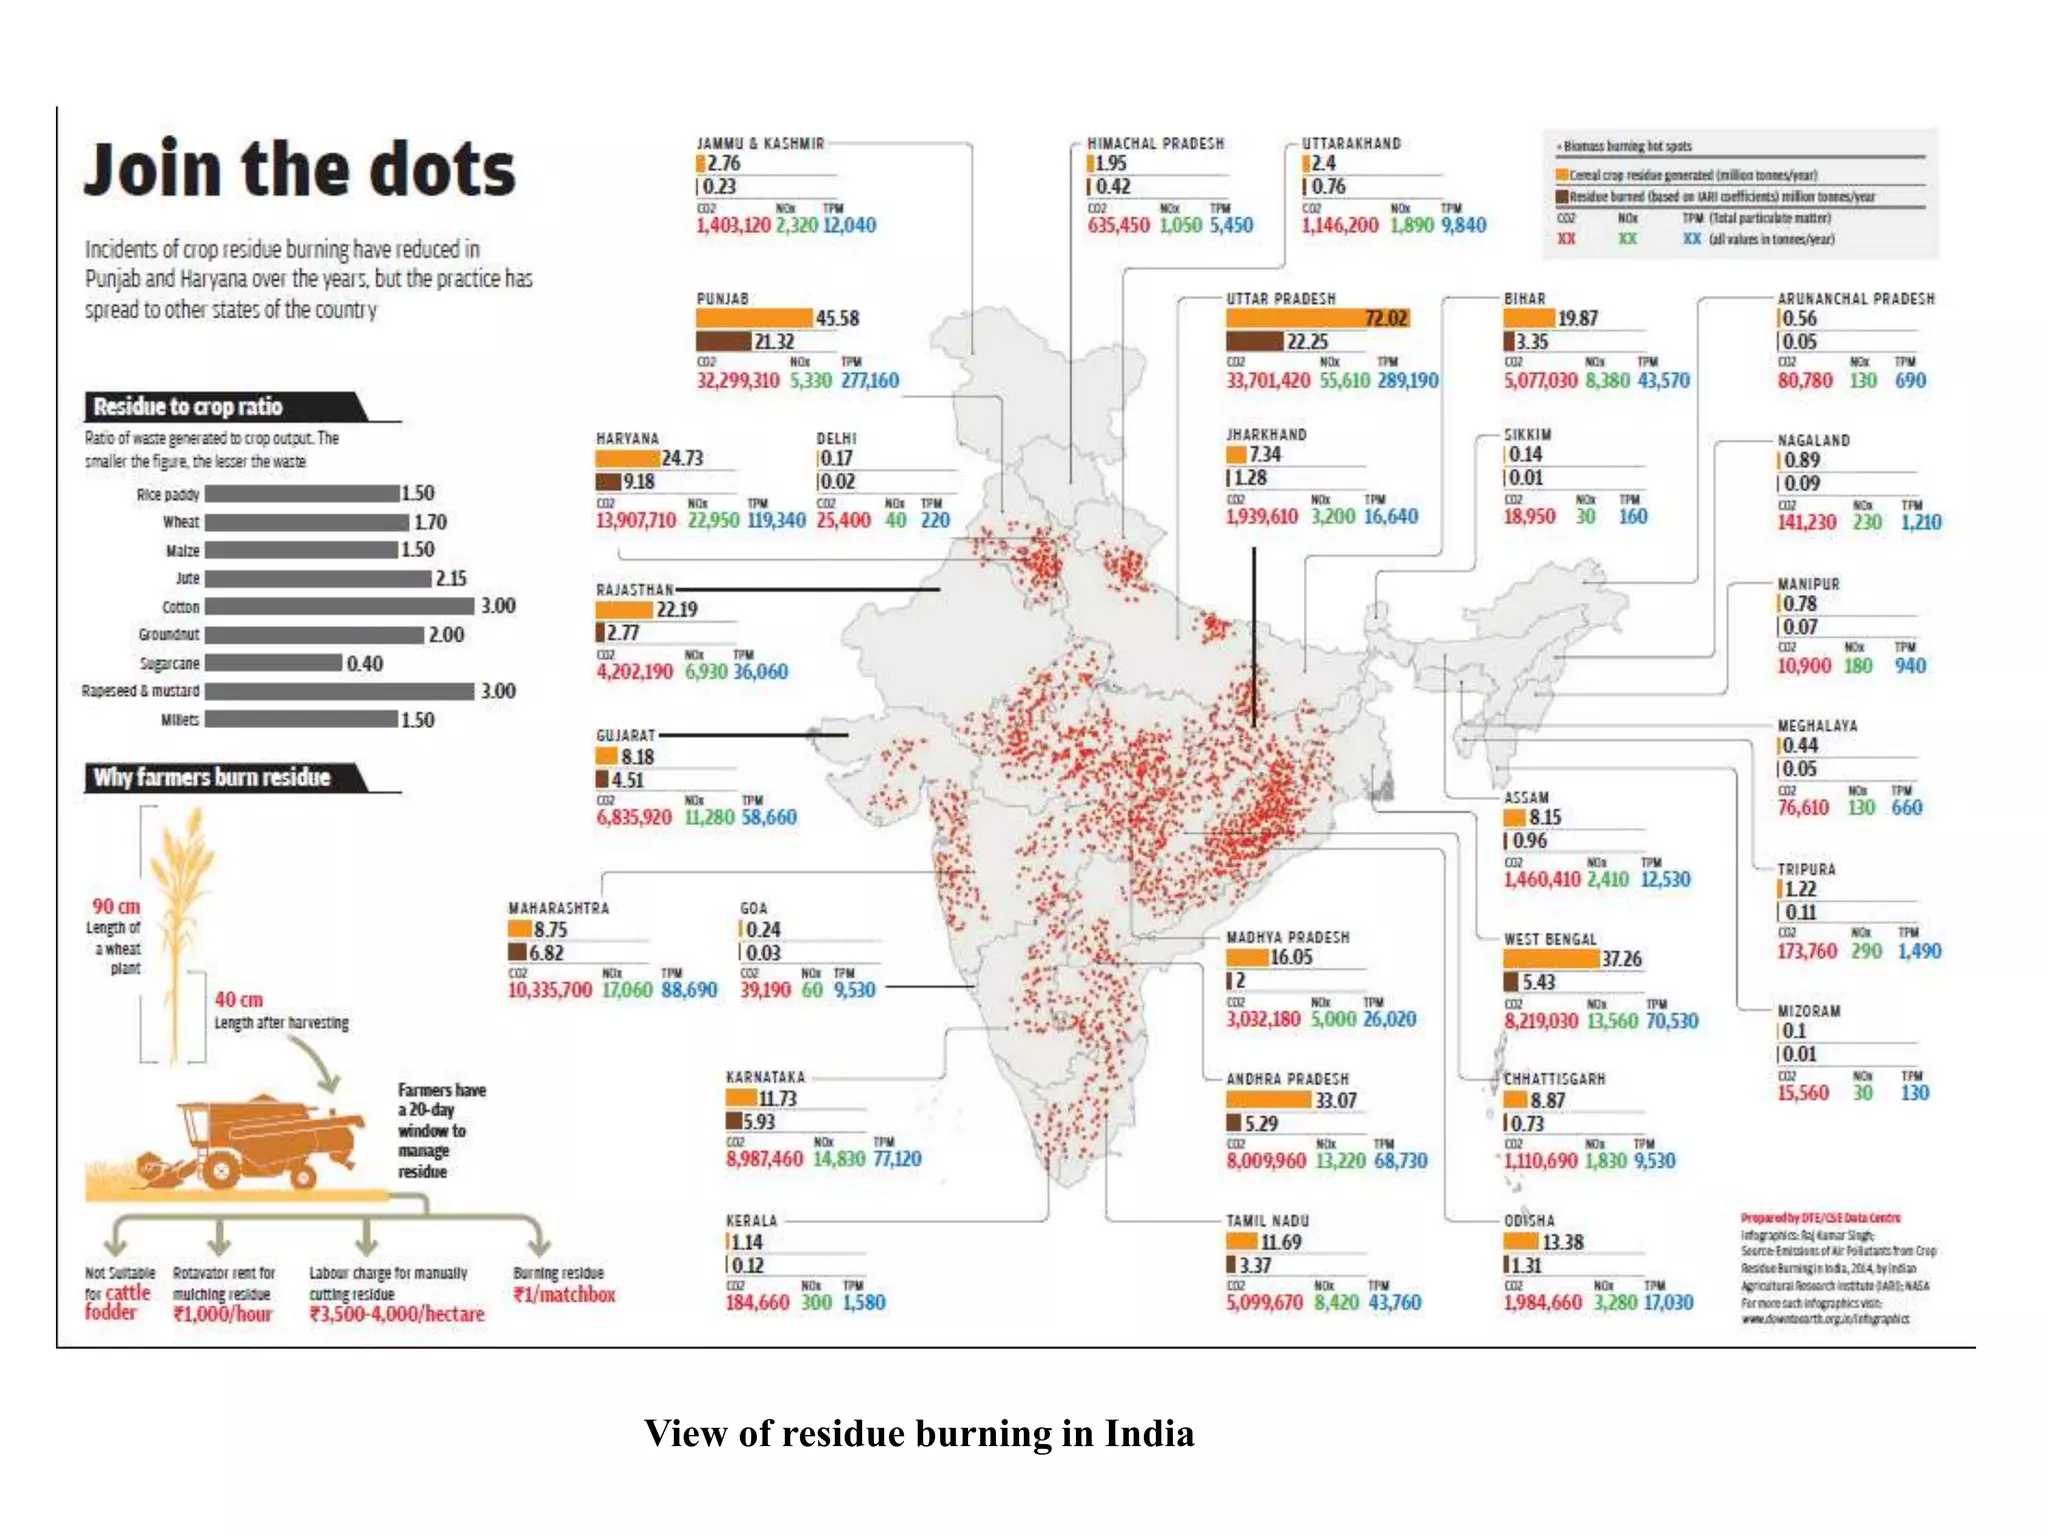
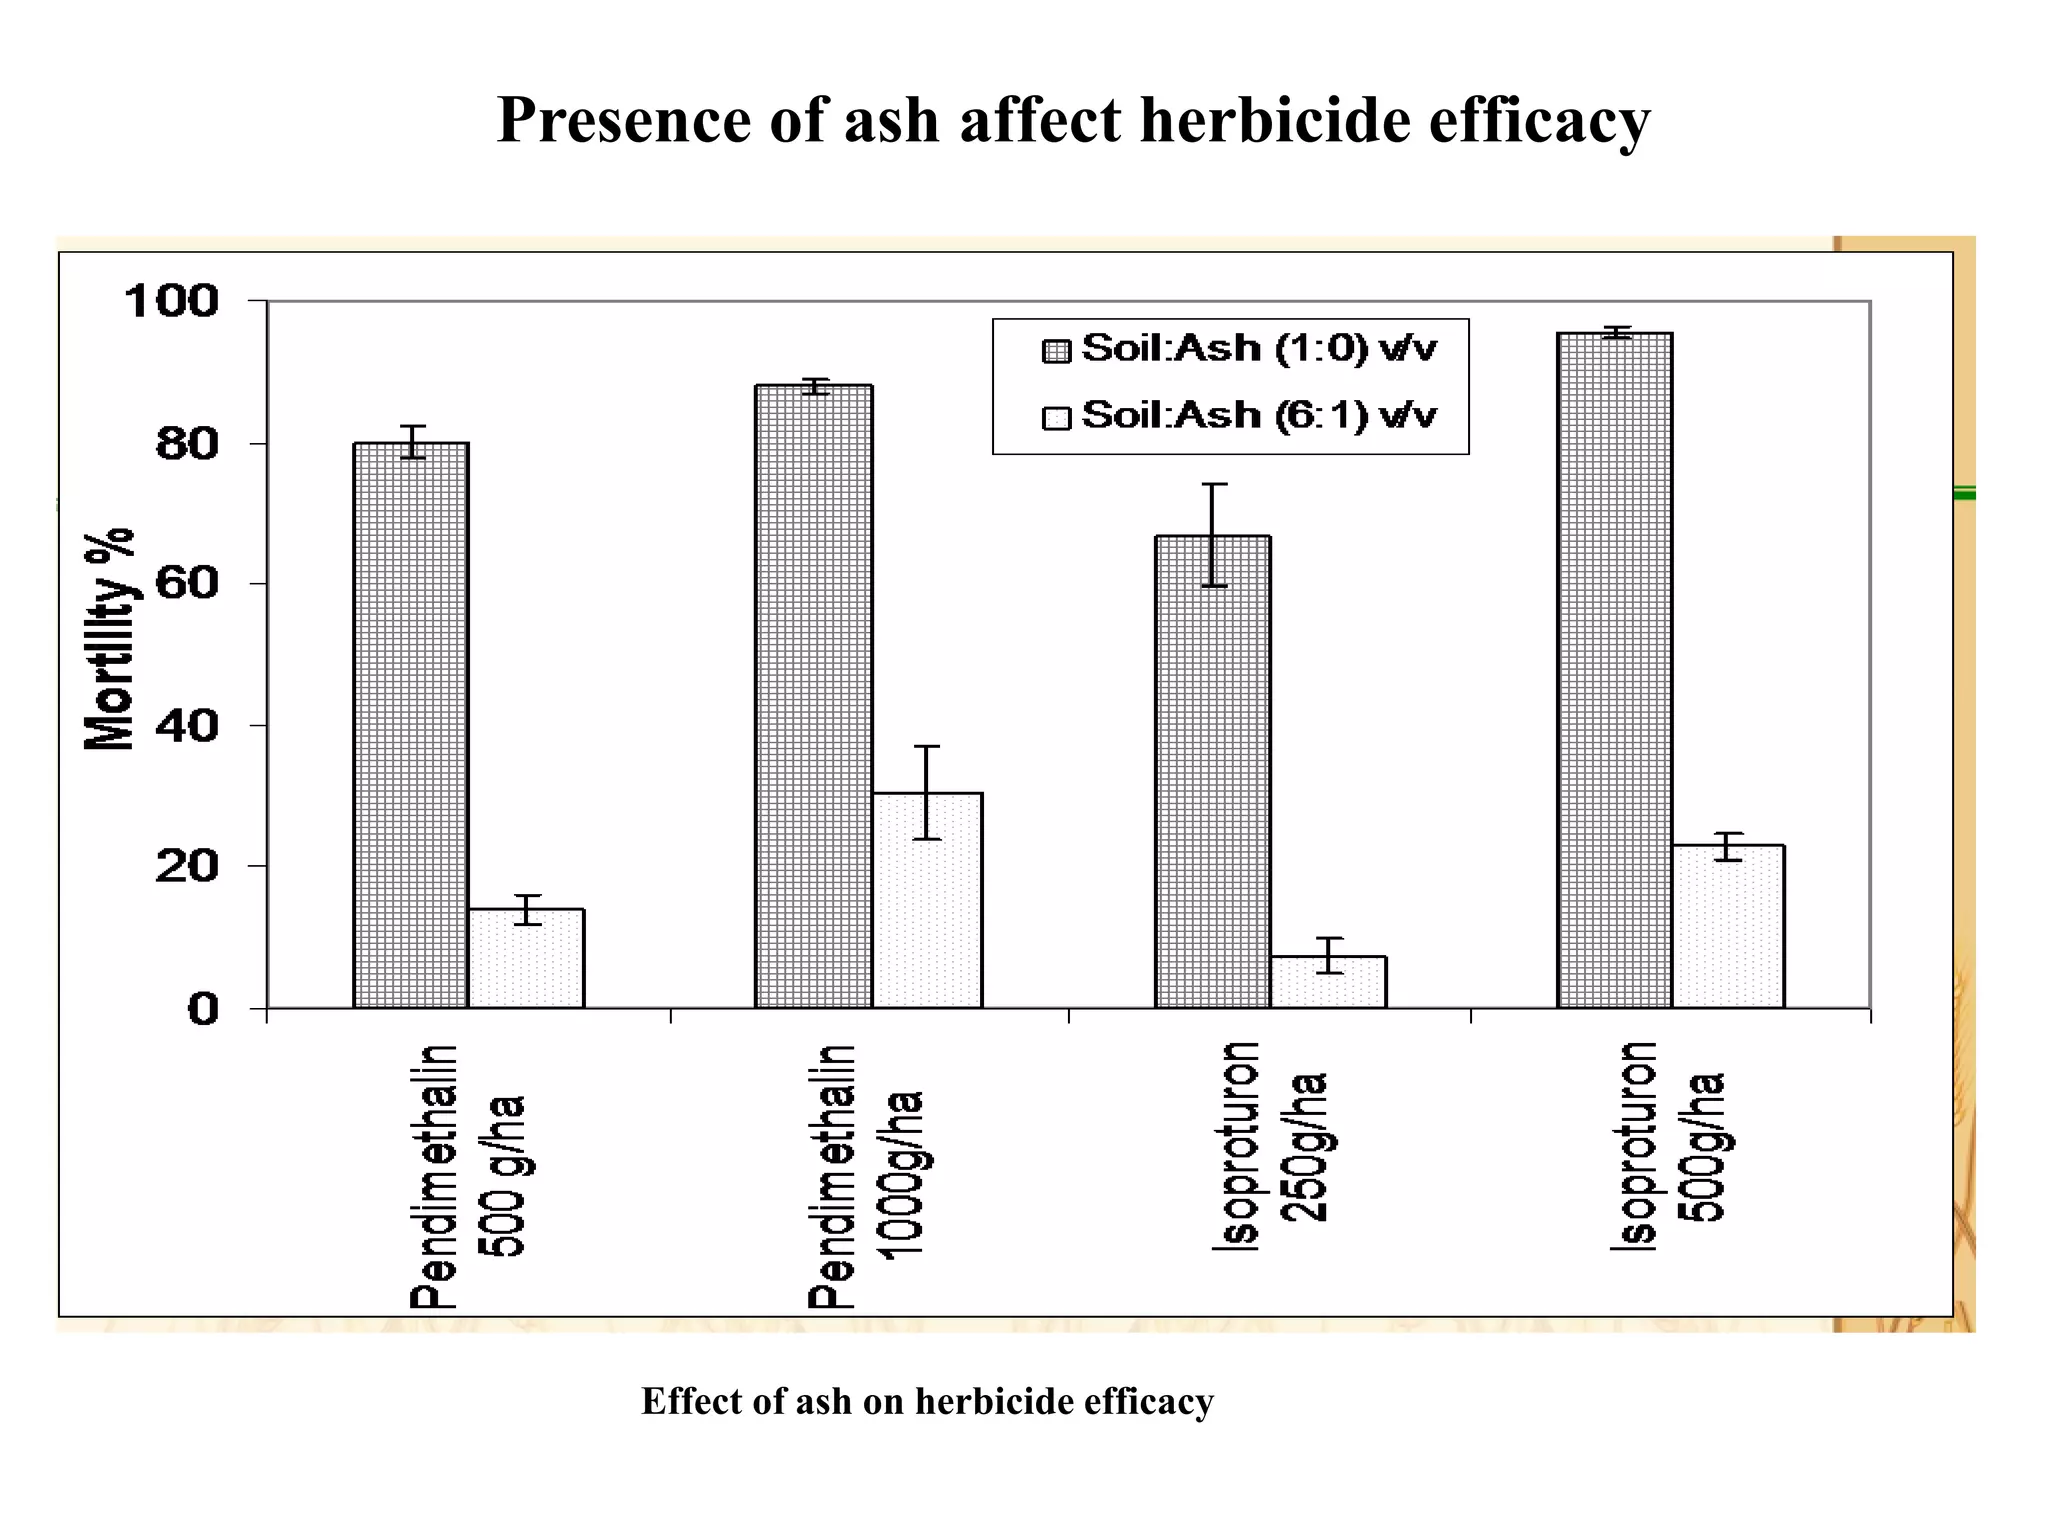
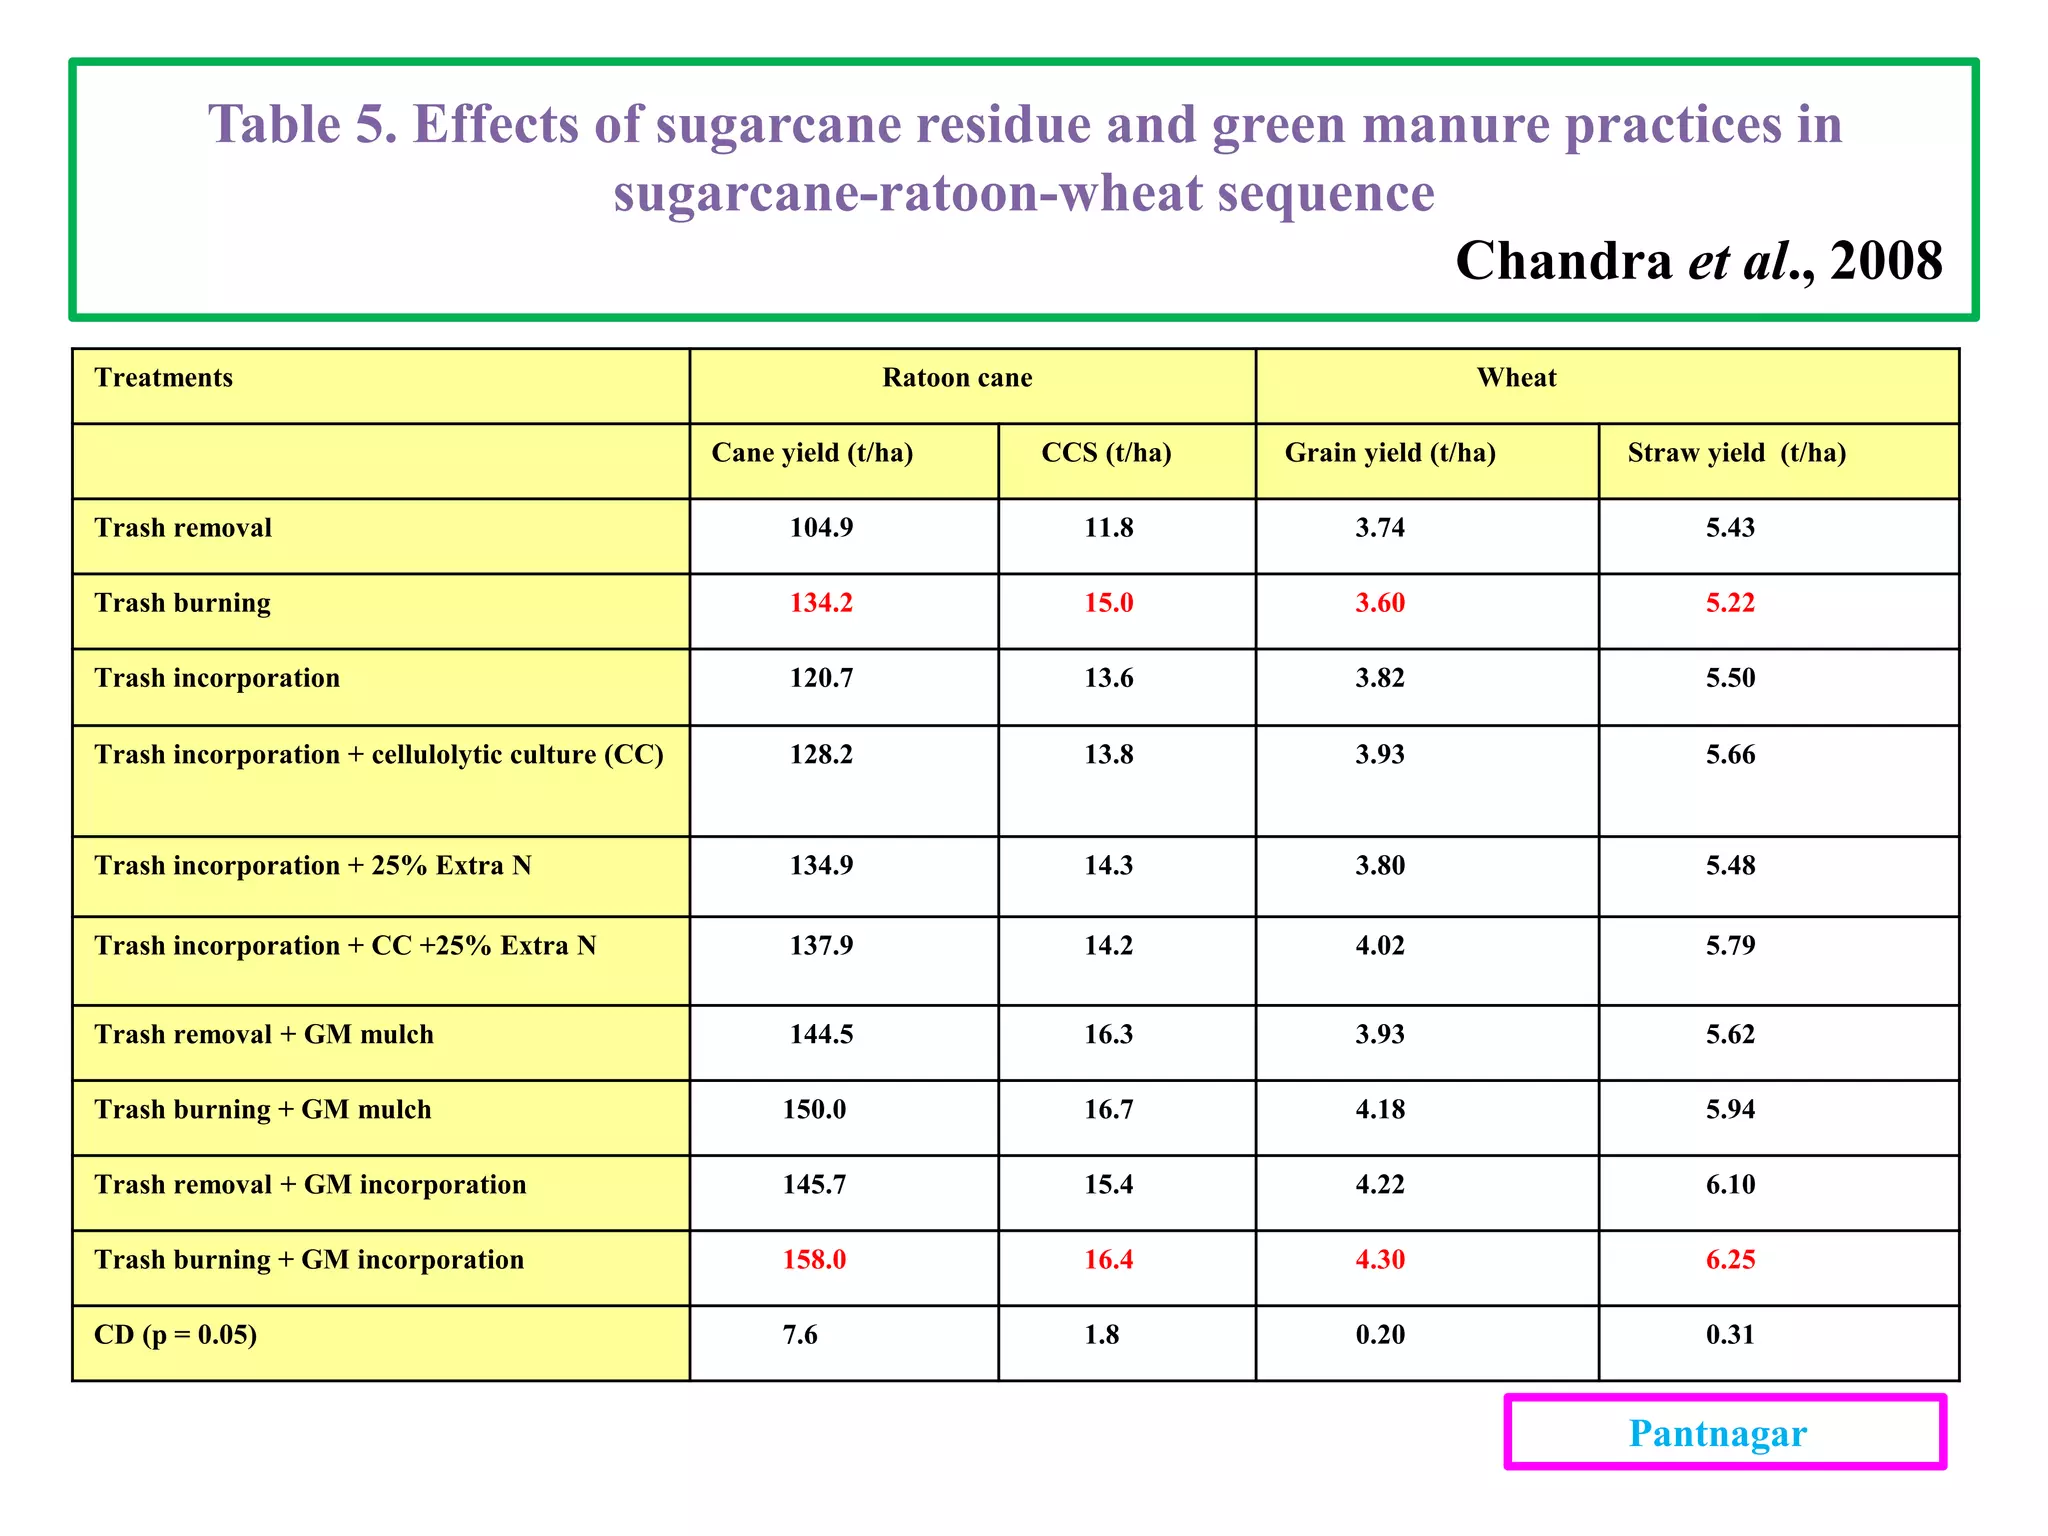
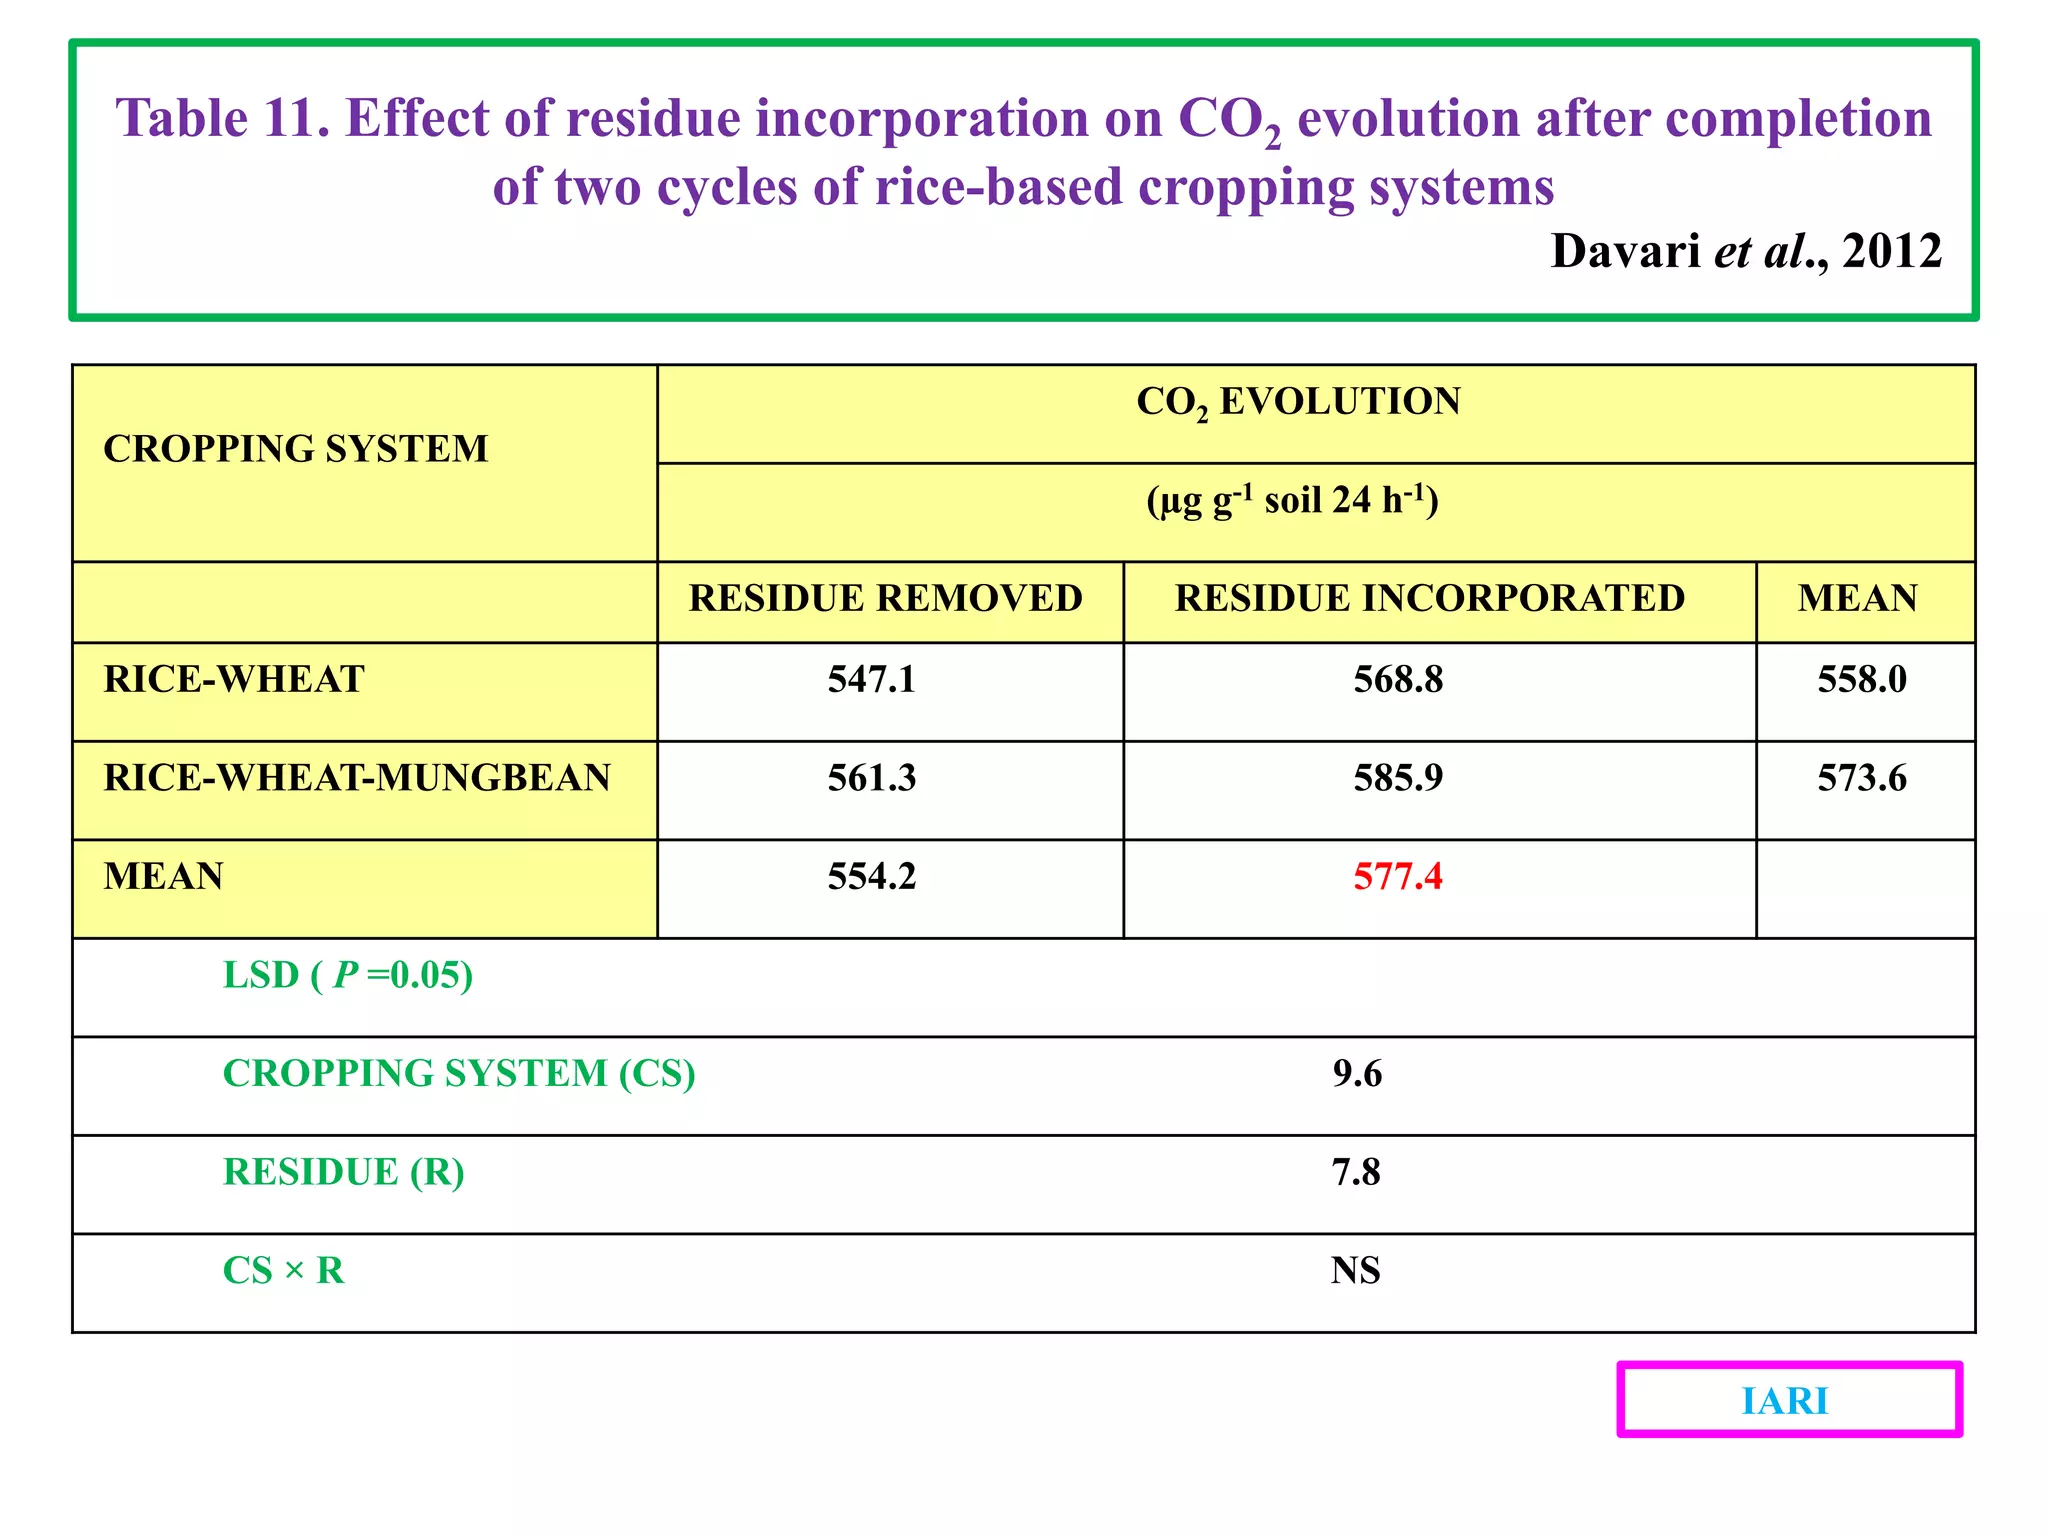
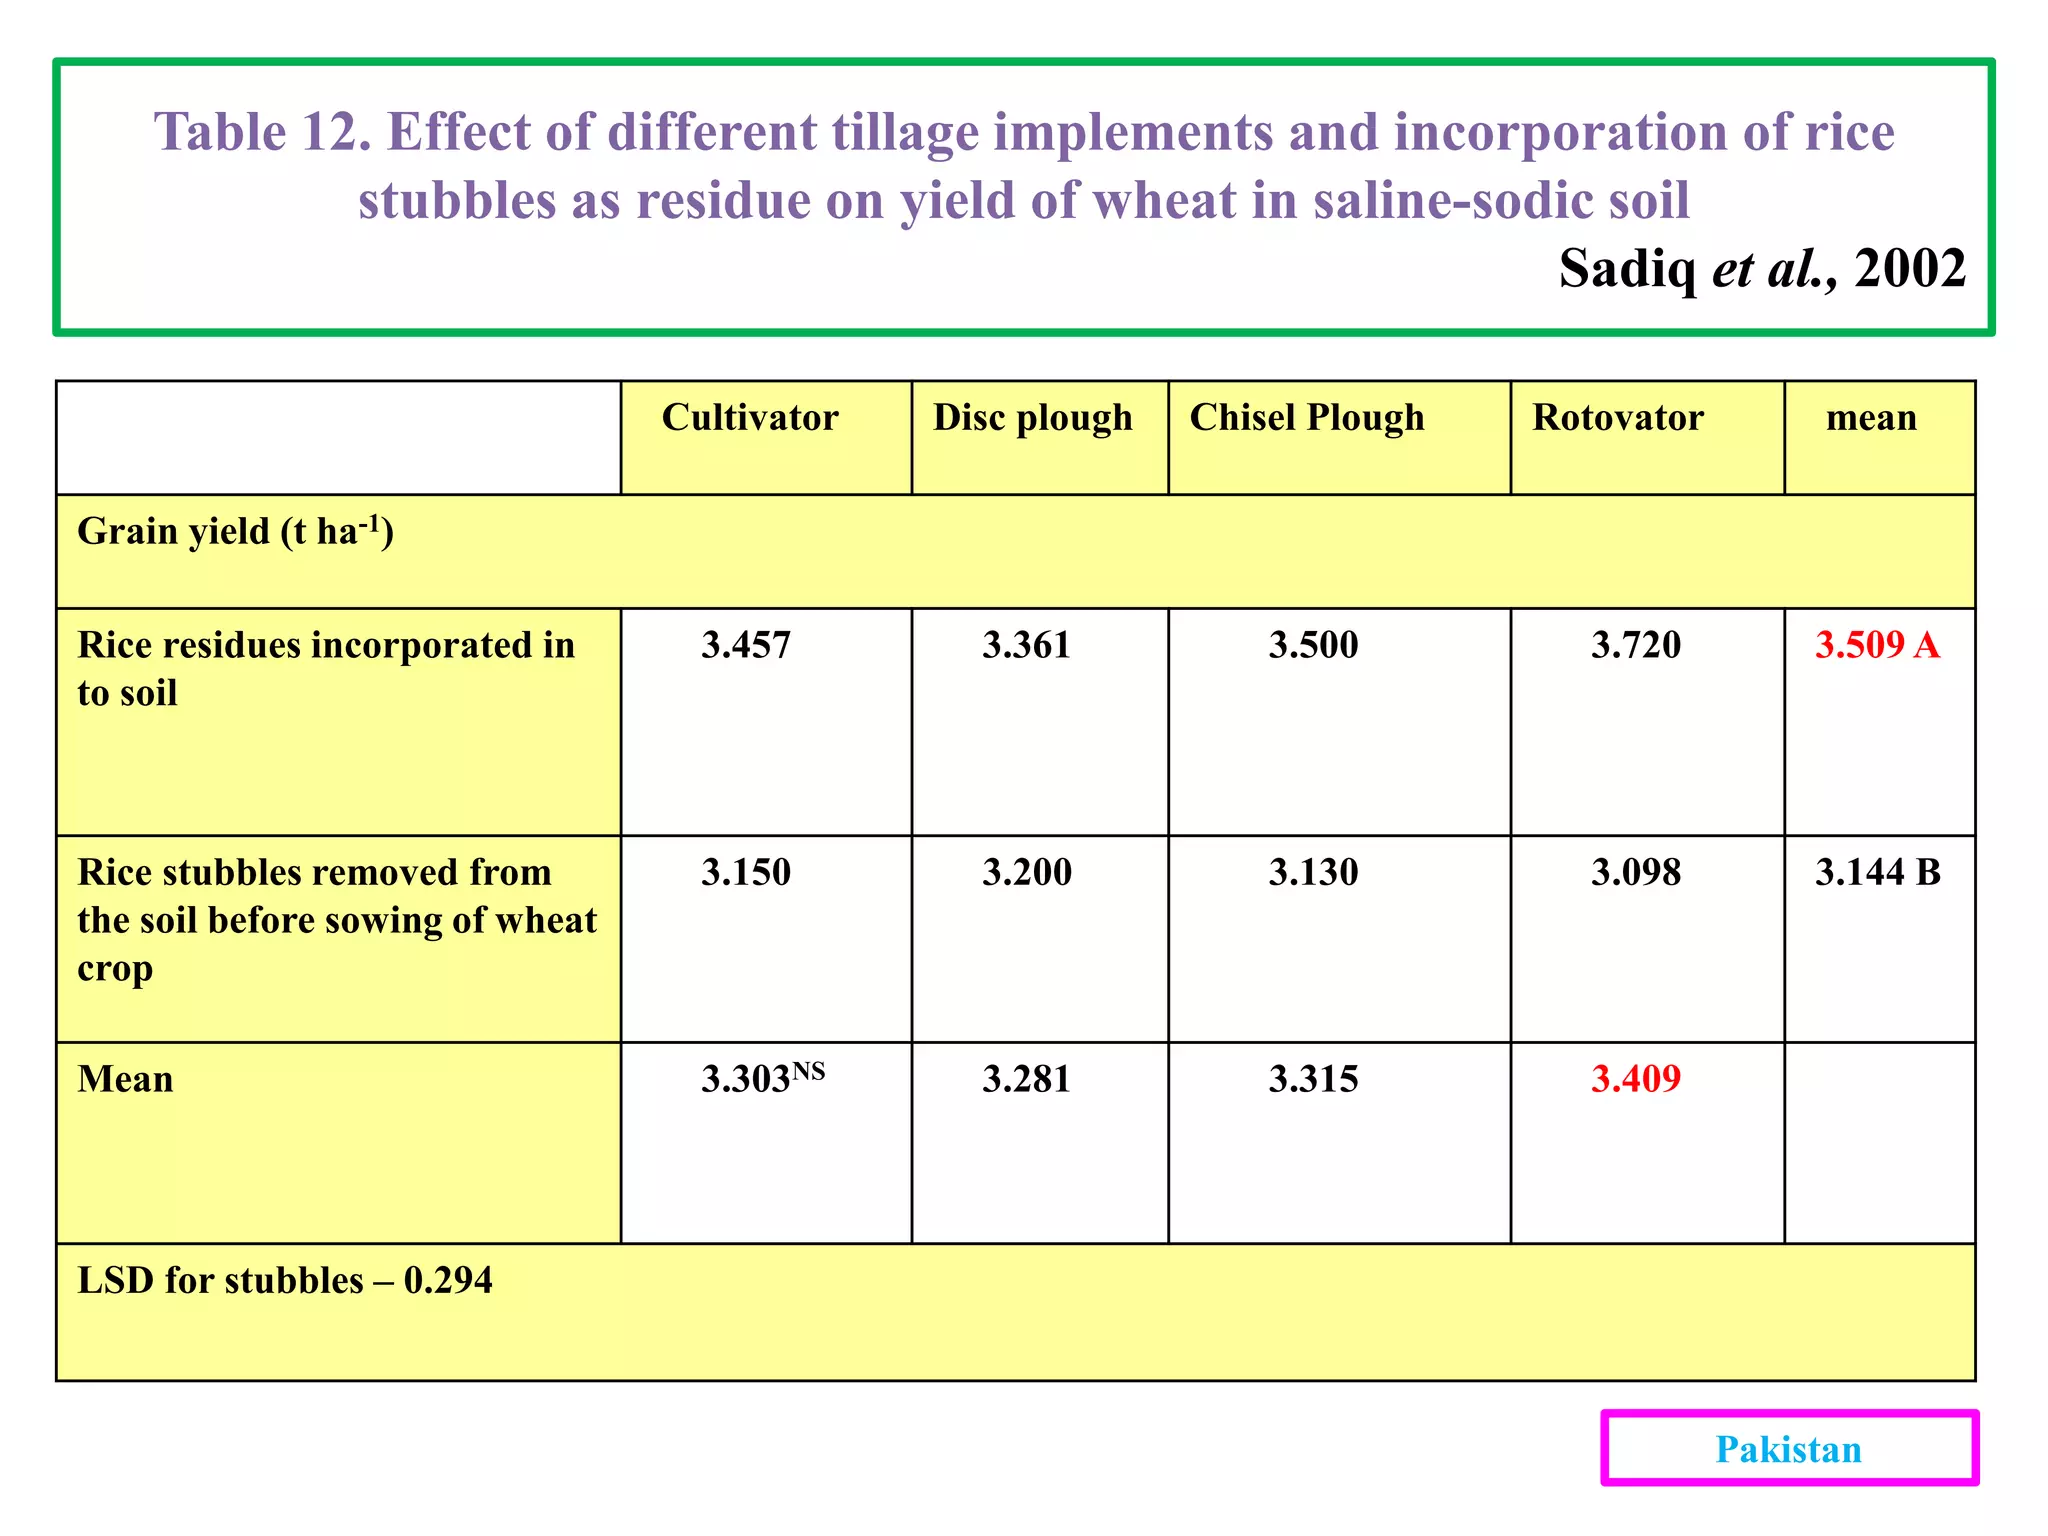
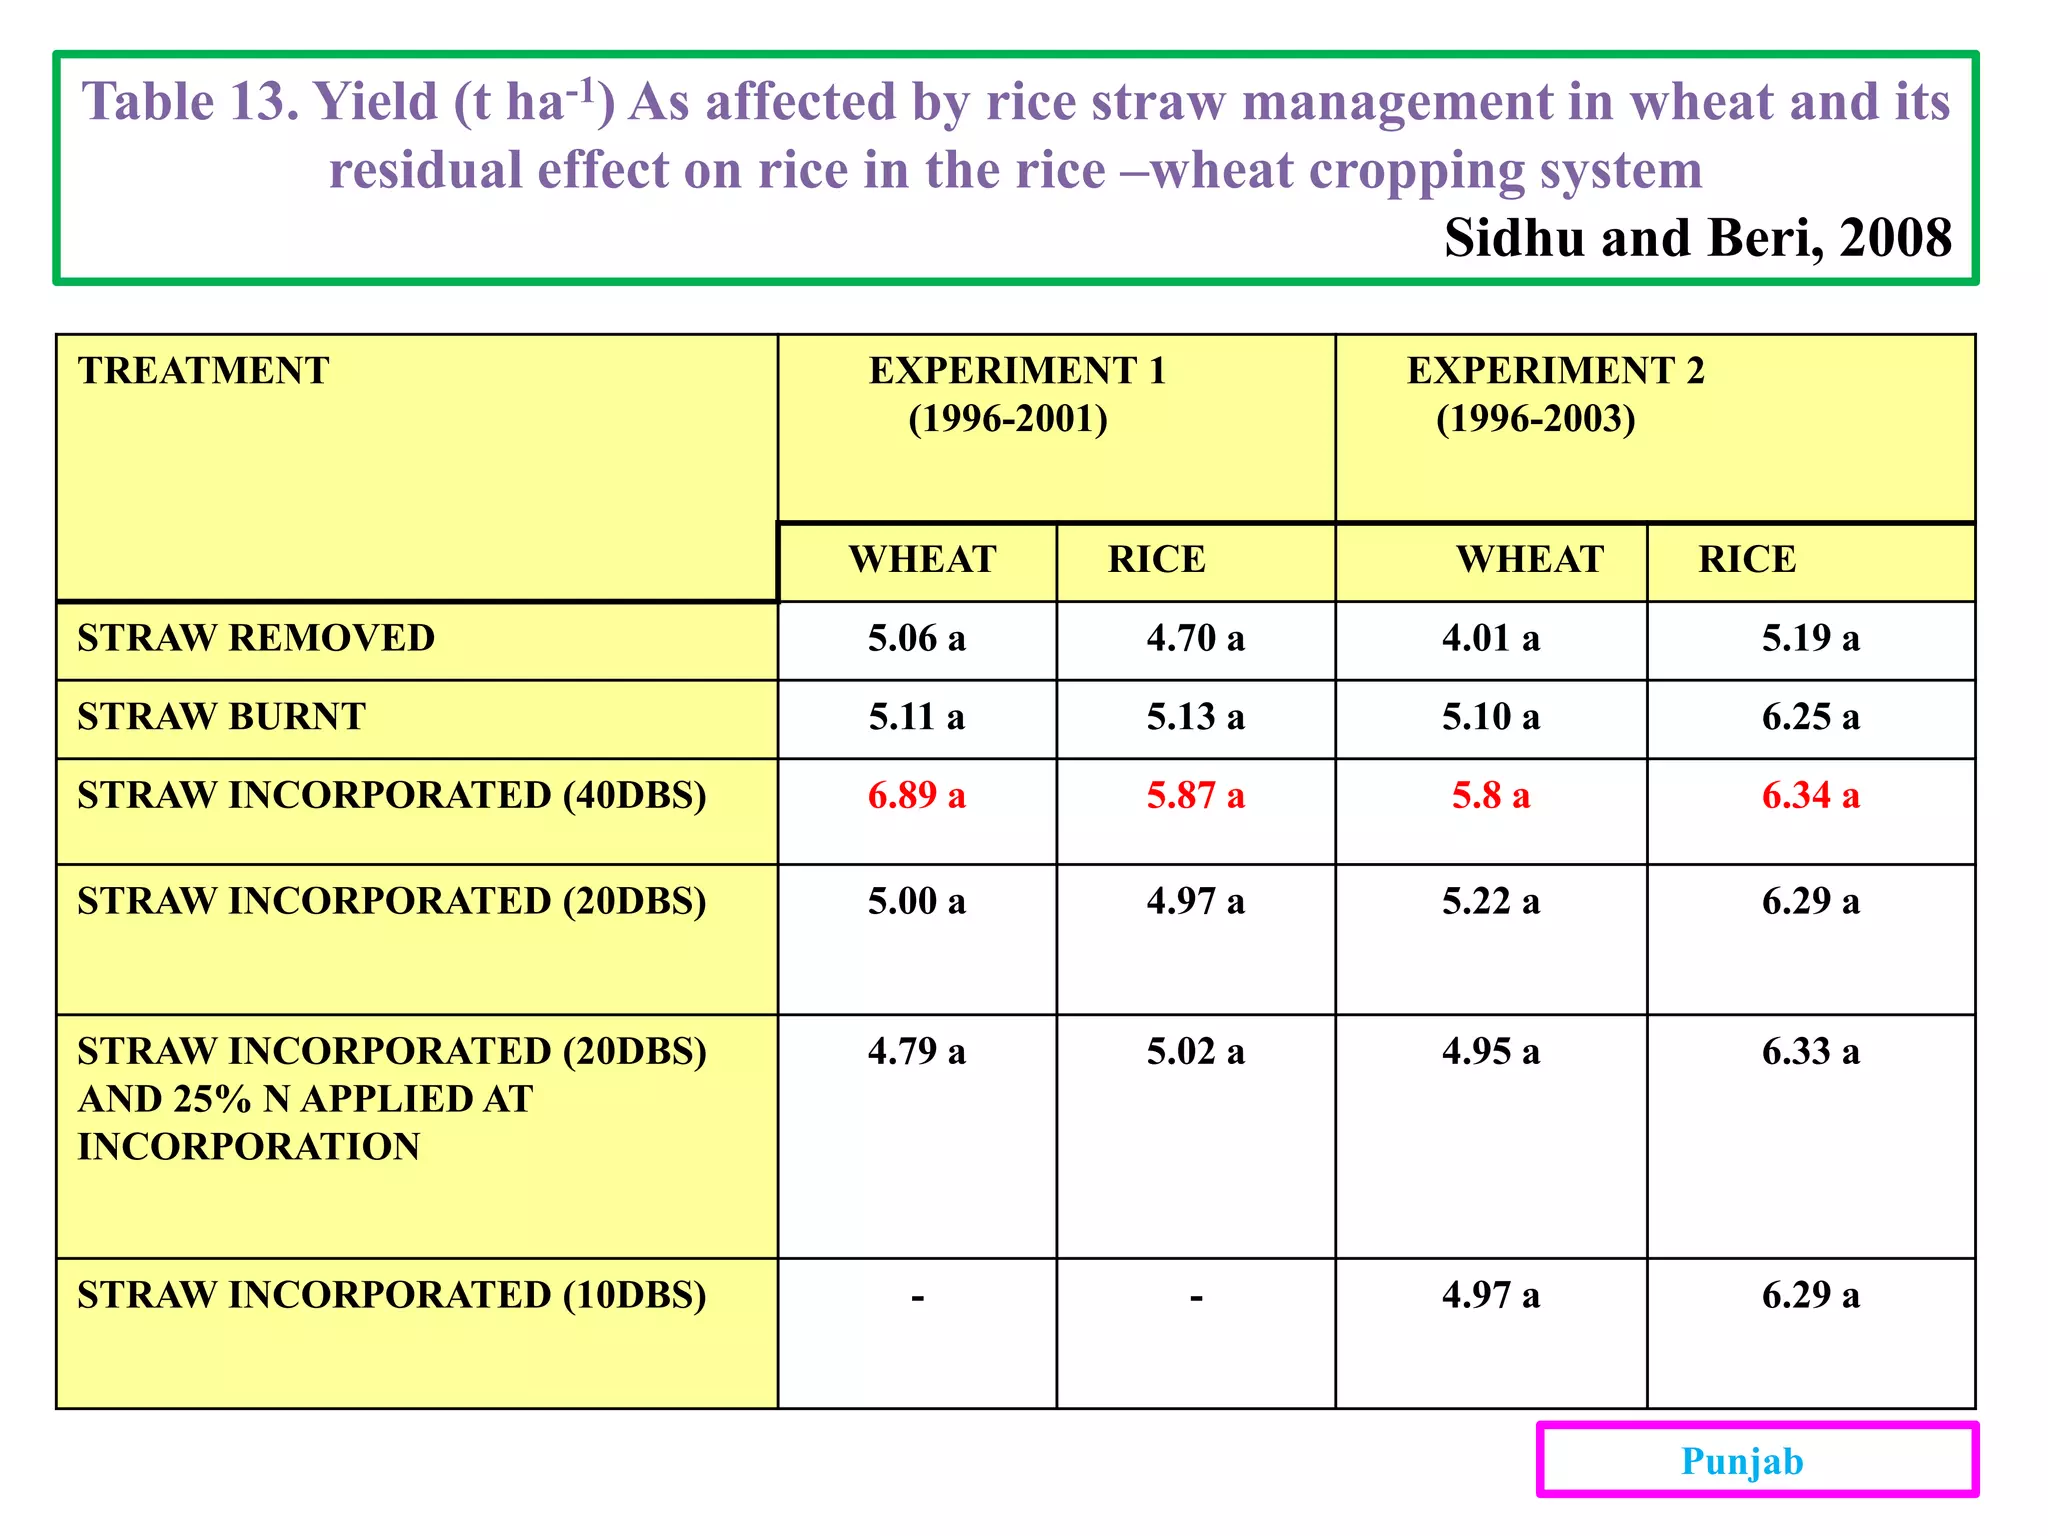
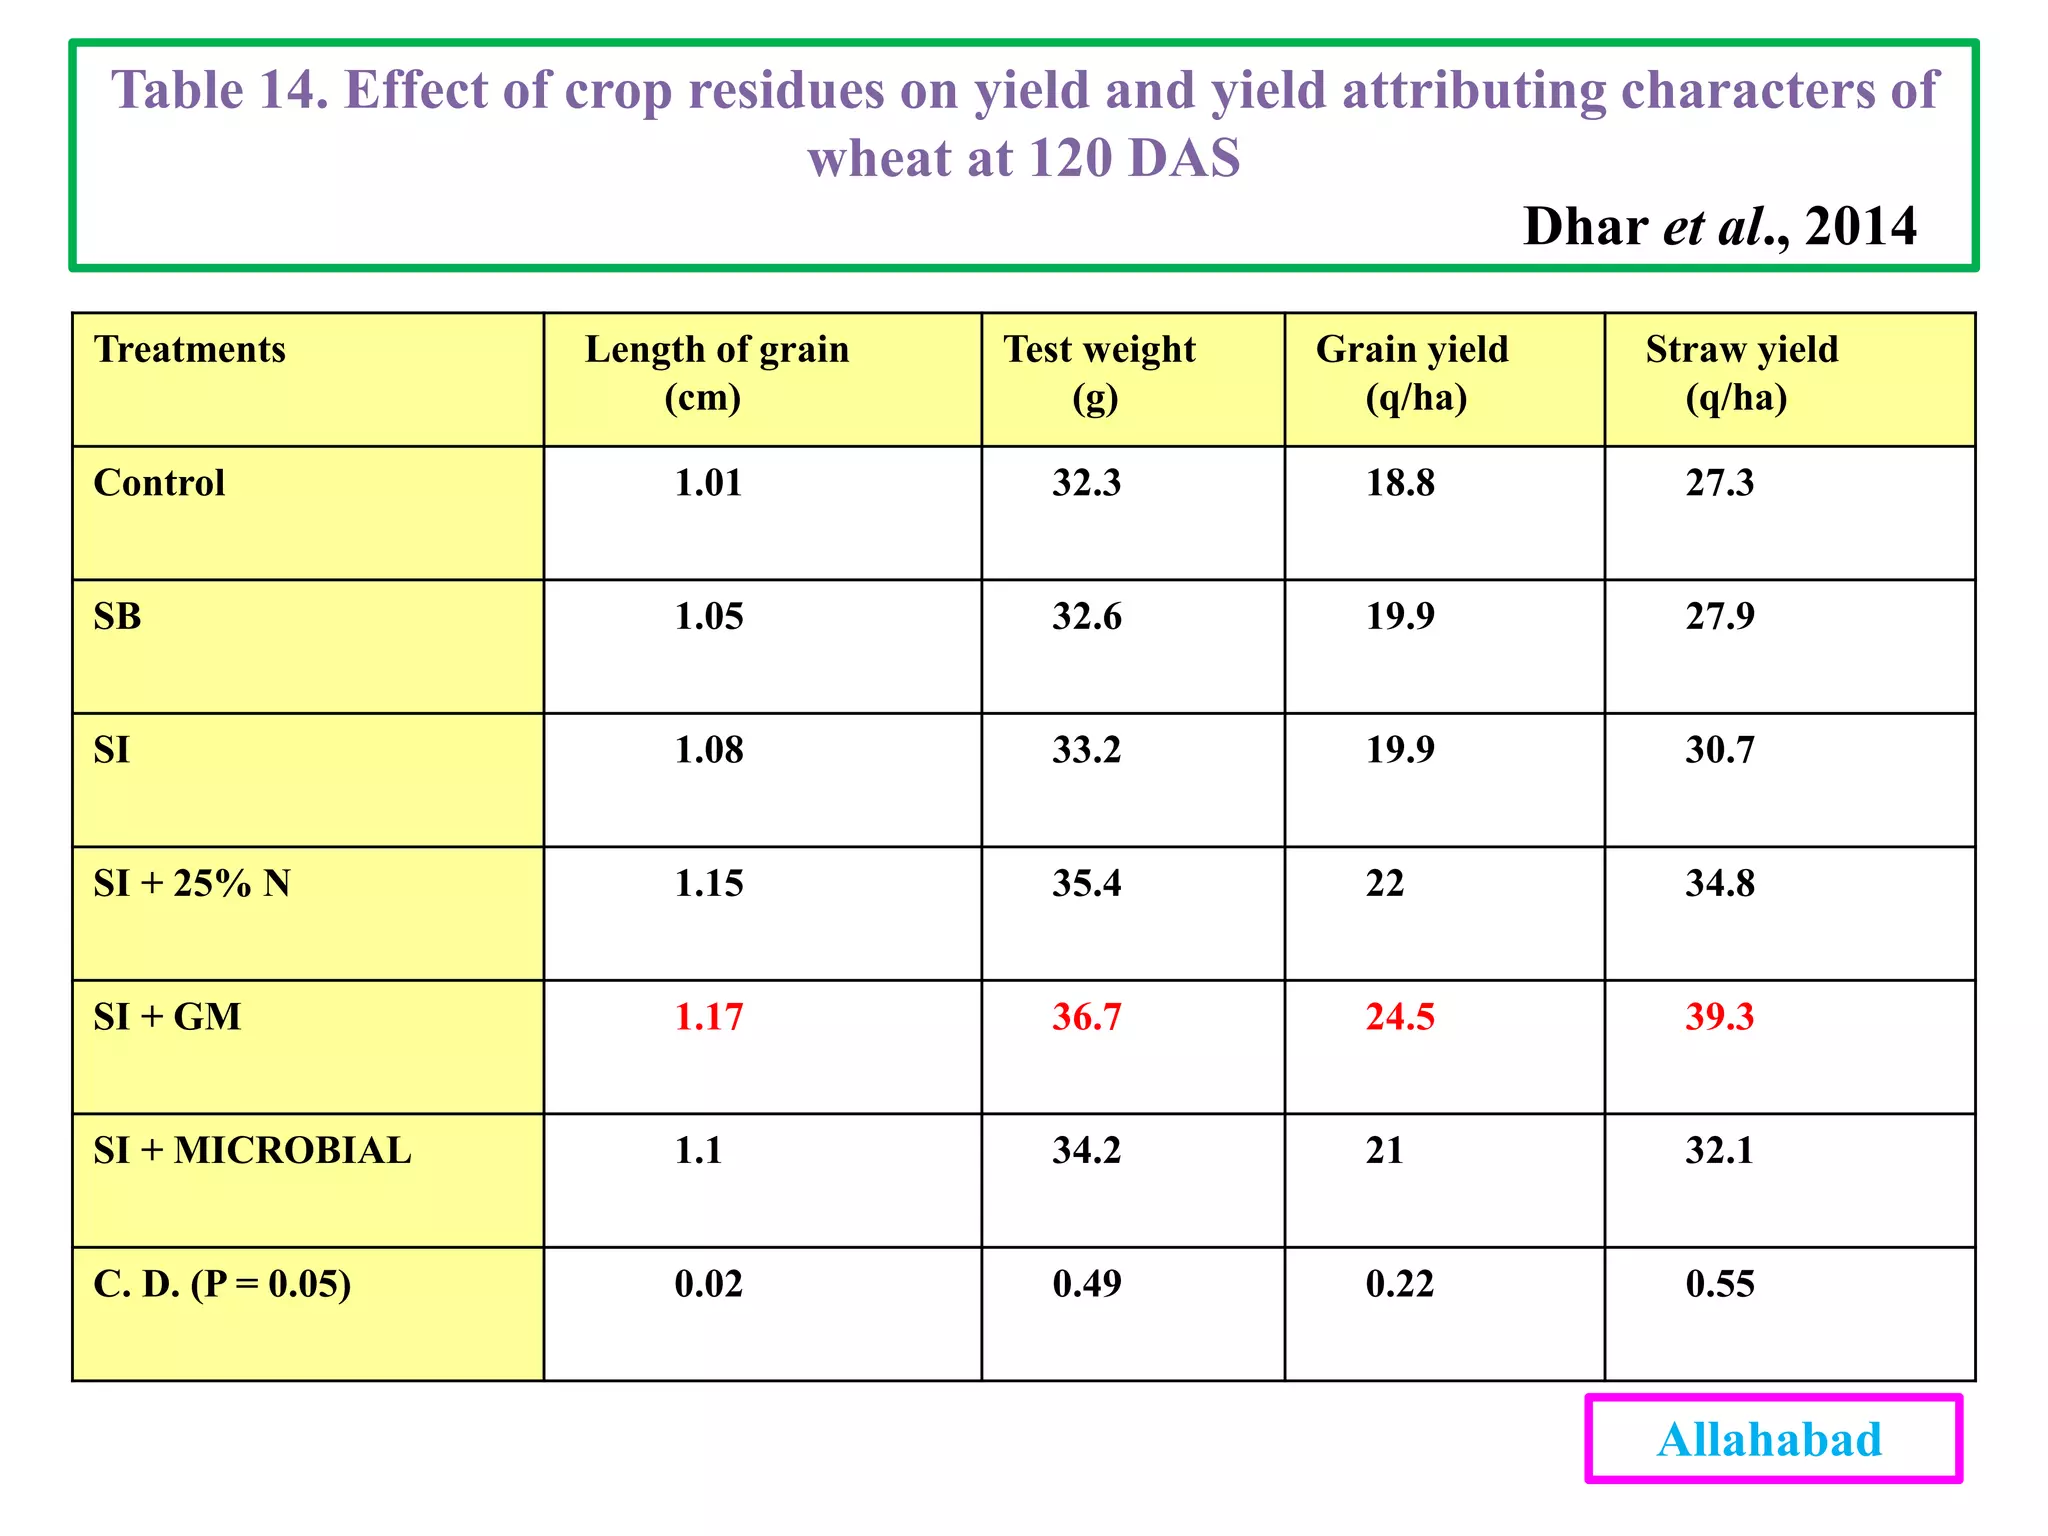
CROP RESIDUE MANAGEMENT, SMART MECHANIZATION AND THEIR
IMPLICATIONS IN TROPICAL COUNTRIES
Presented by-
K.KIRAN KUMAR REDDY
RAD/17-02
Dept. of Agronomy
CREDIT SEMINAR on
CONTENTS
• Introduction
• Availability of crop residues
• Crop residue management
• Smart mechanization
• Implications
• Conclusion
Introduction
• Crop residue is defined as a vegetative crop material left on the field after a crop is
harvested, pruned or processed.
• The Removal of crop residues leads to low soil fertility and there by decreasing crop
production.
• The straw of most cereal crop contains about 35, 10 and 80% of the total N, P and K
taken up by the crop.
(Barnard and Kristoferson,1985)
Table1: Residue production (x 103 t) by rice and different crops grown in rotation with rice in the tropics in
1998
Crops Asia Africa S.America World
R-straw 771804 25968 24153 844782
R-husk 154361 5194 4831 168956
Wheat 379788 27395 25539 946734
Barley 34097 6753 2141 208229
Sugarcane 53855 8561 41880 125227
Cotton 6378 315 69 6801
Oats 2424 342 1604 51604
Corn 166205 38729 54626 604031
Table 1. Global Availability of Crop Residue
FAO (1998)
Asia Africa and South America World
Crops N P K N P K N P K
R-straw 4862.4 771.8 4600.0 327.8 52.5 446.1 5345.6 849.56 5321.7
R-husk 1898.9 265.9 2354.7 308.1 37.1 417.6 5650.9 662.7 7758.2
Wheat 221.6 30.7 235.3 59.9 8.4 73.4 1520.9 220.9 2374.1
Barley 226.2 43.1 360.8 211.9 40.4 338.0 526.0 100.2 839.0
Sugarcan
e
64.4 9.6 63.8 4.4 0.6 4.2 69.5 10.3 68.5
Cotton 15.3 3.9 40.0 12.3 3.1 32.1 325.1 82.6 851.5
Oats 781.2 216.1 1229.9 788.4 148.7 1013.1 5393.0 984.8 6824.3
Table 2. Estimates of N, P, and K (103 t) in Residue Produced by Divergent
Crops Grown in Rotation with Rice in the Tropics in 1998
Estimates of N, P, and K in crop residues were computed by multiplying residue yield data given in Table I with N, P,
and K contents in straw reported by Larson et al. (1978) for South America and by Bhardwaj (1995) and Beri and
Sidhu (1996) for Asia and Africa.
Generation of crop residues in India
• The Ministry of New and Renewable Energy (MNRE, 2009), Govt. of India has
estimated that about 500 Mt of crop residues are generated every year.
• There is a wide variability in the generation of crop residues and their use across
different regions of the country depending on the crops grown, cropping intensity
and productivity of these crops.
• The generation of crop residues is highest in Uttar Pradesh (60 Mt) followed by
Punjab (51 Mt) and Maharashtra (46 Mt).
• Among different crops, cereals generate maximum residues (352 Mt), followed by
fibres (66 Mt), oilseeds (29 Mt), pulses (13 Mt) and sugarcane (12 Mt).
• The cereal crops (rice, wheat, maize, millets) contribute 70% while rice crop alone
contributes 34% to the crop residues.
• Wheat ranks second with 22% of the crop residues whereas fibre crops contribute
13% to the crop residues generated from all crops.
The share of unutilized residues in total residues
generated by different crops in India (calculated
from MNRE, 2009)
Residue generation by different crops in India
(Calculated from MNRE,2009)
Table 3. Crop wise residue generated in various states of India
MNRE ,2014
Crop residue (CR) uses (%) Cereals Legumes
Table 4. crop residues use by purpose and type
MNRE, 2014
CROP RESIDUE MANAGEMENT
Residues management Practices:
1). Burning
2). Removal
3). Incorporation
4). Retention
1. Residue burning
Advantages:
• It facilitates timely planting of next crop
• It clears the land quickly
• It kills soil borne pests and prevents diseases
Disadvantages:
• Loss of nutrients
• Causes air pollution
• Kills beneficial soil micro organisms
• Loss of soil organic matter
• Burning of trees
• Produces Ash
Indian journal of air pollution control, 8(1): 61-67, 2008
Farmer burning paddy residue on the outskirts of Patiala
Why do farmers burn crop residues in
field..??
• The combined use of residues as animal fodder, fuel, paper and
cardboard industries does not exceed 10%
• The farmers are in a hurry to sow the next crop (wheat) and
therefore dispose off the straw immediately by burning
• The machinery for direct incorporation and collection has been
developed but still in its infancy and that is not available to the
farmers
• Even with use of the latest machines like chopper and rotovator,
direct incorporation involves higher cost than normal operations.
• Sowing of wheat by no-till drill is the cheapest option but can not be
practiced without burning/removing the rice residue.
• Combine harvesters spreads the residues in the field, which is
difficult to collect.
View of residue burning in India
Presence of ash affect herbicide efficacy
Effect of ash on herbicide efficacy
Table 5. Effects of sugarcane residue and green manure practices in
sugarcane-ratoon-wheat sequence
Chandra et al., 2008
Treatments Ratoon cane Wheat
Cane yield (t/ha) CCS (t/ha) Grain yield (t/ha) Straw yield (t/ha)
Trash removal 104.9 11.8 3.74 5.43
Trash burning 134.2 15.0 3.60 5.22
Trash incorporation 120.7 13.6 3.82 5.50
Trash incorporation + cellulolytic culture (CC) 128.2 13.8 3.93 5.66
Trash incorporation + 25% Extra N 134.9 14.3 3.80 5.48
Trash incorporation + CC +25% Extra N 137.9 14.2 4.02 5.79
Trash removal + GM mulch 144.5 16.3 3.93 5.62
Trash burning + GM mulch 150.0 16.7 4.18 5.94
Trash removal + GM incorporation 145.7 15.4 4.22 6.10
Trash burning + GM incorporation 158.0 16.4 4.30 6.25
CD (p = 0.05) 7.6 1.8 0.20 0.31
Pantnagar
2. Removal and its use :
Crop residues as live stock feed and shelter
Crop residues as compost
Crop residues as mushroom cultivation
Crop residues as bio-fuel
Crop residues as biochar
Crop residues for producing energy
A view of transport and storage of bhusa as well as baled straw
Straw bale gardening
DAP Planting in rice straw bales Planting in natural soil (control)
Percentage of occurrence Percentage of occurrence
% re-
growth
Damping-
off
wilted plants root knot
nematode
% re -
growth
Damping
-off
wilted plants root knot
nematode
Root Rot Crown rot Root rot Crown rot
15 96.0 4.0 0.0 0.0 0.0 73.0 27.0 0.25 0.10 0.30
30 0.0 0.0 0.0 0.0 0.0 0.0 0.0 0.50 0.50 0.80
45 0.0 0.0 0.0 0.0 0.0 0.0 0.0 1.45 1.30 1.40
60 0.0 0.0 0.15 0.10 0.0 0.0 0.0 1.20 2.70 1.50
75 0.0 0.0 0.10 0.15 0.0 0.0 0.0 2.50 0.80 1.95
90 0.0 0.0 0.10 0.0 0.0 0.0 0.0 2.15 1.20 0.90
105 0.0 0.0 0.25 0.0 0.0 0.0 0.0 3.20 2.40 1.50
120 0.0 0.0 0.10 0.10 0.0 0.0 0.0 2.40 2.70 2.10
135 0.0 0.0 0.15 0.0 0.0 0.0 0.0 2.50 0.0 2.75
Total 96.0 4.0 0.85 0.35 0.0 72.5 27.5 16.15 11.70 13.20
Table 6. OCCURRENCE OF SOILBORNE DISEASES AND ROOT KNOT NEMATODES IN STRAWBERRY PLANTS
GROWN ON COMPACTED RICE STRAW BALES COMPARED WITH NATURALLY INFESTED SOILS
Anwar et al., 2008
Egypt
Crop residues as live stock feed and
shelter
 50% is directly used for the animal feed
 Used as thatching material
 Used for bedding material
 Conserved as hay and use it in lean period
 In Construction of Animal shed
International Journal of Chemical Studies. 5(4): 1038-1042, 2017.
Straw used as cattle feed and making shelter
Crop residues as compost
• For preparing compost, crop residues are used as animal bedding and then heaped
in dung pits.
• In the animal shed each kilogram of straw absorbs about 2-3 kg of urine, which
enriches it with N.
• The residues of rice crop from one hectare land, on composting give about 3 tons
of manure as rich in nutrients as farmyard manure (FYM).
• The rice straw compost can be fortified with P using indigenous source of low
grade rock phosphate to make it value added compost with 1.5 % N, 2.3 % P2O5
and 2.5 % K2O5 .
International Journal of Chemical Studies. 5(4): 1038-1042, 2017.
Preparation of improved quality compost from crop residues
(Courtesy: S.D. Mishra, IARI, New Delhi)
Crop residues as mushroom cultivation
• Wheat and rice straws are excellent
substrates for the cultivation of
mushrooms
International Journal of Chemical Studies. 5(4): 1038-1042, 2017.
Crop residues as biochar
• Biochar is a fine-grained charcoal having high carbon material produced through
slow pyrolysis (heating in the absence of oxygen) of biomass.
• It can potentially play a major role in the long-term storage of carbon in soil.
• Biochar converted from plant biomass contains a unique recalcitrant form of carbon
that is resistant to microbial degradation, therefore can be used as a carbon
sequester, when applied to soil .
• In addition, biochar has been shown to reduce greenhouse gas (GHG) from
agricultural fields and also improve water quality through its strong absorption
nature of contaminants
International Journal of Chemical Studies. 5(4): 1038-1042, 2017.
Study Feedstock Pyrolysis temperature pH C N O CEC
Hale et al., (2013) Corn cob 350 8.97 66 0.6 - 34
Liu X et al., (2014) Corn cob 300 8.1 67.21 0.67 27.63 -
Corn stalk 500 10.1 77.34 2.79 17.23 -
Lee et al., (2013) Paddy straw 500 10.5 86.28 3.25 7.35 -
Zhao et al., (2013) Peanut shell 500 10.5 73.7 - - 44.5
Ahmad et al., (2012) Soyabean
stover
300 7.27 68.81 1.88 24.99 -
Zhao et al., (2013) Wheat straw 500 10.2 62.9 - - 95.5
Table 7. Properties of biochars as affected by feed stocks and pyrolysis
temperature
Possible benefits from biochar application for fertilizer use efficiency and bioremediation of
pesticide-polluted soils.
Low-cost pyrolysis klin for preparation of biochar
Treatments Grain yield
(kg ha-1)
Stover yield
(kg ha-1)
N uptake
(kg ha-1)
P uptake
(kg ha-1)
K uptake
(kg ha-1)
Biochar @ 5 t ha-1 1352 1922 24.87 5.86 19.34
Biochar @ 10 t ha-1 1408 2042 28.71 6.29 22.12
Biochar @ 15 t ha-1 1496 2214 29.73 7.46 23.39
NPK alone 6106 7450 107.59 19.94 76.18
NPK + Biochar @ 5 t ha-1 6152 7504 120.02 20.61 78.42
NPK + Biochar @ 10 t ha-1 6300 7812 123.08 21.96 82.20
NPK + Biochar @ 15 t ha-1 6324 7906 130.09 22.08 88.70
NPK + FYM @ 12.5 t ha-1 + Azospirillum @ 2 kg ha-1 6824 8530 134.68 24.8 90.06
NPK + FYM @ 12.5 t ha-1 + Biochar @ 5 t ha1 +
Azospirillum @ 2 kg ha-1
7336 8878 138.88 26.24 94.18
NPK + FYM @ 12.5 t ha-1 +Biochar @ 10 t ha-1 +
Azospirillum @ 2 kg ha-1
7874 9170 154.63 33.34 105.18
NPK + FYM @ 12.5 t ha-1 + Biochar @15 t ha-1 +
Azospirillum @ 2 kg ha-1
7996 9436 160.28 34.02 109.74
Absolute Control 1330 1910 23.34 4.28 18.88
CD (0.05) 297 359 8.82 2.86 6.61
Table 8. Effect of biochar on yield and nutrient uptake by hybrid maize
Coumaravel et al., 2015
Tamilnadu
Treatments Available N
(kg/ha)
Available P
(kg/ha)
Available K
(kg/ha)
Organic carbon
(g/kg)
Biochar @ 5 t ha-1 185 21.1 543 4.82
Biochar @ 10 t ha-1 189 22.8 555 4.89
Biochar @ 15 t ha-1 192 23.6 569 4.91
NPK alone 198 25.5 593 5.12
NPK + Biochar @ 5 t ha-1 203 26.5 603 5.21
NPK + Biochar @ 10 t ha-1 205 29.0 609 5.25
NPK + Biochar @ 15 t ha-1 207 30.1 615 5.31
NPK + FYM @ 12.5 t ha-1 + Azospirillum @ 2 kg ha-1 209 31.7 623 5.40
NPK + FYM @ 12.5 t ha-1 + Biochar @ 5 t ha1 +
Azospirillum @ 2 kg ha-1
210 32.2 626 5.51
NPK + FYM @ 12.5 t ha-1 +Biochar @ 10 t ha-1 +
Azospirillum @ 2 kg ha-1
215 32.6 629 5.71
NPK + FYM @ 12.5 t ha-1 + Biochar @15 t ha-1 +
Azospirillum @ 2 kg ha-1
217 33.3 634 5.91
Absolute Control 175 19.7 530 3.22
CD (0.05) 9 1.7 15 0.05
Table 9. Effect of biochar application on soil available NPK and Organic
carbon status
Coumaravel et al., 2015
Tamilnadu
Crop residues for producing energy
• Kalpataru Power Transmission Limited (KPTL), a leading global engineering,
procurement and construction player in power sector, is successfully generating
energy from crop residues in Ganganagar and Tonk districts of Rajasthan for the
past several years.
• At Tonk, the plant utilizes 80,000 tons of biomass, mostly from mustard crop,
annually and generates 1.5 lakh kWh energy per day
Thermal plant of Kalpataru Power Transmission Limited producing energy from crop residues at
Tonk, Rajasthan.
3. Residue incorporation
• Increases soil organic matter and N, P and K contents in soil.
• Beneficial in recycling nutrients
• But leads to temporary immobilization of nutrients (e.g., Nitrogen)
• Extra nitrogenous fertilizer needs to be added to correct the high C:N ratio at the
time of residue incorporation
International Journal of Chemical Studies. 5(4): 1038-1042, 2017.
Table 10. Effect of residue incorporation on microbial population in soil
after completion of two cycles of Rice-based cropping systems
Davari et al., 2012
Bacteria Fungi Actinomycetes
(cells × 10-4 g-1 soil) (cells × 10-4 g-1 soil) (cells × 10-4 g-1 soil)
Cropping system RR RI Mean RR RI Mean RR RI Mean
RW 4.8 6.5 5.7 2.3 2.6 2.5 9.2 19.2 14.2
RWM 5.7 7 1 6.4 2.9 4.4 3.7 12.4 21.6 17.0
Mean 5.3 6.8 - 2.6 3.5 - 10.8 20.4 -
LSD ( p = 0.05)
Cropping system
(CS)
0.6 0.8 2.1
Residue (R) 0.5 0.1 1.7
CS × R 0.8 1.0 2.5
RW – RICE-WHEAT ; RWM – RICE-WHEAT-MUNG IARI
Table 11. Effect of residue incorporation on CO2 evolution after completion
of two cycles of rice-based cropping systems
Davari et al., 2012
CROPPING SYSTEM
CO2 EVOLUTION
(µg g-1 soil 24 h-1)
RESIDUE REMOVED RESIDUE INCORPORATED MEAN
RICE-WHEAT 547.1 568.8 558.0
RICE-WHEAT-MUNGBEAN 561.3 585.9 573.6
MEAN 554.2 577.4
LSD ( P =0.05)
CROPPING SYSTEM (CS) 9.6
RESIDUE (R) 7.8
CS × R NS
IARI
Table 12. Effect of different tillage implements and incorporation of rice
stubbles as residue on yield of wheat in saline-sodic soil
Sadiq et al., 2002
Cultivator Disc plough Chisel Plough Rotovator mean
Grain yield (t ha-1)
Rice residues incorporated in
to soil
3.457 3.361 3.500 3.720 3.509 A
Rice stubbles removed from
the soil before sowing of wheat
crop
3.150 3.200 3.130 3.098 3.144 B
Mean 3.303NS 3.281 3.315 3.409
LSD for stubbles – 0.294
Pakistan
TREATMENT EXPERIMENT 1
(1996-2001)
EXPERIMENT 2
(1996-2003)
WHEAT RICE WHEAT RICE
STRAW REMOVED 5.06 a 4.70 a 4.01 a 5.19 a
STRAW BURNT 5.11 a 5.13 a 5.10 a 6.25 a
STRAW INCORPORATED (40DBS) 6.89 a 5.87 a 5.8 a 6.34 a
STRAW INCORPORATED (20DBS) 5.00 a 4.97 a 5.22 a 6.29 a
STRAW INCORPORATED (20DBS)
AND 25% N APPLIED AT
INCORPORATION
4.79 a 5.02 a 4.95 a 6.33 a
STRAW INCORPORATED (10DBS) - - 4.97 a 6.29 a
Table 13. Yield (t ha-1) As affected by rice straw management in wheat and its
residual effect on rice in the rice –wheat cropping system
Sidhu and Beri, 2008
Punjab
Treatments Length of grain
(cm)
Test weight
(g)
Grain yield
(q/ha)
Straw yield
(q/ha)
Control 1.01 32.3 18.8 27.3
SB 1.05 32.6 19.9 27.9
SI 1.08 33.2 19.9 30.7
SI + 25% N 1.15 35.4 22 34.8
SI + GM 1.17 36.7 24.5 39.3
SI + MICROBIAL 1.1 34.2 21 32.1
C. D. (P = 0.05) 0.02 0.49 0.22 0.55
Table 14. Effect of crop residues on yield and yield attributing characters of
wheat at 120 DAS
Dhar et al., 2014
Allahabad
Table 15. Effect of trash incorporation on cane and Commercial Cane
Sugar yield (t/ha )
Jadhav, 2003
Treatment 2000-2001 2001-2002 % increases over
control
CCS
(t ha-1)
Yield CCS Yield CCS Yield (t ha-1)
Chopped trash @ 2.5 t ha-1 132 15.2 139 14.5 3.43 0.20
Chopped trash @ 5.0 t ha-1 137 17.3 144 16.5 6.68 14.4
Chopped trash @ 7.5 t ha-1 140 18.5 147 17.7 9.10 22.2
Unhopped trash @ 2.5 t ha-1 131 15.2 138 14.5 2.37 1.12
Unchopped trash @ 5.0 t ha-1 135 16.0 142 15.3 5.57 8.14
Unchopped trash @ 7.5 t/ha 139 17.3 146 16.6 8.08 14.57
FYM @ 5.0 t ha-1 136 15.3 143 14.6 6.51 1.85
No trash (control) 128 15.0 134 14.4 - -
LSD @ 5% 3.18 1.85 5.90 1.2 - -
Pune
Parameter Initial status
(Depth 10-20 cm)
Retained Incorporation Removed Burnt
pH 7.83 7.95 7.35 7.40 7.65
Water stable aggregates
>250 μm
51.9 57.4 56.9 46.3 38.2
Organic carbon (%) 0.46 0.53 0.58 0.43 0.47
Available N (kg/ha) 64.6 89.0 83.0 32.0 21.0
Available P (kg/ha) 25.8 39.0 42.0 21.0 29.0
Available K (kg/ha) 52.1 67.0 69.0 48.0 55.0
Table 16. Effect of crop residues management in rice wheat rotation (3 years)
on physicochemical properties of soil
Naresh, 2013
Meerut
Treatments Wet season 2000 Dry season 2000
Grain yield (kg
ha-1)
Straw yield
(kg ha-1)
Grain yield (kg
ha-1)
Straw yield
(kg ha-1)
T1- 100% Straw incorporation 3698 ab 5300 b 7306 a 5525
T2- 50% straw incorporation 3389 c 5290 b 6587 b 5275
T3- 100% straw + Green Manure 3988 a 5985 a 7597 a 5925
T4- 100% straw burning 3512 b 5900 a 6206 b 5925
T5- removal of straw 3181 c 4725 c 6334 b 5325
Table 17. Influence of crop residue treatments on grain and straw yield of rice
Surekha et al, 2003
IIRR
4. Residue retention
• Residue retention on the surface of
soil seems to be a better option for
conservation of soil and avoiding
water losses by evaporation.
• It also reduces the weed seed
germination and helps in building of
soil microbial populations results in
increasing soil organic carbon-a direct
indicator of soil health.
Dry weight of weeds, as affected by soil tillage systems and levels of surface cover (SC)
Correlation between surface cover and weed dry mass reduction
Tillage and residue
management
WATER CONTENT (cm3 cm-3)
SOIL DEPTH (0-15 cm ) SOIL DEPTH (15-30 cm )
SOIL –WATER SUCTION (K Pa) SOIL –WATER SUCTION (K Pa)
0 33 500 1500 0 33 500 1500
T1: CT+ 1/3 RI 0.40 0.28 0.14 0.11 0.43 0.31 0.16 0.13
T2 :TFP+ FRR 0.39 0.29 0.14 0.10 0.44 0.32 0.16 0.12
T3 : ZT+ 1/3 RR 0.41 0.33 0.17 0.13 0.47 0.35 0.19 0.16
T4: ZTT + FRA 0.57 0.38 0.16 0.14 0.63 0.43 0.19 0.17
Table 18. Effect of tillage and residue management treatments on soil volume
water content at various soil – water suction points
Choudari et al., 2015
CT- conventional tillage. RI- Residue incorporation. TFP- tillage as per farmers practice.
FRR- Full residue removal. ZT- zero tillage. RR- residue retention. ZTT- Zero tillage with
turbo machine. FRA- Full residue anchored/Retention
Haryana
TREATMENT
60 DAS SMC 75 DAS SMC
0-0.2 m 0.21-0.4 m 0.4-0.6 m 0-0.2 m 0.21-0.4 m 0.4-0.6 m
SESAME 22.2 23.5 24.6 34.3 33.4 35.2
SORGHUM 21.2 22.6 23.4 36.6 26.2 28.5
RICE 21.1 21.9 22.7 37.9 29.0 30.4
SUDAN GRASS 19.5 22.1 23.6 37.6 31.4 28.6
CONTROL 17.9 19.3 22.1 23.6 21.4 23.5
LSD0.05 1.1 1.8 1.9 2.7 1.6 1.483
Table 19. Effect of mulching on soil moisture content at different soil
depth and days after sowing
Teame et al., 2017
Ethopia
MULCH DF DM PH NCP NSPC TSW GY(kg/ha)
Sudan grass 40.0 92.9 83.0 37.5 40.0 3.8 664.0
Sesame straw 40.0 93.9 85.0 35.4 43.0 3.5 525
Sorghum straw 41.0 92.4 79.0 36.3 45.0 3.4 520
Rice straw 41.0 92.2 74.0 26.3 39.0 3.2 470
Control 38.0 90.4 54.0 22.8 34.0 3.2 190
LSD 0.05 2.7 1.1 1.6 6.3 2.4 0.2 35.3
Table 20. Effect of organic mulching on phenology, yield and yield
components of sesame
Teame et al., 2017
DF = days to 50% flowering, DM = days to 90% maturity, PH = plant height (cm), BR = number of
branches per plant, NCP = number of capsules per plant, NSPC = number of seeds per capsule, TSW =
thousand-seed weight (g), and GY = grain yield.
Ethopia
Residue rate
(kg/ha)
N (kg/ha) Grain yield (kg/ha) Biological yield
(kg/ha)
Harvest index (%)
0 0 264 853 26.48
35 581 1901 25.61
70 678 2162 26.73
500 0 907 2783 32.33
35 1514 3169 37.95
70 1134 3123 33.01
1000 0 851 1555 33.82
35 1089 2465 38.08
70 1569 4666 41.68
Table 21. Effect of crop residue and nitrogen rates on yield components of
wheat
Sadeghi and Bahrani (2009)
Iran
SMART MECHANIZATION
A view of straw chopper, hay rake and straw baler
Straw baler
• It cuts the straw from combine
harvested fields and makes bundles.
• Straw burning causes environmental
pollution
Straw reaper/combine
• It cuts the standing straw left in
the field after combining and
throw it in a trolley at the rear.
• 1000 kg of straw/ha & 40-50
kg/ha grain can be recovered.
Spreading of loose paddy straw with stubble shaver
HAPPY SEEDER
• Simultaneously cuts the standing straw,
plants wheat and throw the straw on the
planted seeds
The 4th Regional Forum on Sustainable Agricultural Mechanization in Asia and the Pacific
Sowing of wheat with spatially modified no till Drill
Rotary disc no till drill
• Rotary disc cuts the residue and
make a slit for sowing of seed.
• The machine is use for direct
sowing of paddy over wheat straw
under dry condition.
Role of Machinery for crop residue management
Village
Grain yield (t/ha) Straw yield (t/ha)
I R M
%
Change I R M
%
Change
Dhatt 1 4.5 ± 0.21 4.3 ± 0.09 5.2 ± 0.18 24 6.6 ± 0.25 6.5 ± 0.19 6.9 ± 0.24 6
Dhatt 2 5.1 ± 0.23 4.5 ± 0.11 4.9 ± 0.12 8 7.2 ± 0.27 6.3 ± 0.20 6.6 ± 0.17 6
Hissowal 1 5.1 ±0.23 4.5 ± 0.19 5.0 ± 0.16 10 6.8 ± 0.30 6.5 ± 0.41 6.7 ± 0.22 3
Hissowal 2 4.3 ± 0.17 4.6 ± 0.21 5.1 ± 0.13 12 6.9 ± 0.33 6.7 ± 0.24 6.8 ± 0.15 2
Hissowal 3 3.7 ± 0.12 4.4 ± 0.20 5.3 ± 0.14 20 5.3 ± 0.24 6.0 ± 0.21 6.9 ± 0.29 15
Mean 4.5 4.4 5.1 15 6.5 6.4 6.8 6
Table 22. Effect of rice straw management practices on grain and straw yields
of wheat in farmers’ fields in Ludhiana district, India, in 2005–06
Sidhu et al., 2007
Incorporated (sown with normal seed drill after three cultivations and planking) ; Stubble removed (sown with
strip-till Happy Seeder after removing straw) ; Stubble retained as mulch (sown with strip-till Happy Seeder into
rice residues) ; % change (increase in yield of mulched treatment over stubble removed treatment)
Location
Average weed count per sq m
Happy seeder Conventional % Reduction
Baraunga Zer 25.9 59.2 47.4
Meerpur Sodhian 24.0 35.6 32.6
Meerpur Sodhian 31.2 31.6 1.3
Kotla Bajwara 17.6 27.4 35.8
Mohanmajra 27.8 46.4 40.1
Luharmajra 32.3 50.4 35.9
Saidpura 16.8 17.0 1.2
Fatehpur Raiyan 21.2 26.0 18.5
Sadhugarh 28.6 47.0 39.1
Average 25.04 37.84 27.99
Conventional –burning paddy residues + 2 disking + 2 cultivator + 2 planker + seed drill + planker
Table 23. Weed Count analysis in wheat sowing with Happy seeder and
conventional method
Singh et al., 2013
Punjab
Location Variety
Grain yield (q./ha)
Happy seeder Conventional % Increase in yield
Baraunga Zer PBW 550 46.50 42.25 10.06
Meerpur Sodhian PBW 502 56.25 50.75 10.84
Meerpur Sodhian HD 2851 41.00 39.00 5.13
Kotla Bajwara PBW 343 35.00 31.75 10.24
Mohanmajra PBW 343 41.50 38.75 7.10
Luharmajra PBW 550 45.25 41.75 8.38
Saidpura HD 2733 41.25 37.50 10.00
Fatehpur Raiyan DBW 17 52.00 48.75 6.67
Sadhugarh PBW 550 50.00 45.00 11.11
Average 45.42 41.72 8.84
Conventional –burning paddy residues + 2 disking + 2cultivator + 2 planker + seed drill + planker
Table 24 . Comparison of experiment conducted on wheat sowing with Happy
seeder and conventional method
Singh et al., 2013
Punjab
Economics of HS
Method of sowing
Happy seeder Conventional
Cost of field preparation based on Custom
Hiring charges (Rs. per ha)
2125 6250
Weedicide charges
(Rs. per ha) 350 1450
Rodenticide
(Rs. per ha) 90 -
Total
(Rs. per ha) 2565 7700
Net saving
(Rs. per ha) 5135
Table 25. Economics of HS with conventional sowing
Singh et al., 2013
Punjab
parameters Rotoslasher + Disc
plough
Rotoslasher +
Rotovator
Disc plough + Rotovator F.P
DAI Initial 30 Initial 30 Initial 30 Initial 30
pH 8.8 8.6 8.8 8.7 8.8 8.6 8.8 8.9
EC (dsm-1) 0.32 0.45 0.36 0.37 0.32 0.49 0.32 0.49
N (kg/ha) 68 91 71 88 71 76 74 74
P (kg/ha) 4.4 5.6 4.4 5.0 4.2 5.0 4.2 4.6
K (kg/ha) 275 420 270 332.5 273 320 268 255
Fe (ppm) 6.26 6.76 6.26 6.48 6.48 6.52 6.48 5.86
Zn (ppm) 1.32 1.80 1.30 1.72 1.32 1.78 1.28 1.20
Mn (ppm) 5.86 6.36 5.82 6.10 5.76 6.24 5.52 5.32
Cu (ppm) 2.14 2.32 2.14 2.32 2.20 2.28 2.20 2.12
Table 26. Incorporation of post harvest cotton stalks on soil fertility changes
in cowpea crop
Somasundaram et al., 2007
Farmer's practice: removal of cotton stalks followed by disc ploughing and ploughing with cultivator once
Tamilnadu
Treatments Pod yield (t/ha) Haulm yield (t/ha)
Rotoslasher followed by disc plough 1.04 5.52
Rotoslasher followed by rotovator 0.91 5.05
Disc plough followed by rotovator 1.00 5.22
Farmer's practice 0.85 4.54
CD (p= 0.05) 0.07 0.29
Table 27. In-Situ Incorporation of Post-Harvest Cotton Stalks on yield of
cowpea
Somasundaram et al., 2007
Tamilnadu
Farmer's practice: removal of cotton stalks followed by disc ploughing and ploughing with cultivator once
ROTARY SLASHER
COTTON SHREDDER
Table 28. Effect of wheat residues incorporation through rotovator on
growth and yield of Soyabean
Bharghav et al., 2016
Treatments Plant height
(cm)
Pods / Plant
(No)
Grain yield
(q/ha)
Straw yield
(q/ha)
2008 2009 2008 2009 2008 2009 2008 2009
CRB 44.7 45.3 30.49 29.39 14.22 13.82 21.37 21.41
CRMR 54.8 54.8 38.81 40.47 18.26 19.2 29 28.99
% change 22.60 20.97 27.29 37.70 28.41 38.93 35.70 35.40
CRB (Crop residue burning), CRMR (in-situ mixing of wheat crop residue by rotovator)
Gwalior
Incorporation of wheat residue by Rotavator
Wheat crop residue mixing in the filed by Rotavator
Wheat crop residue burned in the field
Treatments
2014-2015 2015-2016
Grain yield
(kg/ha)
Straw yield
(kg/ha)
Grain yield
(kg/ha)
Straw yield
(kg/ha)
T1
Incorporation of straw as such
with tractor mounted with half
cage wheel and rotovator 6842 8542 7047 8542
T2
T1 + 25 kg N/ha
7382 9038 7603 9038
T3
T1 + biomineralizer
7706 9982 7937 9982
T4
Control (no residues)
5238 7642 5395 7642
CD (p=0.05)
726 1455 765 1455
Table 29. Influence of residue management practices on yield of rice
Natarajan et al., 2017
Tamilnadu
Treatments
Crop establishment parameters
Effective tiller
count/ m-length
Length of ear head
(mm)
No. of grains/head Test wt (g)
Happy seeder 50.52 96.70 56.10 41.45
Spatially modified no
till drill
52.69 97.15 57.62 42.24
Roto till drill 50.27 96.50 56.05 40.05
Table 30. Evaluation of wheat sowing technologies under paddy
residue conditions
Singh, 2015
Punjab
Treatments
Grain yield (kg/ha)
R1 R2 R3 Mean SD
Happy seeder 5215.4 5285.3 5262.5 5254.4 29.11
Spatially modified no
till drill
5383.1 5392.7 5411.8 5395.9 11.93
Roto till drill 5147.3 5157.3 5173.6 5159.4 10.84
Table 31. Evaluation of wheat sowing technologies under paddy
residue conditions
Singh, 2015
Punjab
Implications
• Difficulties in sowing and application of fertilizer, pesticides and
problem of pest infestation
• Requires more attention on timings and placement of nutrients,
pesticides and irrigation
• Weed control is the major bottleneck in the rice-wheat system
• Excessive use of chemical herbicides creates unhealthy environment
• Nutrient management becomes complex because of higher residues
levels
• Loss in basal application of N fertilizers at the time of seeding and
hence less efficiency and environmental pollution
Implications
• Specialized equipments are required for fertilizer placement which
contributes high costs
• For adoption of conservation agriculture higher amount of
herbicides are used which creates problems of pollution and
environment hazards
• Requires management skills
• Apprehensive of lower crop yields and /or economic returns
• Negative attitudes or perceptions, and institutional constraints
• Farmers have strong preferences for clean and good looking fields
as against untilled shabby looking fields
Conclusion
• In next decade, more food would be produced from limited land by
making efficient use of natural resources with minimal impact on
the environment.
• Improved machinery and practices has been found very effective in
managing crop residues thus reducing GHG emissions.
• Incorporation of residues with Micro-organisms for fast
decomposition.
• Residue retention on the surface of soil reduces weed growth and
protects soil from erosion.
THANK YOU

Crop Residue Management, Smart Mechanization and Its Implications in Tropical Countries

  • 1.
    CROP RESIDUE MANAGEMENT,SMART MECHANIZATION AND THEIR IMPLICATIONS IN TROPICAL COUNTRIES Presented by- K.KIRAN KUMAR REDDY RAD/17-02 Dept. of Agronomy CREDIT SEMINAR on
  • 2.
    CONTENTS • Introduction • Availabilityof crop residues • Crop residue management • Smart mechanization • Implications • Conclusion
  • 3.
    Introduction • Crop residueis defined as a vegetative crop material left on the field after a crop is harvested, pruned or processed. • The Removal of crop residues leads to low soil fertility and there by decreasing crop production. • The straw of most cereal crop contains about 35, 10 and 80% of the total N, P and K taken up by the crop. (Barnard and Kristoferson,1985)
  • 4.
    Table1: Residue production(x 103 t) by rice and different crops grown in rotation with rice in the tropics in 1998 Crops Asia Africa S.America World R-straw 771804 25968 24153 844782 R-husk 154361 5194 4831 168956 Wheat 379788 27395 25539 946734 Barley 34097 6753 2141 208229 Sugarcane 53855 8561 41880 125227 Cotton 6378 315 69 6801 Oats 2424 342 1604 51604 Corn 166205 38729 54626 604031 Table 1. Global Availability of Crop Residue FAO (1998)
  • 5.
    Asia Africa andSouth America World Crops N P K N P K N P K R-straw 4862.4 771.8 4600.0 327.8 52.5 446.1 5345.6 849.56 5321.7 R-husk 1898.9 265.9 2354.7 308.1 37.1 417.6 5650.9 662.7 7758.2 Wheat 221.6 30.7 235.3 59.9 8.4 73.4 1520.9 220.9 2374.1 Barley 226.2 43.1 360.8 211.9 40.4 338.0 526.0 100.2 839.0 Sugarcan e 64.4 9.6 63.8 4.4 0.6 4.2 69.5 10.3 68.5 Cotton 15.3 3.9 40.0 12.3 3.1 32.1 325.1 82.6 851.5 Oats 781.2 216.1 1229.9 788.4 148.7 1013.1 5393.0 984.8 6824.3 Table 2. Estimates of N, P, and K (103 t) in Residue Produced by Divergent Crops Grown in Rotation with Rice in the Tropics in 1998 Estimates of N, P, and K in crop residues were computed by multiplying residue yield data given in Table I with N, P, and K contents in straw reported by Larson et al. (1978) for South America and by Bhardwaj (1995) and Beri and Sidhu (1996) for Asia and Africa.
  • 6.
    Generation of cropresidues in India • The Ministry of New and Renewable Energy (MNRE, 2009), Govt. of India has estimated that about 500 Mt of crop residues are generated every year. • There is a wide variability in the generation of crop residues and their use across different regions of the country depending on the crops grown, cropping intensity and productivity of these crops. • The generation of crop residues is highest in Uttar Pradesh (60 Mt) followed by Punjab (51 Mt) and Maharashtra (46 Mt). • Among different crops, cereals generate maximum residues (352 Mt), followed by fibres (66 Mt), oilseeds (29 Mt), pulses (13 Mt) and sugarcane (12 Mt). • The cereal crops (rice, wheat, maize, millets) contribute 70% while rice crop alone contributes 34% to the crop residues. • Wheat ranks second with 22% of the crop residues whereas fibre crops contribute 13% to the crop residues generated from all crops.
  • 7.
    The share ofunutilized residues in total residues generated by different crops in India (calculated from MNRE, 2009) Residue generation by different crops in India (Calculated from MNRE,2009)
  • 8.
    Table 3. Cropwise residue generated in various states of India MNRE ,2014
  • 9.
    Crop residue (CR)uses (%) Cereals Legumes Table 4. crop residues use by purpose and type MNRE, 2014
  • 10.
  • 11.
    Residues management Practices: 1).Burning 2). Removal 3). Incorporation 4). Retention
  • 12.
    1. Residue burning Advantages: •It facilitates timely planting of next crop • It clears the land quickly • It kills soil borne pests and prevents diseases Disadvantages: • Loss of nutrients • Causes air pollution • Kills beneficial soil micro organisms • Loss of soil organic matter • Burning of trees • Produces Ash Indian journal of air pollution control, 8(1): 61-67, 2008
  • 13.
    Farmer burning paddyresidue on the outskirts of Patiala
  • 14.
    Why do farmersburn crop residues in field..?? • The combined use of residues as animal fodder, fuel, paper and cardboard industries does not exceed 10% • The farmers are in a hurry to sow the next crop (wheat) and therefore dispose off the straw immediately by burning • The machinery for direct incorporation and collection has been developed but still in its infancy and that is not available to the farmers • Even with use of the latest machines like chopper and rotovator, direct incorporation involves higher cost than normal operations. • Sowing of wheat by no-till drill is the cheapest option but can not be practiced without burning/removing the rice residue. • Combine harvesters spreads the residues in the field, which is difficult to collect.
  • 15.
    View of residueburning in India
  • 16.
    Presence of ashaffect herbicide efficacy Effect of ash on herbicide efficacy
  • 17.
    Table 5. Effectsof sugarcane residue and green manure practices in sugarcane-ratoon-wheat sequence Chandra et al., 2008 Treatments Ratoon cane Wheat Cane yield (t/ha) CCS (t/ha) Grain yield (t/ha) Straw yield (t/ha) Trash removal 104.9 11.8 3.74 5.43 Trash burning 134.2 15.0 3.60 5.22 Trash incorporation 120.7 13.6 3.82 5.50 Trash incorporation + cellulolytic culture (CC) 128.2 13.8 3.93 5.66 Trash incorporation + 25% Extra N 134.9 14.3 3.80 5.48 Trash incorporation + CC +25% Extra N 137.9 14.2 4.02 5.79 Trash removal + GM mulch 144.5 16.3 3.93 5.62 Trash burning + GM mulch 150.0 16.7 4.18 5.94 Trash removal + GM incorporation 145.7 15.4 4.22 6.10 Trash burning + GM incorporation 158.0 16.4 4.30 6.25 CD (p = 0.05) 7.6 1.8 0.20 0.31 Pantnagar
  • 18.
    2. Removal andits use : Crop residues as live stock feed and shelter Crop residues as compost Crop residues as mushroom cultivation Crop residues as bio-fuel Crop residues as biochar Crop residues for producing energy
  • 19.
    A view oftransport and storage of bhusa as well as baled straw
  • 20.
  • 21.
    DAP Planting inrice straw bales Planting in natural soil (control) Percentage of occurrence Percentage of occurrence % re- growth Damping- off wilted plants root knot nematode % re - growth Damping -off wilted plants root knot nematode Root Rot Crown rot Root rot Crown rot 15 96.0 4.0 0.0 0.0 0.0 73.0 27.0 0.25 0.10 0.30 30 0.0 0.0 0.0 0.0 0.0 0.0 0.0 0.50 0.50 0.80 45 0.0 0.0 0.0 0.0 0.0 0.0 0.0 1.45 1.30 1.40 60 0.0 0.0 0.15 0.10 0.0 0.0 0.0 1.20 2.70 1.50 75 0.0 0.0 0.10 0.15 0.0 0.0 0.0 2.50 0.80 1.95 90 0.0 0.0 0.10 0.0 0.0 0.0 0.0 2.15 1.20 0.90 105 0.0 0.0 0.25 0.0 0.0 0.0 0.0 3.20 2.40 1.50 120 0.0 0.0 0.10 0.10 0.0 0.0 0.0 2.40 2.70 2.10 135 0.0 0.0 0.15 0.0 0.0 0.0 0.0 2.50 0.0 2.75 Total 96.0 4.0 0.85 0.35 0.0 72.5 27.5 16.15 11.70 13.20 Table 6. OCCURRENCE OF SOILBORNE DISEASES AND ROOT KNOT NEMATODES IN STRAWBERRY PLANTS GROWN ON COMPACTED RICE STRAW BALES COMPARED WITH NATURALLY INFESTED SOILS Anwar et al., 2008 Egypt
  • 22.
    Crop residues aslive stock feed and shelter  50% is directly used for the animal feed  Used as thatching material  Used for bedding material  Conserved as hay and use it in lean period  In Construction of Animal shed International Journal of Chemical Studies. 5(4): 1038-1042, 2017.
  • 23.
    Straw used ascattle feed and making shelter
  • 24.
    Crop residues ascompost • For preparing compost, crop residues are used as animal bedding and then heaped in dung pits. • In the animal shed each kilogram of straw absorbs about 2-3 kg of urine, which enriches it with N. • The residues of rice crop from one hectare land, on composting give about 3 tons of manure as rich in nutrients as farmyard manure (FYM). • The rice straw compost can be fortified with P using indigenous source of low grade rock phosphate to make it value added compost with 1.5 % N, 2.3 % P2O5 and 2.5 % K2O5 . International Journal of Chemical Studies. 5(4): 1038-1042, 2017.
  • 25.
    Preparation of improvedquality compost from crop residues (Courtesy: S.D. Mishra, IARI, New Delhi)
  • 26.
    Crop residues asmushroom cultivation • Wheat and rice straws are excellent substrates for the cultivation of mushrooms International Journal of Chemical Studies. 5(4): 1038-1042, 2017.
  • 27.
    Crop residues asbiochar • Biochar is a fine-grained charcoal having high carbon material produced through slow pyrolysis (heating in the absence of oxygen) of biomass. • It can potentially play a major role in the long-term storage of carbon in soil. • Biochar converted from plant biomass contains a unique recalcitrant form of carbon that is resistant to microbial degradation, therefore can be used as a carbon sequester, when applied to soil . • In addition, biochar has been shown to reduce greenhouse gas (GHG) from agricultural fields and also improve water quality through its strong absorption nature of contaminants International Journal of Chemical Studies. 5(4): 1038-1042, 2017.
  • 29.
    Study Feedstock Pyrolysistemperature pH C N O CEC Hale et al., (2013) Corn cob 350 8.97 66 0.6 - 34 Liu X et al., (2014) Corn cob 300 8.1 67.21 0.67 27.63 - Corn stalk 500 10.1 77.34 2.79 17.23 - Lee et al., (2013) Paddy straw 500 10.5 86.28 3.25 7.35 - Zhao et al., (2013) Peanut shell 500 10.5 73.7 - - 44.5 Ahmad et al., (2012) Soyabean stover 300 7.27 68.81 1.88 24.99 - Zhao et al., (2013) Wheat straw 500 10.2 62.9 - - 95.5 Table 7. Properties of biochars as affected by feed stocks and pyrolysis temperature
  • 30.
    Possible benefits frombiochar application for fertilizer use efficiency and bioremediation of pesticide-polluted soils.
  • 31.
    Low-cost pyrolysis klinfor preparation of biochar
  • 32.
    Treatments Grain yield (kgha-1) Stover yield (kg ha-1) N uptake (kg ha-1) P uptake (kg ha-1) K uptake (kg ha-1) Biochar @ 5 t ha-1 1352 1922 24.87 5.86 19.34 Biochar @ 10 t ha-1 1408 2042 28.71 6.29 22.12 Biochar @ 15 t ha-1 1496 2214 29.73 7.46 23.39 NPK alone 6106 7450 107.59 19.94 76.18 NPK + Biochar @ 5 t ha-1 6152 7504 120.02 20.61 78.42 NPK + Biochar @ 10 t ha-1 6300 7812 123.08 21.96 82.20 NPK + Biochar @ 15 t ha-1 6324 7906 130.09 22.08 88.70 NPK + FYM @ 12.5 t ha-1 + Azospirillum @ 2 kg ha-1 6824 8530 134.68 24.8 90.06 NPK + FYM @ 12.5 t ha-1 + Biochar @ 5 t ha1 + Azospirillum @ 2 kg ha-1 7336 8878 138.88 26.24 94.18 NPK + FYM @ 12.5 t ha-1 +Biochar @ 10 t ha-1 + Azospirillum @ 2 kg ha-1 7874 9170 154.63 33.34 105.18 NPK + FYM @ 12.5 t ha-1 + Biochar @15 t ha-1 + Azospirillum @ 2 kg ha-1 7996 9436 160.28 34.02 109.74 Absolute Control 1330 1910 23.34 4.28 18.88 CD (0.05) 297 359 8.82 2.86 6.61 Table 8. Effect of biochar on yield and nutrient uptake by hybrid maize Coumaravel et al., 2015 Tamilnadu
  • 33.
    Treatments Available N (kg/ha) AvailableP (kg/ha) Available K (kg/ha) Organic carbon (g/kg) Biochar @ 5 t ha-1 185 21.1 543 4.82 Biochar @ 10 t ha-1 189 22.8 555 4.89 Biochar @ 15 t ha-1 192 23.6 569 4.91 NPK alone 198 25.5 593 5.12 NPK + Biochar @ 5 t ha-1 203 26.5 603 5.21 NPK + Biochar @ 10 t ha-1 205 29.0 609 5.25 NPK + Biochar @ 15 t ha-1 207 30.1 615 5.31 NPK + FYM @ 12.5 t ha-1 + Azospirillum @ 2 kg ha-1 209 31.7 623 5.40 NPK + FYM @ 12.5 t ha-1 + Biochar @ 5 t ha1 + Azospirillum @ 2 kg ha-1 210 32.2 626 5.51 NPK + FYM @ 12.5 t ha-1 +Biochar @ 10 t ha-1 + Azospirillum @ 2 kg ha-1 215 32.6 629 5.71 NPK + FYM @ 12.5 t ha-1 + Biochar @15 t ha-1 + Azospirillum @ 2 kg ha-1 217 33.3 634 5.91 Absolute Control 175 19.7 530 3.22 CD (0.05) 9 1.7 15 0.05 Table 9. Effect of biochar application on soil available NPK and Organic carbon status Coumaravel et al., 2015 Tamilnadu
  • 34.
    Crop residues forproducing energy • Kalpataru Power Transmission Limited (KPTL), a leading global engineering, procurement and construction player in power sector, is successfully generating energy from crop residues in Ganganagar and Tonk districts of Rajasthan for the past several years. • At Tonk, the plant utilizes 80,000 tons of biomass, mostly from mustard crop, annually and generates 1.5 lakh kWh energy per day
  • 35.
    Thermal plant ofKalpataru Power Transmission Limited producing energy from crop residues at Tonk, Rajasthan.
  • 36.
    3. Residue incorporation •Increases soil organic matter and N, P and K contents in soil. • Beneficial in recycling nutrients • But leads to temporary immobilization of nutrients (e.g., Nitrogen) • Extra nitrogenous fertilizer needs to be added to correct the high C:N ratio at the time of residue incorporation International Journal of Chemical Studies. 5(4): 1038-1042, 2017.
  • 37.
    Table 10. Effectof residue incorporation on microbial population in soil after completion of two cycles of Rice-based cropping systems Davari et al., 2012 Bacteria Fungi Actinomycetes (cells × 10-4 g-1 soil) (cells × 10-4 g-1 soil) (cells × 10-4 g-1 soil) Cropping system RR RI Mean RR RI Mean RR RI Mean RW 4.8 6.5 5.7 2.3 2.6 2.5 9.2 19.2 14.2 RWM 5.7 7 1 6.4 2.9 4.4 3.7 12.4 21.6 17.0 Mean 5.3 6.8 - 2.6 3.5 - 10.8 20.4 - LSD ( p = 0.05) Cropping system (CS) 0.6 0.8 2.1 Residue (R) 0.5 0.1 1.7 CS × R 0.8 1.0 2.5 RW – RICE-WHEAT ; RWM – RICE-WHEAT-MUNG IARI
  • 38.
    Table 11. Effectof residue incorporation on CO2 evolution after completion of two cycles of rice-based cropping systems Davari et al., 2012 CROPPING SYSTEM CO2 EVOLUTION (µg g-1 soil 24 h-1) RESIDUE REMOVED RESIDUE INCORPORATED MEAN RICE-WHEAT 547.1 568.8 558.0 RICE-WHEAT-MUNGBEAN 561.3 585.9 573.6 MEAN 554.2 577.4 LSD ( P =0.05) CROPPING SYSTEM (CS) 9.6 RESIDUE (R) 7.8 CS × R NS IARI
  • 39.
    Table 12. Effectof different tillage implements and incorporation of rice stubbles as residue on yield of wheat in saline-sodic soil Sadiq et al., 2002 Cultivator Disc plough Chisel Plough Rotovator mean Grain yield (t ha-1) Rice residues incorporated in to soil 3.457 3.361 3.500 3.720 3.509 A Rice stubbles removed from the soil before sowing of wheat crop 3.150 3.200 3.130 3.098 3.144 B Mean 3.303NS 3.281 3.315 3.409 LSD for stubbles – 0.294 Pakistan
  • 40.
    TREATMENT EXPERIMENT 1 (1996-2001) EXPERIMENT2 (1996-2003) WHEAT RICE WHEAT RICE STRAW REMOVED 5.06 a 4.70 a 4.01 a 5.19 a STRAW BURNT 5.11 a 5.13 a 5.10 a 6.25 a STRAW INCORPORATED (40DBS) 6.89 a 5.87 a 5.8 a 6.34 a STRAW INCORPORATED (20DBS) 5.00 a 4.97 a 5.22 a 6.29 a STRAW INCORPORATED (20DBS) AND 25% N APPLIED AT INCORPORATION 4.79 a 5.02 a 4.95 a 6.33 a STRAW INCORPORATED (10DBS) - - 4.97 a 6.29 a Table 13. Yield (t ha-1) As affected by rice straw management in wheat and its residual effect on rice in the rice –wheat cropping system Sidhu and Beri, 2008 Punjab
  • 41.
    Treatments Length ofgrain (cm) Test weight (g) Grain yield (q/ha) Straw yield (q/ha) Control 1.01 32.3 18.8 27.3 SB 1.05 32.6 19.9 27.9 SI 1.08 33.2 19.9 30.7 SI + 25% N 1.15 35.4 22 34.8 SI + GM 1.17 36.7 24.5 39.3 SI + MICROBIAL 1.1 34.2 21 32.1 C. D. (P = 0.05) 0.02 0.49 0.22 0.55 Table 14. Effect of crop residues on yield and yield attributing characters of wheat at 120 DAS Dhar et al., 2014 Allahabad
  • 42.
    Table 15. Effectof trash incorporation on cane and Commercial Cane Sugar yield (t/ha ) Jadhav, 2003 Treatment 2000-2001 2001-2002 % increases over control CCS (t ha-1) Yield CCS Yield CCS Yield (t ha-1) Chopped trash @ 2.5 t ha-1 132 15.2 139 14.5 3.43 0.20 Chopped trash @ 5.0 t ha-1 137 17.3 144 16.5 6.68 14.4 Chopped trash @ 7.5 t ha-1 140 18.5 147 17.7 9.10 22.2 Unhopped trash @ 2.5 t ha-1 131 15.2 138 14.5 2.37 1.12 Unchopped trash @ 5.0 t ha-1 135 16.0 142 15.3 5.57 8.14 Unchopped trash @ 7.5 t/ha 139 17.3 146 16.6 8.08 14.57 FYM @ 5.0 t ha-1 136 15.3 143 14.6 6.51 1.85 No trash (control) 128 15.0 134 14.4 - - LSD @ 5% 3.18 1.85 5.90 1.2 - - Pune
  • 43.
    Parameter Initial status (Depth10-20 cm) Retained Incorporation Removed Burnt pH 7.83 7.95 7.35 7.40 7.65 Water stable aggregates >250 μm 51.9 57.4 56.9 46.3 38.2 Organic carbon (%) 0.46 0.53 0.58 0.43 0.47 Available N (kg/ha) 64.6 89.0 83.0 32.0 21.0 Available P (kg/ha) 25.8 39.0 42.0 21.0 29.0 Available K (kg/ha) 52.1 67.0 69.0 48.0 55.0 Table 16. Effect of crop residues management in rice wheat rotation (3 years) on physicochemical properties of soil Naresh, 2013 Meerut
  • 44.
    Treatments Wet season2000 Dry season 2000 Grain yield (kg ha-1) Straw yield (kg ha-1) Grain yield (kg ha-1) Straw yield (kg ha-1) T1- 100% Straw incorporation 3698 ab 5300 b 7306 a 5525 T2- 50% straw incorporation 3389 c 5290 b 6587 b 5275 T3- 100% straw + Green Manure 3988 a 5985 a 7597 a 5925 T4- 100% straw burning 3512 b 5900 a 6206 b 5925 T5- removal of straw 3181 c 4725 c 6334 b 5325 Table 17. Influence of crop residue treatments on grain and straw yield of rice Surekha et al, 2003 IIRR
  • 45.
    4. Residue retention •Residue retention on the surface of soil seems to be a better option for conservation of soil and avoiding water losses by evaporation. • It also reduces the weed seed germination and helps in building of soil microbial populations results in increasing soil organic carbon-a direct indicator of soil health.
  • 46.
    Dry weight ofweeds, as affected by soil tillage systems and levels of surface cover (SC)
  • 47.
    Correlation between surfacecover and weed dry mass reduction
  • 48.
    Tillage and residue management WATERCONTENT (cm3 cm-3) SOIL DEPTH (0-15 cm ) SOIL DEPTH (15-30 cm ) SOIL –WATER SUCTION (K Pa) SOIL –WATER SUCTION (K Pa) 0 33 500 1500 0 33 500 1500 T1: CT+ 1/3 RI 0.40 0.28 0.14 0.11 0.43 0.31 0.16 0.13 T2 :TFP+ FRR 0.39 0.29 0.14 0.10 0.44 0.32 0.16 0.12 T3 : ZT+ 1/3 RR 0.41 0.33 0.17 0.13 0.47 0.35 0.19 0.16 T4: ZTT + FRA 0.57 0.38 0.16 0.14 0.63 0.43 0.19 0.17 Table 18. Effect of tillage and residue management treatments on soil volume water content at various soil – water suction points Choudari et al., 2015 CT- conventional tillage. RI- Residue incorporation. TFP- tillage as per farmers practice. FRR- Full residue removal. ZT- zero tillage. RR- residue retention. ZTT- Zero tillage with turbo machine. FRA- Full residue anchored/Retention Haryana
  • 49.
    TREATMENT 60 DAS SMC75 DAS SMC 0-0.2 m 0.21-0.4 m 0.4-0.6 m 0-0.2 m 0.21-0.4 m 0.4-0.6 m SESAME 22.2 23.5 24.6 34.3 33.4 35.2 SORGHUM 21.2 22.6 23.4 36.6 26.2 28.5 RICE 21.1 21.9 22.7 37.9 29.0 30.4 SUDAN GRASS 19.5 22.1 23.6 37.6 31.4 28.6 CONTROL 17.9 19.3 22.1 23.6 21.4 23.5 LSD0.05 1.1 1.8 1.9 2.7 1.6 1.483 Table 19. Effect of mulching on soil moisture content at different soil depth and days after sowing Teame et al., 2017 Ethopia
  • 50.
    MULCH DF DMPH NCP NSPC TSW GY(kg/ha) Sudan grass 40.0 92.9 83.0 37.5 40.0 3.8 664.0 Sesame straw 40.0 93.9 85.0 35.4 43.0 3.5 525 Sorghum straw 41.0 92.4 79.0 36.3 45.0 3.4 520 Rice straw 41.0 92.2 74.0 26.3 39.0 3.2 470 Control 38.0 90.4 54.0 22.8 34.0 3.2 190 LSD 0.05 2.7 1.1 1.6 6.3 2.4 0.2 35.3 Table 20. Effect of organic mulching on phenology, yield and yield components of sesame Teame et al., 2017 DF = days to 50% flowering, DM = days to 90% maturity, PH = plant height (cm), BR = number of branches per plant, NCP = number of capsules per plant, NSPC = number of seeds per capsule, TSW = thousand-seed weight (g), and GY = grain yield. Ethopia
  • 51.
    Residue rate (kg/ha) N (kg/ha)Grain yield (kg/ha) Biological yield (kg/ha) Harvest index (%) 0 0 264 853 26.48 35 581 1901 25.61 70 678 2162 26.73 500 0 907 2783 32.33 35 1514 3169 37.95 70 1134 3123 33.01 1000 0 851 1555 33.82 35 1089 2465 38.08 70 1569 4666 41.68 Table 21. Effect of crop residue and nitrogen rates on yield components of wheat Sadeghi and Bahrani (2009) Iran
  • 52.
  • 53.
    A view ofstraw chopper, hay rake and straw baler
  • 54.
    Straw baler • Itcuts the straw from combine harvested fields and makes bundles. • Straw burning causes environmental pollution
  • 55.
    Straw reaper/combine • Itcuts the standing straw left in the field after combining and throw it in a trolley at the rear. • 1000 kg of straw/ha & 40-50 kg/ha grain can be recovered.
  • 56.
    Spreading of loosepaddy straw with stubble shaver
  • 57.
    HAPPY SEEDER • Simultaneouslycuts the standing straw, plants wheat and throw the straw on the planted seeds The 4th Regional Forum on Sustainable Agricultural Mechanization in Asia and the Pacific
  • 58.
    Sowing of wheatwith spatially modified no till Drill
  • 59.
    Rotary disc notill drill • Rotary disc cuts the residue and make a slit for sowing of seed. • The machine is use for direct sowing of paddy over wheat straw under dry condition. Role of Machinery for crop residue management
  • 60.
    Village Grain yield (t/ha)Straw yield (t/ha) I R M % Change I R M % Change Dhatt 1 4.5 ± 0.21 4.3 ± 0.09 5.2 ± 0.18 24 6.6 ± 0.25 6.5 ± 0.19 6.9 ± 0.24 6 Dhatt 2 5.1 ± 0.23 4.5 ± 0.11 4.9 ± 0.12 8 7.2 ± 0.27 6.3 ± 0.20 6.6 ± 0.17 6 Hissowal 1 5.1 ±0.23 4.5 ± 0.19 5.0 ± 0.16 10 6.8 ± 0.30 6.5 ± 0.41 6.7 ± 0.22 3 Hissowal 2 4.3 ± 0.17 4.6 ± 0.21 5.1 ± 0.13 12 6.9 ± 0.33 6.7 ± 0.24 6.8 ± 0.15 2 Hissowal 3 3.7 ± 0.12 4.4 ± 0.20 5.3 ± 0.14 20 5.3 ± 0.24 6.0 ± 0.21 6.9 ± 0.29 15 Mean 4.5 4.4 5.1 15 6.5 6.4 6.8 6 Table 22. Effect of rice straw management practices on grain and straw yields of wheat in farmers’ fields in Ludhiana district, India, in 2005–06 Sidhu et al., 2007 Incorporated (sown with normal seed drill after three cultivations and planking) ; Stubble removed (sown with strip-till Happy Seeder after removing straw) ; Stubble retained as mulch (sown with strip-till Happy Seeder into rice residues) ; % change (increase in yield of mulched treatment over stubble removed treatment)
  • 61.
    Location Average weed countper sq m Happy seeder Conventional % Reduction Baraunga Zer 25.9 59.2 47.4 Meerpur Sodhian 24.0 35.6 32.6 Meerpur Sodhian 31.2 31.6 1.3 Kotla Bajwara 17.6 27.4 35.8 Mohanmajra 27.8 46.4 40.1 Luharmajra 32.3 50.4 35.9 Saidpura 16.8 17.0 1.2 Fatehpur Raiyan 21.2 26.0 18.5 Sadhugarh 28.6 47.0 39.1 Average 25.04 37.84 27.99 Conventional –burning paddy residues + 2 disking + 2 cultivator + 2 planker + seed drill + planker Table 23. Weed Count analysis in wheat sowing with Happy seeder and conventional method Singh et al., 2013 Punjab
  • 62.
    Location Variety Grain yield(q./ha) Happy seeder Conventional % Increase in yield Baraunga Zer PBW 550 46.50 42.25 10.06 Meerpur Sodhian PBW 502 56.25 50.75 10.84 Meerpur Sodhian HD 2851 41.00 39.00 5.13 Kotla Bajwara PBW 343 35.00 31.75 10.24 Mohanmajra PBW 343 41.50 38.75 7.10 Luharmajra PBW 550 45.25 41.75 8.38 Saidpura HD 2733 41.25 37.50 10.00 Fatehpur Raiyan DBW 17 52.00 48.75 6.67 Sadhugarh PBW 550 50.00 45.00 11.11 Average 45.42 41.72 8.84 Conventional –burning paddy residues + 2 disking + 2cultivator + 2 planker + seed drill + planker Table 24 . Comparison of experiment conducted on wheat sowing with Happy seeder and conventional method Singh et al., 2013 Punjab
  • 63.
    Economics of HS Methodof sowing Happy seeder Conventional Cost of field preparation based on Custom Hiring charges (Rs. per ha) 2125 6250 Weedicide charges (Rs. per ha) 350 1450 Rodenticide (Rs. per ha) 90 - Total (Rs. per ha) 2565 7700 Net saving (Rs. per ha) 5135 Table 25. Economics of HS with conventional sowing Singh et al., 2013 Punjab
  • 64.
    parameters Rotoslasher +Disc plough Rotoslasher + Rotovator Disc plough + Rotovator F.P DAI Initial 30 Initial 30 Initial 30 Initial 30 pH 8.8 8.6 8.8 8.7 8.8 8.6 8.8 8.9 EC (dsm-1) 0.32 0.45 0.36 0.37 0.32 0.49 0.32 0.49 N (kg/ha) 68 91 71 88 71 76 74 74 P (kg/ha) 4.4 5.6 4.4 5.0 4.2 5.0 4.2 4.6 K (kg/ha) 275 420 270 332.5 273 320 268 255 Fe (ppm) 6.26 6.76 6.26 6.48 6.48 6.52 6.48 5.86 Zn (ppm) 1.32 1.80 1.30 1.72 1.32 1.78 1.28 1.20 Mn (ppm) 5.86 6.36 5.82 6.10 5.76 6.24 5.52 5.32 Cu (ppm) 2.14 2.32 2.14 2.32 2.20 2.28 2.20 2.12 Table 26. Incorporation of post harvest cotton stalks on soil fertility changes in cowpea crop Somasundaram et al., 2007 Farmer's practice: removal of cotton stalks followed by disc ploughing and ploughing with cultivator once Tamilnadu
  • 65.
    Treatments Pod yield(t/ha) Haulm yield (t/ha) Rotoslasher followed by disc plough 1.04 5.52 Rotoslasher followed by rotovator 0.91 5.05 Disc plough followed by rotovator 1.00 5.22 Farmer's practice 0.85 4.54 CD (p= 0.05) 0.07 0.29 Table 27. In-Situ Incorporation of Post-Harvest Cotton Stalks on yield of cowpea Somasundaram et al., 2007 Tamilnadu Farmer's practice: removal of cotton stalks followed by disc ploughing and ploughing with cultivator once
  • 66.
  • 67.
  • 68.
    Table 28. Effectof wheat residues incorporation through rotovator on growth and yield of Soyabean Bharghav et al., 2016 Treatments Plant height (cm) Pods / Plant (No) Grain yield (q/ha) Straw yield (q/ha) 2008 2009 2008 2009 2008 2009 2008 2009 CRB 44.7 45.3 30.49 29.39 14.22 13.82 21.37 21.41 CRMR 54.8 54.8 38.81 40.47 18.26 19.2 29 28.99 % change 22.60 20.97 27.29 37.70 28.41 38.93 35.70 35.40 CRB (Crop residue burning), CRMR (in-situ mixing of wheat crop residue by rotovator) Gwalior
  • 69.
    Incorporation of wheatresidue by Rotavator Incorporation of wheat residue by Rotavator Wheat crop residue mixing in the filed by Rotavator Wheat crop residue burned in the field
  • 70.
    Treatments 2014-2015 2015-2016 Grain yield (kg/ha) Strawyield (kg/ha) Grain yield (kg/ha) Straw yield (kg/ha) T1 Incorporation of straw as such with tractor mounted with half cage wheel and rotovator 6842 8542 7047 8542 T2 T1 + 25 kg N/ha 7382 9038 7603 9038 T3 T1 + biomineralizer 7706 9982 7937 9982 T4 Control (no residues) 5238 7642 5395 7642 CD (p=0.05) 726 1455 765 1455 Table 29. Influence of residue management practices on yield of rice Natarajan et al., 2017 Tamilnadu
  • 71.
    Treatments Crop establishment parameters Effectivetiller count/ m-length Length of ear head (mm) No. of grains/head Test wt (g) Happy seeder 50.52 96.70 56.10 41.45 Spatially modified no till drill 52.69 97.15 57.62 42.24 Roto till drill 50.27 96.50 56.05 40.05 Table 30. Evaluation of wheat sowing technologies under paddy residue conditions Singh, 2015 Punjab
  • 72.
    Treatments Grain yield (kg/ha) R1R2 R3 Mean SD Happy seeder 5215.4 5285.3 5262.5 5254.4 29.11 Spatially modified no till drill 5383.1 5392.7 5411.8 5395.9 11.93 Roto till drill 5147.3 5157.3 5173.6 5159.4 10.84 Table 31. Evaluation of wheat sowing technologies under paddy residue conditions Singh, 2015 Punjab
  • 73.
    Implications • Difficulties insowing and application of fertilizer, pesticides and problem of pest infestation • Requires more attention on timings and placement of nutrients, pesticides and irrigation • Weed control is the major bottleneck in the rice-wheat system • Excessive use of chemical herbicides creates unhealthy environment • Nutrient management becomes complex because of higher residues levels • Loss in basal application of N fertilizers at the time of seeding and hence less efficiency and environmental pollution
  • 74.
    Implications • Specialized equipmentsare required for fertilizer placement which contributes high costs • For adoption of conservation agriculture higher amount of herbicides are used which creates problems of pollution and environment hazards • Requires management skills • Apprehensive of lower crop yields and /or economic returns • Negative attitudes or perceptions, and institutional constraints • Farmers have strong preferences for clean and good looking fields as against untilled shabby looking fields
  • 75.
    Conclusion • In nextdecade, more food would be produced from limited land by making efficient use of natural resources with minimal impact on the environment. • Improved machinery and practices has been found very effective in managing crop residues thus reducing GHG emissions. • Incorporation of residues with Micro-organisms for fast decomposition. • Residue retention on the surface of soil reduces weed growth and protects soil from erosion.
  • 76.