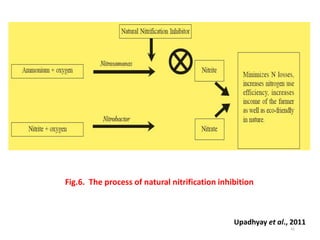
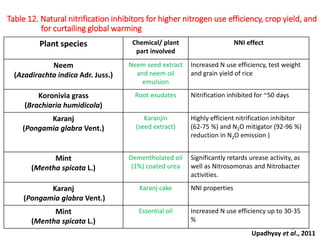
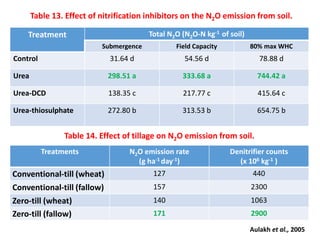
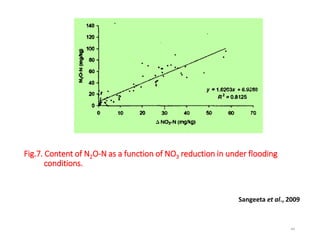
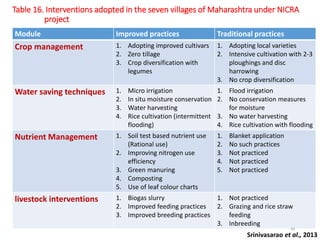
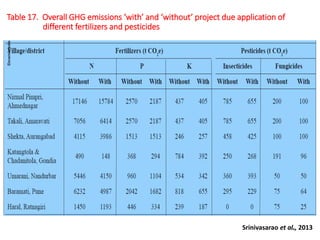
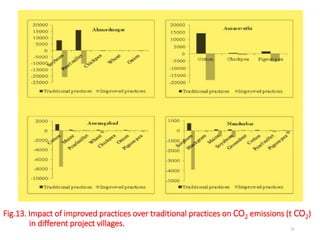
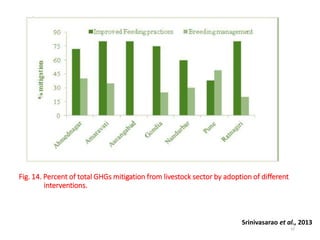
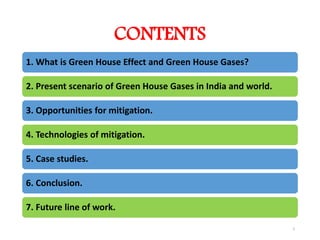
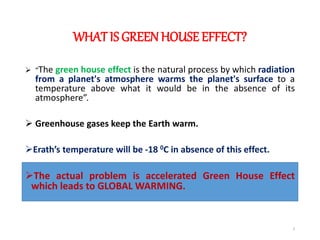
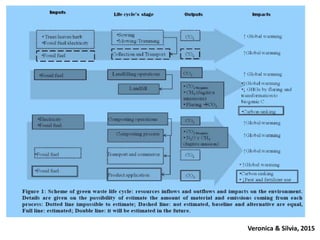
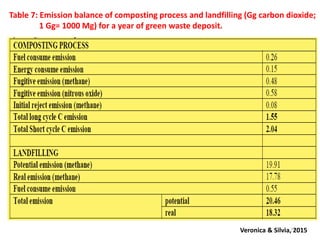
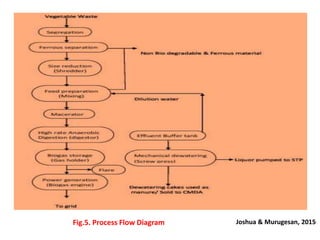
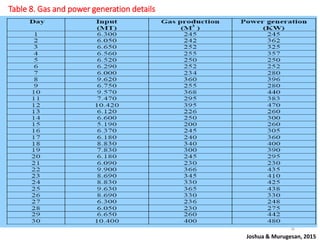
MECHANISMS CONTROLLING
GREEN HOUSE GAS EMISSIONS
Presented by:
Kumari Aditi
Dept. of Agronomy
Professor Jayashankar Telangana State Agricultural University
Department of SSAC, College Of Agriculture
Rajendranagar, Hyderabad-30
1
CONTENTS
1. What is Green House Effect and Green House Gases?
2. Present scenario of Green House Gases in India and world.
3. Opportunities for mitigation.
4. Technologies of mitigation.
5. Case studies.
6. Conclusion.
7. Future line of work.
2
WHAT IS GREENHOUSE EFFECT?
 “The green house effect is the natural process by which radiation
from a planet's atmosphere warms the planet's surface to a
temperature above what it would be in the absence of its
atmosphere”.
 Greenhouse gases keep the Earth warm.
Erath’s temperature will be -18 0C in absence of this effect.
The actual problem is accelerated Green House Effect
which leads to GLOBAL WARMING.
3
4
IPCC, 20135
REASONS FOR EMISSION OF GREEN
HOUSE GASES
CO2
Burning of fossil fuels.
Released largely from
microbial decay.
Burning of plant litter.
Soil organic matter
oxidation.
CH4
Decomposition of organic
materials in reduced
conditions.
Fermentative digestion by
ruminant livestock.
Stored manures.
Rice grown under flooded
conditions.
6
Contd…
N2O
Microbial transformation of
nitrogen in soils and
manures.
Enhanced where available
nitrogen (N) exceeds plant
requirements.
Under wet conditions.
CFC
7
Industrial production.
Consumer goods.
Refrigerants.
Foam blowing agents.
Solvents.
Fire retardants.
Aerosol can
propellants.
Global warming potential
Global warming potential is the measure of the ability of a gas to trap
thermal energy in the atmosphere for a specified period of time.
Methane and nitrous oxide are greenhouse gases (GHGs) that have a
global warming potential of the atmosphere 25 times and 298 times,
respectively, higher than carbon dioxide (IPCC, 2007).
GWP= (Carbon dioxide + methane × 25 + nitrous oxide × 298)
Carbon dioxide that has global warming potential is called long cycle
carbon dioxide.
Because of increasing emission of nitrous oxide, the total global
warming potential GWP of Indian agriculture per unit area (kg CO2 eq.
ha-1 is increasing.
8
IPCC, 2007
9
IPCC, 2014
Table 1. Atmospheric concentration, lifetime and global warming
potential (GWP) of major greenhouse gases
Pathak and Agrawal, 2013
11
Contribution of different sectors in GHG
emissions in India
41%
28%
24%
7% energy sector
agriculture
industry
others
12INCCA, 2013
Major sources of GHGs from agriculture
sector
62%
21%
13%
2%2%
Enteric Fermentation Rice Cultivation Agricultural soils
Manure management Burning of crop residues
13INCCA, 2013
Table 2. Present scenario of green house gases in India.
INCCA, 2013
Source CH4
(million ton)
N2O
(million ton)
CO2 eq.
(million ton)
Enteric fermentation 10.10 - 21.09
Manure management 0.12 - 2.44
Rice cultivation 3.37 - 84.24
Agricultural Soil - 0.22 64.7
Crop Residue Burning 0.25 0.01 8.21
Total 13.84 0.23 371.68
Some facts…..
Long cycle carbon dioxide: Product of combustion or degradation
of substances of ancient carbon which was not available to reach
the atmosphere easily, for example carbon in fossil fuel (Smith et al.,
2001).
Short cycle carbon dioxide: Carbon that completes its cycle fast
and is available to be taken up by plants when degraded aerobically
by microorganisms (Lou & Nair, 2009).
Punjab, Haryana, Uttar Pradesh and Andhra Pradesh emit higher
amount of N2O-N because of higher nitrogen fertilizer use
(Singh et al., 2012).
West Bengal, Andhra Pradesh, Orissa, Bihar, Jharkhand and North-
eastern States emit more amount of methane due to higher rice
cultivation (Singh et al., 2012) .
15
Contd..
Tillage contributes CO2 through the rapid organic matter
decomposition due to exposure of larger surface area to
increased oxygen supply.
Tillage almost doubles the rate of decline in soil organic carbon
levels in the top 20 cm of soil.
Every litre of diesel fuel used by tillage machinery and irrigation
pumps also contribute 2.6 Kg CO2 to the atmosphere.
Thus, nearly 400 Kg CO2 is generated assuming an annual use of
150 litres diesel in the conventional Rice-Wheat system.
16
Kumar et al., 2012
IPCC, 201017
OPPORTUNITIES FOR
MITIGATION
Reducing emissions
Enhancing removals/carbon
sequestration
Avoiding emissions
18
1. Reducing emissions
Agriculture releases to the atmosphere significant amounts of CO2,
CH4 or N2O.
The fluxes of these gases can be reduced by more efficient
management of carbon and nitrogen flows in agricultural
ecosystems(Paustian et al., 2004).
Practices that deliver added N more efficiently to crops often
reduce N2O emissions (Bouwman, 2008), and managing livestock
to make most efficient use of feeds often reduces amounts of CH4
produced (Clemens and Ahlgrimm, 2007).
The approaches that best reduce emissions depend on local
conditions, and therefore, vary from region to region.
19
2. Enhancing removals
Agricultural ecosystems hold large carbon reserves (IPCC, 2001a), mostly in soil
organic matter.
Historically, these systems have lost more than 50 Pg C but some of this carbon
lost can be recovered through improved management, thereby withdrawing
atmospheric CO2.
Any practice that increases the photosynthetic input of carbon and/or slows the
return of stored carbon to CO2 via respiration, fire or erosion will increase carbon
reserves, thereby ‘sequestering’ carbon or building carbon ‘sinks’.
Significant amounts of vegetative carbon can also be stored in agro-forestry
systems or other perennial plantings on agricultural lands (Albrecht and Kandji,
2003).
Agricultural lands also remove CH4 from the atmosphere by oxidation but less
than forests (Tate et al., 2006).
20
3. Avoiding emissions
Crops and residues from agricultural lands can be used as a source of fuel,
either directly or after conversion to fuels such as ethanol or diesel
(Schneider and McCarl, 2003; Cannell, 2003).
These bio-energy feedstocks still release CO2 upon combustion, but now
the carbon is of recent atmospheric origin (via photosynthesis), rather than
from fossil carbon.
The net benefit of these bio-energy sources to the atmosphere is equal to
the fossil-derived emissions displaced, less any emissions from producing,
transporting, and processing.
GHG emissions, notably CO2, can also be avoided by agricultural
management practices that forestall the cultivation of new lands now
under forest, grassland, or other non-agricultural vegetation (Foley et al.,
2005).
21
Mitigation technologies
Cropland
management
Grazing land
management
Management
of organic soil
Restoration of
degraded land
Livestock
management
Bioenergy
22
Crop land management
1. Agronomy
2. Nutrient management
3. Tillage and residue management
4. Water management
5. Rice management
6. Agroforestry
7. Land use change
8. Avoiding Biomass burning
23
The most obvious way to reduce CO2 emissions to the atmosphere
would be to follow management practices that reduce the
oxidation of soil organic matter and increase sequestration.
The mineralization of C from soil organic matter follows an
exponential pattern.
A simple model to predict the rate of change of C is:
dC/dt = a - kC
k= decomposition constant,
C= Carbon content of a given soil at time t,
a= accretion constant reflecting the amount of C added to the soil through
agricultural operations
Srinivas & Sridevi, 200524
Table 3. Conditions causing low and high decomposition rate
constants (k).
Low k High k
Natural ecosystems Deforestation
Manmade forests Cultivation of marginal lands
Cultivation of prime land Biomass burning
Science based agriculture with judicious
inputs
Resource based and low input
agriculture
Conservation tillage Plough-based tillage
Crop residue return Soil fertility depletion
Diversified cropping/farming systems Soil degradation
Diversified cropping/farming systems
Srinivas & Sridevi, 200525
Fig.1. Soil carbon pool and its interaction with the atmospheric biotic pools.
Naresh et al., 201326
Fig.2. Sustainable land management (SLM) options to increase net primary production
and ecosystem soil organic carbon (SOC) pool to mitigate climate change
Naresh et al., 201327
Fig.3. Global warming potential of conventionally flooded and mid season
drainage technologies in rice.
Pathak & Agarwal, 201328
Fig.4. Emission of methane in direct seeded rice and transplanted rice in
Jalandhar, Punjab, 2010.
Pathak and Agarwal, 201329
Table 4: Methane emission of rice as influenced by methods of cultivation and sources of
nutrients at different growth stages
30
Naik et al., 2015
Shivamogga
Table 5: Methane production of rice as influenced by methods of cultivation and
sources of nutrients at different growth stages
Naik et al., 2015Shivamogga 31
Table 6. Methane emission as influenced by establishment techniques and sources
of nutrients during kharif, 2005.
Jayadeva et al., 2009
Treatments Methane emission (mg/plant/day)
30 DAS 40 DAS 50 DAS 60 DAS 70 DAS 80 DAS 90 DAS Total
Establishment techniques
M1(Transplanting) 0.104 2.17 2.60 4.42 5.38 5.80 4.10 24.57
M2 (SRI) 0.161 2.31 2.71 3.29 4.29 5.30 3.96 22.01
M3 (Aerobic) 0.116 1.54 1.66 2.27 2.69 3.10 2.69 13.18
S.Em± 0.003 0.10 0.10 0.24 0.24 0.52 0.44 0.45
CD at 1% 0.007 0.26 0.26 0.66 0.67 1.43 1.22 1.23
Sources of nutrients
S1 (RDF) 0.124 1.21 1.53 2.55 2.89 3.09 1.96 13.35
S2 (Sunnhemp+RDF) 0.128 2.19 2.33 3.17 3.90 4.59 3.05 19.35
S3 (Paddystraw+RDF) 0.126 2.46 2.99 4.23 5.42 6.21 4.56 25.99
S4 (FYM+ RDF) 0.130 2.18 2.43 3.35 4.26 5.04 3.59 20.98
S.Em± 0.001 0.09 0.10 0.13 0.16 0.19 0.14 0.40
CD at 1% 0.003 0.22 0.24 0.32 0.38 0.47 0.33 0.97
32
Veronica & Silvia, 201533
Veronica & Silvia, 201534
Table 7: Emission balance of composting process and landfilling (Gg carbon dioxide;
1 Gg= 1000 Mg) for a year of green waste deposit.
Joshua & Murugesan, 2015Fig.5. Process Flow Diagram 35
Table 8. Gas and power generation details
Joshua & Murugesan, 2015
36
Calculation of amount of mitigated
methane by Biomethanation process
Joshua & Murugesan, 201537
Table 9. Influence of tillage /establishment options on grain yield and carbon
sustainability index in Rice-Wheat and Maize-Wheat system
Jat et al., 201038
Table 10. Carbon emission, sequestration and Global warming potential in
wheat with different technological options.
Technology CO2-C sequestration
(kg/ha)
Total GWP (kg CO2/ha)
Conventional tillage 0 1808
Sprinkler irrigation 0 1519
Zero tillage 368 111
Integrated nutrient
management
300 -171
Organic wheat 600 1880
Nitrification inhibitors 0 1663
Pathak & Agarwal, 2012
39
Table 11. Methane emission (g) and its relation with nutrients
Parameter Control Treatment
Av. Body wt. (kg) 429.92 ± 27.93 405.50 ± 17.61
Av. Milk production (kg day-1) 14.69 ± 0.77 14.14 ± 0.81
Methane (g day-1)** 363.05 ± 13.71 289.72 ± 15.20
Methane (g kg-1) 844.46 ± 25.41 714.45 ± 31.19
Methane per kg nutrient uptake (g)
DMI* 22.67 ± 0.51 18.46 ± 0.92
DDMI* 36.08 ± 0.87 28.31 ± 1.61
OMI* 24.58 ± 0.98 19.98 ± 1.00
DOMI* 36.91 ± 1.07 29.38 ± 1.65
NDF* 74.07 ± 2.52 60.52 ± 3.12
ADF* 80.79 ± 2.79 66.35 ± 2.42
Methane per kg milk (g)* 24.89 ± 1.23 0.69 ± 1.29
* p<0.05, ** p<0.01
Jain et al., 2011
40
Fig.6. The process of natural nitrification inhibition
Upadhyay et al., 2011
41
Table 12. Natural nitrification inhibitors for higher nitrogen use efficiency, crop yield, and
for curtailing global warming
Upadhyay et al., 2011
Plant species Chemical/ plant
part involved
NNI effect
Neem
(Azadirachta indica Adr. Juss.)
Neem seed extract
and neem oil
emulsion
Increased N use efficiency, test weight
and grain yield of rice
Koronivia grass
(Brachiaria humidicola)
Root exudates Nitrification inhibited for ~50 days
Karanj
(Pongamia glabra Vent.)
Karanjin
(seed extract)
Highly efficient nitrification inhibitor
(62-75 %) and N2O mitigator (92-96 %)
reduction in N2O emission )
Mint
(Mentha spicata L.)
Dementholated oil
(1%) coated urea
Significantly retards urease activity, as
well as Nitrosomonas and Nitrobacter
activities.
Karanj
(Pongamia glabra Vent.)
Karanj cake NNI properties
Mint
(Mentha spicata L.)
Essential oil Increased N use efficiency up to 30-35
%
42
Table 14. Effect of tillage on N2O emission from soil.
Treatments N2O emission rate
(g ha-1 day-1)
Denitrifier counts
(x 106 kg-1 )
Conventional-till (wheat) 127 440
Conventional-till (fallow) 157 2300
Zero-till (wheat) 140 1063
Zero-till (fallow) 171 2900
Aulakh et al., 200543
Treatment Total N2O (N2O-N kg-1 of soil)
Submergence Field Capacity 80% max WHC
Control 31.64 d 54.56 d 78.88 d
Urea 298.51 a 333.68 a 744.42 a
Urea-DCD 138.35 c 217.77 c 415.64 c
Urea-thiosulphate 272.80 b 313.53 b 654.75 b
Table 13. Effect of nitrification inhibitors on the N2O emission from soil.
Fig.7. Content of N2O-N as a function of NO3 reduction in under flooding
conditions.
Sangeeta et al., 2009
44
Table 15. Cumulative gases production in various treated soil in 62 days of submerged
incubation.
Singla & Inubushi, 2013
45
Singla & Inubushi, 2013
Fig.8. CO2 production potential pattern in various treated soil incubated
under submerged condition
46
Fig.9. Methane emission at maturity stage Fig.10. Carbon dioxide emission at maturity stage
Suborna et al., 2015
47
Fig.11. Nitrous oxide emission at maturity
stage.
Fig.12. Global warming potential of the crop
sequence.
Suborna et al., 2015
48
Table 16. Interventions adopted in the seven villages of Maharashtra under NICRA
project
Module Improved practices Traditional practices
Crop management 1. Adopting improved cultivars
2. Zero tillage
3. Crop diversification with
legumes
1. Adopting local varieties
2. Intensive cultivation with 2-3
ploughings and disc
harrowing
3. No crop diversification
Water saving techniques 1. Micro irrigation
2. In situ moisture conservation
3. Water harvesting
4. Rice cultivation (intermittent
flooding)
1. Flood irrigation
2. No conservation measures
for moisture
3. No water harvesting
4. Rice cultivation with flooding
Nutrient Management 1. Soil test based nutrient use
(Rational use)
2. Improving nitrogen use
efficiency
3. Green manuring
4. Composting
5. Use of leaf colour charts
1. Blanket application
2. No such practices
3. Not practiced
4. Not practiced
5. Not practiced
livestock interventions 1. Biogas slurry
2. Improved feeding practices
3. Improved breeding practices
1. Not practiced
2. Grazing and rice straw
feeding
3. Inbreeding
Srinivasarao et al., 2013
49
Table 17. Overall GHG emissions ‘with’ and ‘without’ project due application of
different fertilizers and pesticides
Srinivasarao et al., 201350
Fig.13. Impact of improved practices over traditional practices on CO2 emissions (t CO2)
in different project villages. 51
Fig. 14. Percent of total GHGs mitigation from livestock sector by adoption of different
interventions.
Srinivasarao et al., 2013
52
Fig.15. Relationship between density of animals and tractors.
Dikshit & Birthal, 2010
53
Table 18. Values of the relevant parameters used in estimation of environmental
contribution of draught animals.
Parameters Value
Consumption of diesel per tractor (tonnes/yr) 3.25
Carbon fraction of diesel 0.87
Fraction oxidized 0.99
Conversion factor from carbon released to carbon dioxide 0.37
Dikshit & Birthal, 2010
Table 19. Prevention of greenhouse gas emission due to use of draught animal.
powerParticulars Value
No. of tractor required to replace the existing stock of working animals
(million)
5.95
Consumption of diesel by the required number of tractors
(million tonnes)
19.34
Estimated carbon release from burning of fossil
fuel (million tonnes)
16.75
Estimated prevention of carbon dioxide emission (million tonnes) 6.14
54
Conclusions
Agriculture can be a potential sink for atmospheric carbon dioxide
through adoption of improved recommended practices.
Carbon sequestration technique can be used to regulate carbon dioxide
pool.
Aerobic rice cultivation can be practiced to reduce methane emissions.
Efficient nitrogen management can be practiced to minimize nitrous
oxide emissions.
55
Contd…
Management of feed in livestock sector can minimize methane
emissions.
Many adaptation and mitigation options can help address climate
change, but no single option is sufficient by itself.
Mitigation can be more cost-effective if using an integrated
approach that combines measures to reduce emissions.
56
Future thrust
Integrated impact
and adaptation
assessment
including all sectors
of agriculture.
Developing
region-wise
specific
adaptation
strategies for
climatic risk.
Assessment on
waste management
and recycling.
57
THANK YOU … 58

1. credit seminar

  • 1.
    MECHANISMS CONTROLLING GREEN HOUSEGAS EMISSIONS Presented by: Kumari Aditi Dept. of Agronomy Professor Jayashankar Telangana State Agricultural University Department of SSAC, College Of Agriculture Rajendranagar, Hyderabad-30 1
  • 2.
    CONTENTS 1. What isGreen House Effect and Green House Gases? 2. Present scenario of Green House Gases in India and world. 3. Opportunities for mitigation. 4. Technologies of mitigation. 5. Case studies. 6. Conclusion. 7. Future line of work. 2
  • 3.
    WHAT IS GREENHOUSEEFFECT?  “The green house effect is the natural process by which radiation from a planet's atmosphere warms the planet's surface to a temperature above what it would be in the absence of its atmosphere”.  Greenhouse gases keep the Earth warm. Erath’s temperature will be -18 0C in absence of this effect. The actual problem is accelerated Green House Effect which leads to GLOBAL WARMING. 3
  • 4.
  • 5.
  • 6.
    REASONS FOR EMISSIONOF GREEN HOUSE GASES CO2 Burning of fossil fuels. Released largely from microbial decay. Burning of plant litter. Soil organic matter oxidation. CH4 Decomposition of organic materials in reduced conditions. Fermentative digestion by ruminant livestock. Stored manures. Rice grown under flooded conditions. 6
  • 7.
    Contd… N2O Microbial transformation of nitrogenin soils and manures. Enhanced where available nitrogen (N) exceeds plant requirements. Under wet conditions. CFC 7 Industrial production. Consumer goods. Refrigerants. Foam blowing agents. Solvents. Fire retardants. Aerosol can propellants.
  • 8.
    Global warming potential Globalwarming potential is the measure of the ability of a gas to trap thermal energy in the atmosphere for a specified period of time. Methane and nitrous oxide are greenhouse gases (GHGs) that have a global warming potential of the atmosphere 25 times and 298 times, respectively, higher than carbon dioxide (IPCC, 2007). GWP= (Carbon dioxide + methane × 25 + nitrous oxide × 298) Carbon dioxide that has global warming potential is called long cycle carbon dioxide. Because of increasing emission of nitrous oxide, the total global warming potential GWP of Indian agriculture per unit area (kg CO2 eq. ha-1 is increasing. 8
  • 9.
  • 10.
  • 11.
    Table 1. Atmosphericconcentration, lifetime and global warming potential (GWP) of major greenhouse gases Pathak and Agrawal, 2013 11
  • 12.
    Contribution of differentsectors in GHG emissions in India 41% 28% 24% 7% energy sector agriculture industry others 12INCCA, 2013
  • 13.
    Major sources ofGHGs from agriculture sector 62% 21% 13% 2%2% Enteric Fermentation Rice Cultivation Agricultural soils Manure management Burning of crop residues 13INCCA, 2013
  • 14.
    Table 2. Presentscenario of green house gases in India. INCCA, 2013 Source CH4 (million ton) N2O (million ton) CO2 eq. (million ton) Enteric fermentation 10.10 - 21.09 Manure management 0.12 - 2.44 Rice cultivation 3.37 - 84.24 Agricultural Soil - 0.22 64.7 Crop Residue Burning 0.25 0.01 8.21 Total 13.84 0.23 371.68
  • 15.
    Some facts….. Long cyclecarbon dioxide: Product of combustion or degradation of substances of ancient carbon which was not available to reach the atmosphere easily, for example carbon in fossil fuel (Smith et al., 2001). Short cycle carbon dioxide: Carbon that completes its cycle fast and is available to be taken up by plants when degraded aerobically by microorganisms (Lou & Nair, 2009). Punjab, Haryana, Uttar Pradesh and Andhra Pradesh emit higher amount of N2O-N because of higher nitrogen fertilizer use (Singh et al., 2012). West Bengal, Andhra Pradesh, Orissa, Bihar, Jharkhand and North- eastern States emit more amount of methane due to higher rice cultivation (Singh et al., 2012) . 15
  • 16.
    Contd.. Tillage contributes CO2through the rapid organic matter decomposition due to exposure of larger surface area to increased oxygen supply. Tillage almost doubles the rate of decline in soil organic carbon levels in the top 20 cm of soil. Every litre of diesel fuel used by tillage machinery and irrigation pumps also contribute 2.6 Kg CO2 to the atmosphere. Thus, nearly 400 Kg CO2 is generated assuming an annual use of 150 litres diesel in the conventional Rice-Wheat system. 16 Kumar et al., 2012
  • 17.
  • 18.
    OPPORTUNITIES FOR MITIGATION Reducing emissions Enhancingremovals/carbon sequestration Avoiding emissions 18
  • 19.
    1. Reducing emissions Agriculturereleases to the atmosphere significant amounts of CO2, CH4 or N2O. The fluxes of these gases can be reduced by more efficient management of carbon and nitrogen flows in agricultural ecosystems(Paustian et al., 2004). Practices that deliver added N more efficiently to crops often reduce N2O emissions (Bouwman, 2008), and managing livestock to make most efficient use of feeds often reduces amounts of CH4 produced (Clemens and Ahlgrimm, 2007). The approaches that best reduce emissions depend on local conditions, and therefore, vary from region to region. 19
  • 20.
    2. Enhancing removals Agriculturalecosystems hold large carbon reserves (IPCC, 2001a), mostly in soil organic matter. Historically, these systems have lost more than 50 Pg C but some of this carbon lost can be recovered through improved management, thereby withdrawing atmospheric CO2. Any practice that increases the photosynthetic input of carbon and/or slows the return of stored carbon to CO2 via respiration, fire or erosion will increase carbon reserves, thereby ‘sequestering’ carbon or building carbon ‘sinks’. Significant amounts of vegetative carbon can also be stored in agro-forestry systems or other perennial plantings on agricultural lands (Albrecht and Kandji, 2003). Agricultural lands also remove CH4 from the atmosphere by oxidation but less than forests (Tate et al., 2006). 20
  • 21.
    3. Avoiding emissions Cropsand residues from agricultural lands can be used as a source of fuel, either directly or after conversion to fuels such as ethanol or diesel (Schneider and McCarl, 2003; Cannell, 2003). These bio-energy feedstocks still release CO2 upon combustion, but now the carbon is of recent atmospheric origin (via photosynthesis), rather than from fossil carbon. The net benefit of these bio-energy sources to the atmosphere is equal to the fossil-derived emissions displaced, less any emissions from producing, transporting, and processing. GHG emissions, notably CO2, can also be avoided by agricultural management practices that forestall the cultivation of new lands now under forest, grassland, or other non-agricultural vegetation (Foley et al., 2005). 21
  • 22.
    Mitigation technologies Cropland management Grazing land management Management oforganic soil Restoration of degraded land Livestock management Bioenergy 22
  • 23.
    Crop land management 1.Agronomy 2. Nutrient management 3. Tillage and residue management 4. Water management 5. Rice management 6. Agroforestry 7. Land use change 8. Avoiding Biomass burning 23
  • 24.
    The most obviousway to reduce CO2 emissions to the atmosphere would be to follow management practices that reduce the oxidation of soil organic matter and increase sequestration. The mineralization of C from soil organic matter follows an exponential pattern. A simple model to predict the rate of change of C is: dC/dt = a - kC k= decomposition constant, C= Carbon content of a given soil at time t, a= accretion constant reflecting the amount of C added to the soil through agricultural operations Srinivas & Sridevi, 200524
  • 25.
    Table 3. Conditionscausing low and high decomposition rate constants (k). Low k High k Natural ecosystems Deforestation Manmade forests Cultivation of marginal lands Cultivation of prime land Biomass burning Science based agriculture with judicious inputs Resource based and low input agriculture Conservation tillage Plough-based tillage Crop residue return Soil fertility depletion Diversified cropping/farming systems Soil degradation Diversified cropping/farming systems Srinivas & Sridevi, 200525
  • 26.
    Fig.1. Soil carbonpool and its interaction with the atmospheric biotic pools. Naresh et al., 201326
  • 27.
    Fig.2. Sustainable landmanagement (SLM) options to increase net primary production and ecosystem soil organic carbon (SOC) pool to mitigate climate change Naresh et al., 201327
  • 28.
    Fig.3. Global warmingpotential of conventionally flooded and mid season drainage technologies in rice. Pathak & Agarwal, 201328
  • 29.
    Fig.4. Emission ofmethane in direct seeded rice and transplanted rice in Jalandhar, Punjab, 2010. Pathak and Agarwal, 201329
  • 30.
    Table 4: Methaneemission of rice as influenced by methods of cultivation and sources of nutrients at different growth stages 30 Naik et al., 2015 Shivamogga
  • 31.
    Table 5: Methaneproduction of rice as influenced by methods of cultivation and sources of nutrients at different growth stages Naik et al., 2015Shivamogga 31
  • 32.
    Table 6. Methaneemission as influenced by establishment techniques and sources of nutrients during kharif, 2005. Jayadeva et al., 2009 Treatments Methane emission (mg/plant/day) 30 DAS 40 DAS 50 DAS 60 DAS 70 DAS 80 DAS 90 DAS Total Establishment techniques M1(Transplanting) 0.104 2.17 2.60 4.42 5.38 5.80 4.10 24.57 M2 (SRI) 0.161 2.31 2.71 3.29 4.29 5.30 3.96 22.01 M3 (Aerobic) 0.116 1.54 1.66 2.27 2.69 3.10 2.69 13.18 S.Em± 0.003 0.10 0.10 0.24 0.24 0.52 0.44 0.45 CD at 1% 0.007 0.26 0.26 0.66 0.67 1.43 1.22 1.23 Sources of nutrients S1 (RDF) 0.124 1.21 1.53 2.55 2.89 3.09 1.96 13.35 S2 (Sunnhemp+RDF) 0.128 2.19 2.33 3.17 3.90 4.59 3.05 19.35 S3 (Paddystraw+RDF) 0.126 2.46 2.99 4.23 5.42 6.21 4.56 25.99 S4 (FYM+ RDF) 0.130 2.18 2.43 3.35 4.26 5.04 3.59 20.98 S.Em± 0.001 0.09 0.10 0.13 0.16 0.19 0.14 0.40 CD at 1% 0.003 0.22 0.24 0.32 0.38 0.47 0.33 0.97 32
  • 33.
  • 34.
    Veronica & Silvia,201534 Table 7: Emission balance of composting process and landfilling (Gg carbon dioxide; 1 Gg= 1000 Mg) for a year of green waste deposit.
  • 35.
    Joshua & Murugesan,2015Fig.5. Process Flow Diagram 35
  • 36.
    Table 8. Gasand power generation details Joshua & Murugesan, 2015 36
  • 37.
    Calculation of amountof mitigated methane by Biomethanation process Joshua & Murugesan, 201537
  • 38.
    Table 9. Influenceof tillage /establishment options on grain yield and carbon sustainability index in Rice-Wheat and Maize-Wheat system Jat et al., 201038
  • 39.
    Table 10. Carbonemission, sequestration and Global warming potential in wheat with different technological options. Technology CO2-C sequestration (kg/ha) Total GWP (kg CO2/ha) Conventional tillage 0 1808 Sprinkler irrigation 0 1519 Zero tillage 368 111 Integrated nutrient management 300 -171 Organic wheat 600 1880 Nitrification inhibitors 0 1663 Pathak & Agarwal, 2012 39
  • 40.
    Table 11. Methaneemission (g) and its relation with nutrients Parameter Control Treatment Av. Body wt. (kg) 429.92 ± 27.93 405.50 ± 17.61 Av. Milk production (kg day-1) 14.69 ± 0.77 14.14 ± 0.81 Methane (g day-1)** 363.05 ± 13.71 289.72 ± 15.20 Methane (g kg-1) 844.46 ± 25.41 714.45 ± 31.19 Methane per kg nutrient uptake (g) DMI* 22.67 ± 0.51 18.46 ± 0.92 DDMI* 36.08 ± 0.87 28.31 ± 1.61 OMI* 24.58 ± 0.98 19.98 ± 1.00 DOMI* 36.91 ± 1.07 29.38 ± 1.65 NDF* 74.07 ± 2.52 60.52 ± 3.12 ADF* 80.79 ± 2.79 66.35 ± 2.42 Methane per kg milk (g)* 24.89 ± 1.23 0.69 ± 1.29 * p<0.05, ** p<0.01 Jain et al., 2011 40
  • 41.
    Fig.6. The processof natural nitrification inhibition Upadhyay et al., 2011 41
  • 42.
    Table 12. Naturalnitrification inhibitors for higher nitrogen use efficiency, crop yield, and for curtailing global warming Upadhyay et al., 2011 Plant species Chemical/ plant part involved NNI effect Neem (Azadirachta indica Adr. Juss.) Neem seed extract and neem oil emulsion Increased N use efficiency, test weight and grain yield of rice Koronivia grass (Brachiaria humidicola) Root exudates Nitrification inhibited for ~50 days Karanj (Pongamia glabra Vent.) Karanjin (seed extract) Highly efficient nitrification inhibitor (62-75 %) and N2O mitigator (92-96 %) reduction in N2O emission ) Mint (Mentha spicata L.) Dementholated oil (1%) coated urea Significantly retards urease activity, as well as Nitrosomonas and Nitrobacter activities. Karanj (Pongamia glabra Vent.) Karanj cake NNI properties Mint (Mentha spicata L.) Essential oil Increased N use efficiency up to 30-35 % 42
  • 43.
    Table 14. Effectof tillage on N2O emission from soil. Treatments N2O emission rate (g ha-1 day-1) Denitrifier counts (x 106 kg-1 ) Conventional-till (wheat) 127 440 Conventional-till (fallow) 157 2300 Zero-till (wheat) 140 1063 Zero-till (fallow) 171 2900 Aulakh et al., 200543 Treatment Total N2O (N2O-N kg-1 of soil) Submergence Field Capacity 80% max WHC Control 31.64 d 54.56 d 78.88 d Urea 298.51 a 333.68 a 744.42 a Urea-DCD 138.35 c 217.77 c 415.64 c Urea-thiosulphate 272.80 b 313.53 b 654.75 b Table 13. Effect of nitrification inhibitors on the N2O emission from soil.
  • 44.
    Fig.7. Content ofN2O-N as a function of NO3 reduction in under flooding conditions. Sangeeta et al., 2009 44
  • 45.
    Table 15. Cumulativegases production in various treated soil in 62 days of submerged incubation. Singla & Inubushi, 2013 45
  • 46.
    Singla & Inubushi,2013 Fig.8. CO2 production potential pattern in various treated soil incubated under submerged condition 46
  • 47.
    Fig.9. Methane emissionat maturity stage Fig.10. Carbon dioxide emission at maturity stage Suborna et al., 2015 47
  • 48.
    Fig.11. Nitrous oxideemission at maturity stage. Fig.12. Global warming potential of the crop sequence. Suborna et al., 2015 48
  • 49.
    Table 16. Interventionsadopted in the seven villages of Maharashtra under NICRA project Module Improved practices Traditional practices Crop management 1. Adopting improved cultivars 2. Zero tillage 3. Crop diversification with legumes 1. Adopting local varieties 2. Intensive cultivation with 2-3 ploughings and disc harrowing 3. No crop diversification Water saving techniques 1. Micro irrigation 2. In situ moisture conservation 3. Water harvesting 4. Rice cultivation (intermittent flooding) 1. Flood irrigation 2. No conservation measures for moisture 3. No water harvesting 4. Rice cultivation with flooding Nutrient Management 1. Soil test based nutrient use (Rational use) 2. Improving nitrogen use efficiency 3. Green manuring 4. Composting 5. Use of leaf colour charts 1. Blanket application 2. No such practices 3. Not practiced 4. Not practiced 5. Not practiced livestock interventions 1. Biogas slurry 2. Improved feeding practices 3. Improved breeding practices 1. Not practiced 2. Grazing and rice straw feeding 3. Inbreeding Srinivasarao et al., 2013 49
  • 50.
    Table 17. OverallGHG emissions ‘with’ and ‘without’ project due application of different fertilizers and pesticides Srinivasarao et al., 201350
  • 51.
    Fig.13. Impact ofimproved practices over traditional practices on CO2 emissions (t CO2) in different project villages. 51
  • 52.
    Fig. 14. Percentof total GHGs mitigation from livestock sector by adoption of different interventions. Srinivasarao et al., 2013 52
  • 53.
    Fig.15. Relationship betweendensity of animals and tractors. Dikshit & Birthal, 2010 53
  • 54.
    Table 18. Valuesof the relevant parameters used in estimation of environmental contribution of draught animals. Parameters Value Consumption of diesel per tractor (tonnes/yr) 3.25 Carbon fraction of diesel 0.87 Fraction oxidized 0.99 Conversion factor from carbon released to carbon dioxide 0.37 Dikshit & Birthal, 2010 Table 19. Prevention of greenhouse gas emission due to use of draught animal. powerParticulars Value No. of tractor required to replace the existing stock of working animals (million) 5.95 Consumption of diesel by the required number of tractors (million tonnes) 19.34 Estimated carbon release from burning of fossil fuel (million tonnes) 16.75 Estimated prevention of carbon dioxide emission (million tonnes) 6.14 54
  • 55.
    Conclusions Agriculture can bea potential sink for atmospheric carbon dioxide through adoption of improved recommended practices. Carbon sequestration technique can be used to regulate carbon dioxide pool. Aerobic rice cultivation can be practiced to reduce methane emissions. Efficient nitrogen management can be practiced to minimize nitrous oxide emissions. 55
  • 56.
    Contd… Management of feedin livestock sector can minimize methane emissions. Many adaptation and mitigation options can help address climate change, but no single option is sufficient by itself. Mitigation can be more cost-effective if using an integrated approach that combines measures to reduce emissions. 56
  • 57.
    Future thrust Integrated impact andadaptation assessment including all sectors of agriculture. Developing region-wise specific adaptation strategies for climatic risk. Assessment on waste management and recycling. 57
  • 58.