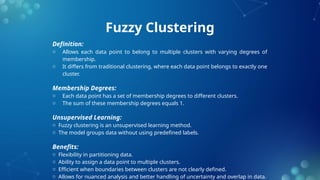
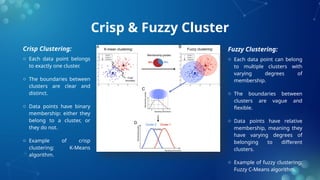
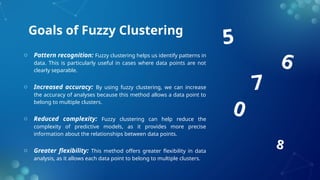
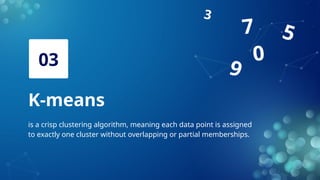
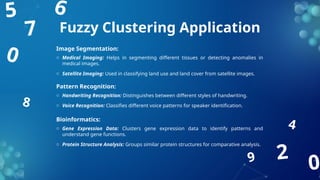
9
0
7
3
5
1
2
4
Fuzzy Clustering
Zahra Mojtahedin
Learning Brain Machine 1
Table of contents
01
03
02
04
Fuzzy Clustering
Goals of Fuzzy
Clustering
K-means (Review)
05
07
06
08
C-means
Fuzzy Clustering
Application
Pros and Cons
KFCM
Iris Dataset
Segmentation
Fuzzy Clustering
01
Fuzzy clustering allows data points to belong to multiple
clusters with varying degrees of membership.
9
0
7
3
5
Fuzzy Clustering
Definition:
o Allows each data point to belong to multiple clusters with varying degrees of
membership.
o It differs from traditional clustering, where each data point belongs to exactly one
cluster.
Membership Degrees:
o Each data point has a set of membership degrees to different clusters.
o The sum of these membership degrees equals 1.
Unsupervised Learning:
o Fuzzy clustering is an unsupervised learning method.
o The model groups data without using predefined labels.
Benefits:
o Flexibility in partitioning data.
o Ability to assign a data point to multiple clusters.
o Efficient when boundaries between clusters are not clearly defined.
o Allows for nuanced analysis and better handling of uncertainty and overlap in data.
Crisp & Fuzzy Cluster
Crisp Clustering:
o Each data point belongs
to exactly one cluster.
o The boundaries between
clusters are clear and
distinct.
o Data points have binary
membership: either they
belong to a cluster, or
they do not.
o Example of crisp
clustering: K-Means
algorithm.
Fuzzy Clustering:
o Each data point can belong
to multiple clusters with
varying degrees of
membership.
o The boundaries between
clusters are vague and
flexible.
o Data points have relative
membership, meaning they
have varying degrees of
belonging to different
clusters.
o Example of fuzzy clustering:
Fuzzy C-Means algorithm.
Goals of Fuzzy Clustering
02
The primary goal of fuzzy clustering is to identify patterns in data
with increased accuracy and flexibility.
9
0
7
3
5
Goals of Fuzzy Clustering
o Pattern recognition: Fuzzy clustering helps us identify patterns in
data. This is particularly useful in cases where data points are not
clearly separable.
o Increased accuracy: By using fuzzy clustering, we can increase
the accuracy of analyses because this method allows a data point to
belong to multiple clusters.
o Reduced complexity: Fuzzy clustering can help reduce the
complexity of predictive models, as it provides more precise
information about the relationships between data points.
o Greater flexibility: This method offers greater flexibility in data
analysis, as it allows each data point to belong to multiple clusters.
0
7
5
8
6
K-means
03
is a crisp clustering algorithm, meaning each data point is assigned
to exactly one cluster without overlapping or partial memberships.
9
0
7
3
5
K-means
K-Means Clustering is one of the most commonly used algorithms in unsupervised
machine learning for partitioning a dataset into distinct clusters. This algorithm
assigns each data point to one of K clusters by minimizing the within-cluster
variance.
K-means
o Choosing the Number of Clusters: Decide on the number of clusters, to partition the data.
This is typically based on prior knowledge or by using methods like the elbow method.
o Initialization of Centroids: Randomly select K data points from the dataset as the initial
cluster centroids.
o Assigning Data Points to Clusters: Each data point is assigned to the nearest centroid,
forming K clusters. The distance metric commonly used is the Euclidean distance.
o Updating Centroids: Recalculate the centroid of each cluster by taking the mean of all data
points assigned to that cluster. The centroid is the new center of the cluster.
o Iterating Until Convergence: Steps 3 and 4 are repeated until the centroids no longer
change significantly, indicating that the algorithm has converged.
K-means
o Objective Function: The objective of K-means is to minimize the sum of squared distances
between data points and their respective cluster centroids. This can be formulated as:
where:
 is the number of clusters.
 represents the i-th cluster.
 x is a data point in cluster .
 is the centroid of cluster .
𝐽=∑
𝑖=1
𝑘
∑
𝑥∈𝐶𝑖
¿|𝑥−𝜇𝑖|∨¿2
¿
K-means
o Cluster Assignment Step: Assign each data point to the cluster with the nearest centroid:
 where is the cluster assignment for data point .
o Centroid Update Step: Update the centroid of each cluster by calculating the mean of all data
points assigned to that cluster:
 where is the number of data points in cluster .
∣∣
𝑐 𝑗=𝑎𝑟𝑔 min
𝑘
¿|𝑥− 𝜇𝑖|∨¿2
¿
𝜇𝑖=
1
|𝐶𝑖|
∑
𝑥𝑗 ∈𝐶 𝑗
𝑥 𝑗
C-means
04
An algorithm that assigns data points to clusters with varying
degrees of membership, enhancing flexibility and precision in
clustering.
9
0
7
3
5
C-means
Fuzzy C-Means (FCM) is an unsupervised learning algorithm that allows each data
point to belong to multiple clusters with varying degrees of membership. This
approach is particularly useful for analyzing complex and non-separable data. FCM
clustering is a soft clustering approach, where each data point is assigned a
likelihood or probability score belonging to that cluster.
C-means
1. Initialization:
o Determine the number of clusters () and the fuzziness parameter ().
o Initialize the membership matrix () with random values, where indicates the
membership degree of data point ii in cluster .
2. Compute Cluster Centers:
o Calculate the cluster centers using the following formula:
o where is the data point i and is the total number of data points.
C-means
3. Update Membership Matrix:
o Update the membership degrees using the following formula:
4. Check for Convergence:
o If the change in the membership matrix is less than a specified threshold (e.g., ), the algorithm stops.
ϵ
Otherwise, go back to step 2.
C-means
C-means
Fuzzy Clustering
Application
05 9
0
7
3
5
0
7
5
8
6
2
4
9
0
Fuzzy Clustering Application
Image Segmentation:
o Medical Imaging: Helps in segmenting different tissues or detecting anomalies in
medical images.
o Satellite Imaging: Used in classifying land use and land cover from satellite images.
Pattern Recognition:
o Handwriting Recognition: Distinguishes between different styles of handwriting.
o Voice Recognition: Classifies different voice patterns for speaker identification.
Bioinformatics:
o Gene Expression Data: Clusters gene expression data to identify patterns and
understand gene functions.
o Protein Structure Analysis: Groups similar protein structures for comparative analysis.
Iris Dataset
Segmentation
06 9
0
7
3
5
Iris Dataset
o Origin: The dataset was introduced by British biologist and statistician Ronald A. Fisher in his
1936 paper "The use of multiple measurements in taxonomic problems".
o Content: It contains 150 samples from three species of iris flowers (Iris setosa, Iris versicolor, and
Iris virginica).
o Features: Each sample has four features:
Sepal length (in centimeters) Sepal width (in centimeters)
Petal length (in centimeters) Petal width (in centimeters)
o Classes: There are three classes, each corresponding to one species of iris flower (50 samples per
class).
Iris Dataset
Iris Dataset
KFCM
07 9
0
7
3
5
KFCM
o FCM is not robust in noisy images
o Lack of local information of image
pixels
o Spatial penalty
Pros and Cons
08 9
0
7
3
5
0
7
3
5
Pros and Cons
Pros
o Gives best result for overlapped data set and comparatively better then k-means algorithm.
o Unlike k-means where data point must exclusively belong to one cluster center here data
point is assigned membership to each cluster center as a result of which data point may
belong to more then one cluster center.
Cons
o Apriori specification of the number of clusters.
o With lower value of β we get the better result but at the expense of more number of
iteration.
o Euclidean distance measures can unequally weight underlying factors.
o The performance of the FCM algorithm depends on the selection of the initial cluster center
and/or the initial membership value.
● J. C. Dunn (1973): 'A Fuzzy Relative of the ISODATA Process and Its Use in Detecting Compact
Well-Separated Clusters', Journal of Cybernetics 3: 32-57
● J. C. Bezdek (1981): 'Pattern Recognition with Fuzzy Objective Function Algorithms', Plenum
Press, New York
● Tariq Rashid: 'Clustering'
● Hans-Joachim Mucha and Hizir Sofyan: 'Nonhierarchical Clustering'
● http://www.cs.bris.ac.uk/home/ir600/documentation/fuzzy_clustering_initial_report/node11.
html
● http://www.quantlet.com/mdstat/scripts/sg/ssd/html/sgshiftclumei149.html
References
Thanks for your attention!

Fuzzy Clustering & Fuzzy Classification Method

  • 1.
  • 2.
    Table of contents 01 03 02 04 FuzzyClustering Goals of Fuzzy Clustering K-means (Review) 05 07 06 08 C-means Fuzzy Clustering Application Pros and Cons KFCM Iris Dataset Segmentation
  • 3.
    Fuzzy Clustering 01 Fuzzy clusteringallows data points to belong to multiple clusters with varying degrees of membership. 9 0 7 3 5
  • 4.
    Fuzzy Clustering Definition: o Allowseach data point to belong to multiple clusters with varying degrees of membership. o It differs from traditional clustering, where each data point belongs to exactly one cluster. Membership Degrees: o Each data point has a set of membership degrees to different clusters. o The sum of these membership degrees equals 1. Unsupervised Learning: o Fuzzy clustering is an unsupervised learning method. o The model groups data without using predefined labels. Benefits: o Flexibility in partitioning data. o Ability to assign a data point to multiple clusters. o Efficient when boundaries between clusters are not clearly defined. o Allows for nuanced analysis and better handling of uncertainty and overlap in data.
  • 5.
    Crisp & FuzzyCluster Crisp Clustering: o Each data point belongs to exactly one cluster. o The boundaries between clusters are clear and distinct. o Data points have binary membership: either they belong to a cluster, or they do not. o Example of crisp clustering: K-Means algorithm. Fuzzy Clustering: o Each data point can belong to multiple clusters with varying degrees of membership. o The boundaries between clusters are vague and flexible. o Data points have relative membership, meaning they have varying degrees of belonging to different clusters. o Example of fuzzy clustering: Fuzzy C-Means algorithm.
  • 6.
    Goals of FuzzyClustering 02 The primary goal of fuzzy clustering is to identify patterns in data with increased accuracy and flexibility. 9 0 7 3 5
  • 7.
    Goals of FuzzyClustering o Pattern recognition: Fuzzy clustering helps us identify patterns in data. This is particularly useful in cases where data points are not clearly separable. o Increased accuracy: By using fuzzy clustering, we can increase the accuracy of analyses because this method allows a data point to belong to multiple clusters. o Reduced complexity: Fuzzy clustering can help reduce the complexity of predictive models, as it provides more precise information about the relationships between data points. o Greater flexibility: This method offers greater flexibility in data analysis, as it allows each data point to belong to multiple clusters. 0 7 5 8 6
  • 8.
    K-means 03 is a crispclustering algorithm, meaning each data point is assigned to exactly one cluster without overlapping or partial memberships. 9 0 7 3 5
  • 9.
    K-means K-Means Clustering isone of the most commonly used algorithms in unsupervised machine learning for partitioning a dataset into distinct clusters. This algorithm assigns each data point to one of K clusters by minimizing the within-cluster variance.
  • 10.
    K-means o Choosing theNumber of Clusters: Decide on the number of clusters, to partition the data. This is typically based on prior knowledge or by using methods like the elbow method. o Initialization of Centroids: Randomly select K data points from the dataset as the initial cluster centroids. o Assigning Data Points to Clusters: Each data point is assigned to the nearest centroid, forming K clusters. The distance metric commonly used is the Euclidean distance. o Updating Centroids: Recalculate the centroid of each cluster by taking the mean of all data points assigned to that cluster. The centroid is the new center of the cluster. o Iterating Until Convergence: Steps 3 and 4 are repeated until the centroids no longer change significantly, indicating that the algorithm has converged.
  • 11.
    K-means o Objective Function:The objective of K-means is to minimize the sum of squared distances between data points and their respective cluster centroids. This can be formulated as: where:  is the number of clusters.  represents the i-th cluster.  x is a data point in cluster .  is the centroid of cluster . 𝐽=∑ 𝑖=1 𝑘 ∑ 𝑥∈𝐶𝑖 ¿|𝑥−𝜇𝑖|∨¿2 ¿
  • 12.
    K-means o Cluster AssignmentStep: Assign each data point to the cluster with the nearest centroid:  where is the cluster assignment for data point . o Centroid Update Step: Update the centroid of each cluster by calculating the mean of all data points assigned to that cluster:  where is the number of data points in cluster . ∣∣ 𝑐 𝑗=𝑎𝑟𝑔 min 𝑘 ¿|𝑥− 𝜇𝑖|∨¿2 ¿ 𝜇𝑖= 1 |𝐶𝑖| ∑ 𝑥𝑗 ∈𝐶 𝑗 𝑥 𝑗
  • 13.
    C-means 04 An algorithm thatassigns data points to clusters with varying degrees of membership, enhancing flexibility and precision in clustering. 9 0 7 3 5
  • 14.
    C-means Fuzzy C-Means (FCM)is an unsupervised learning algorithm that allows each data point to belong to multiple clusters with varying degrees of membership. This approach is particularly useful for analyzing complex and non-separable data. FCM clustering is a soft clustering approach, where each data point is assigned a likelihood or probability score belonging to that cluster.
  • 15.
    C-means 1. Initialization: o Determinethe number of clusters () and the fuzziness parameter (). o Initialize the membership matrix () with random values, where indicates the membership degree of data point ii in cluster . 2. Compute Cluster Centers: o Calculate the cluster centers using the following formula: o where is the data point i and is the total number of data points.
  • 16.
    C-means 3. Update MembershipMatrix: o Update the membership degrees using the following formula: 4. Check for Convergence: o If the change in the membership matrix is less than a specified threshold (e.g., ), the algorithm stops. ϵ Otherwise, go back to step 2.
  • 17.
  • 18.
  • 19.
  • 20.
    0 7 5 8 6 2 4 9 0 Fuzzy Clustering Application ImageSegmentation: o Medical Imaging: Helps in segmenting different tissues or detecting anomalies in medical images. o Satellite Imaging: Used in classifying land use and land cover from satellite images. Pattern Recognition: o Handwriting Recognition: Distinguishes between different styles of handwriting. o Voice Recognition: Classifies different voice patterns for speaker identification. Bioinformatics: o Gene Expression Data: Clusters gene expression data to identify patterns and understand gene functions. o Protein Structure Analysis: Groups similar protein structures for comparative analysis.
  • 21.
  • 22.
    Iris Dataset o Origin:The dataset was introduced by British biologist and statistician Ronald A. Fisher in his 1936 paper "The use of multiple measurements in taxonomic problems". o Content: It contains 150 samples from three species of iris flowers (Iris setosa, Iris versicolor, and Iris virginica). o Features: Each sample has four features: Sepal length (in centimeters) Sepal width (in centimeters) Petal length (in centimeters) Petal width (in centimeters) o Classes: There are three classes, each corresponding to one species of iris flower (50 samples per class).
  • 23.
  • 24.
  • 25.
  • 26.
    KFCM o FCM isnot robust in noisy images o Lack of local information of image pixels o Spatial penalty
  • 27.
  • 28.
    0 7 3 5 Pros and Cons Pros oGives best result for overlapped data set and comparatively better then k-means algorithm. o Unlike k-means where data point must exclusively belong to one cluster center here data point is assigned membership to each cluster center as a result of which data point may belong to more then one cluster center. Cons o Apriori specification of the number of clusters. o With lower value of β we get the better result but at the expense of more number of iteration. o Euclidean distance measures can unequally weight underlying factors. o The performance of the FCM algorithm depends on the selection of the initial cluster center and/or the initial membership value.
  • 29.
    ● J. C.Dunn (1973): 'A Fuzzy Relative of the ISODATA Process and Its Use in Detecting Compact Well-Separated Clusters', Journal of Cybernetics 3: 32-57 ● J. C. Bezdek (1981): 'Pattern Recognition with Fuzzy Objective Function Algorithms', Plenum Press, New York ● Tariq Rashid: 'Clustering' ● Hans-Joachim Mucha and Hizir Sofyan: 'Nonhierarchical Clustering' ● http://www.cs.bris.ac.uk/home/ir600/documentation/fuzzy_clustering_initial_report/node11. html ● http://www.quantlet.com/mdstat/scripts/sg/ssd/html/sgshiftclumei149.html References
  • 30.
    Thanks for yourattention!

Editor's Notes

  • #4  فازی کلاسترینگ که به آن خوشه‌بندی نرم نیز گفته می‌شود، یک روش برای گروه‌بندی داده‌هاست که به هر داده اجازه می‌دهد به‌جای تعلق کامل به یک خوشه خاص، به چندین خوشه با درجات مختلف تعلق داشته باشد. برخلاف خوشه‌بندی سنتی که در آن هر داده تنها به یک خوشه تعلق دارد، در این روش درجات تعلق هر داده به خوشه‌ها محاسبه می‌شود. هر داده یک مجموعه درجه عضویت به خوشه‌های مختلف دارد که این درجات به طور کلی نشان‌دهنده احتمال یا میزان تعلق آن داده به هر خوشه هستند. مجموع این درجات عضویت برای هر داده همیشه برابر با ۱ است. فازی کلاسترینگ یک روش یادگیری بدون نظارت است، به این معنا که برای گروه‌بندی داده‌ها نیازی به برچسب‌های پیش‌فرض یا اطلاعات اولیه در مورد گروه‌ها نیست. این روش به طور خودکار داده‌ها را براساس ویژگی‌هایشان خوشه‌بندی می‌کند. از مزایای این روش می‌توان به انعطاف‌پذیری در تقسیم‌بندی داده‌ها، امکان تخصیص یک داده به چند خوشه و کارایی آن در شرایطی که مرزهای بین خوشه‌ها به‌وضوح مشخص نیستند، اشاره کرد. این ویژگی‌ها به تحلیل دقیق‌تر داده‌ها و مدیریت بهتر عدم قطعیت و هم‌پوشانی میان خوشه‌ها کمک می‌کند.
  • #7 فازی کلاسترینگ یا خوشه‌بندی فازی روشی در یادگیری ماشینی و تحلیل داده است که به ما کمک می‌کند الگوهای موجود در داده‌ها را شناسایی کنیم. این روش برای موقعیت‌هایی که داده‌ها به‌طور واضح قابل تفکیک نیستند، بسیار مفید است. برخلاف روش‌های سنتی خوشه‌بندی که هر داده را به یک خوشه خاص اختصاص می‌دهند، خوشه‌بندی فازی امکان می‌دهد که هر داده با درجات متفاوتی به چندین خوشه تعلق داشته باشد. یکی از مزایای اصلی این روش افزایش دقت در تحلیل داده‌ها است. چون یک داده می‌تواند به چندین خوشه مرتبط باشد، اطلاعات بیشتری درباره ارتباطات و شباهت‌های بین داده‌ها به دست می‌آید که به بهبود نتایج مدل‌های تحلیلی کمک می‌کند. همچنین، این رویکرد باعث کاهش پیچیدگی مدل‌های پیش‌بینی می‌شود. با اطلاعات دقیق‌تری که خوشه‌بندی فازی ارائه می‌دهد، می‌توان مدل‌هایی طراحی کرد که بهتر روابط بین داده‌ها را نشان دهند و درعین‌حال ساده‌تر باشند. انعطاف‌پذیری نیز یکی دیگر از ویژگی‌های برجسته این روش است. با توجه به اینکه داده‌ها می‌توانند به چندین خوشه تعلق داشته باشند، تحلیل‌گران می‌توانند از این قابلیت برای تحلیل داده‌هایی که دارای ساختار پیچیده یا روابط چندگانه هستند، بهره ببرند. این انعطاف‌پذیری خوشه‌بندی فازی را به ابزاری مناسب برای تحلیل داده‌های دنیای واقعی تبدیل کرده است، جایی که داده‌ها اغلب مبهم یا دارای مرزهای مشخصی نیستند.
  • #10 انتخاب تعداد خوشه ها (K): در مورد تعداد خوشه ها، K، برای پارتیشن بندی داده ها تصمیم بگیرید. این معمولا بر اساس دانش قبلی یا با استفاده از روش هایی مانند روش آرنج است. راه اندازی Centroids: به طور تصادفی K نقطه داده را از مجموعه داده به عنوان مرکز خوشه اولیه انتخاب کنید. تخصیص نقاط داده به خوشه ها: هر نقطه داده به نزدیکترین مرکز تخصیص داده می شود و خوشه های K را تشکیل می دهد. متریک فاصله ای که معمولا استفاده می شود فاصله اقلیدسی است. به روز رسانی Centroids: با در نظر گرفتن میانگین تمام نقاط داده اختصاص داده شده به آن خوشه، مرکز هر خوشه را دوباره محاسبه کنید. مرکز جدید مرکز جدید خوشه است. تکرار تا همگرایی: مراحل 3 و 4 تکرار می شوند تا زمانی که مرکزها دیگر تغییر قابل توجهی نداشته باشند، که نشان می دهد الگوریتم همگرا شده است.
  • #11 هدف K-means به حداقل رساندن مجموع فواصل مجذور بین نقاط داده و مرکز خوشه مربوطه آنها است. این را می توان به صورت زیر فرموله کرد: 𝐾 تعداد خوشه هاست. 𝐶_𝑖 نشان دهنده خوشه i است. x یک نقطه داده در خوشه 𝐶_𝑖 است. 𝜇_𝑖 مرکز خوشه 𝐶_𝑖 است.
  • #15 1. مقداردهی اولیه: تعداد خوشه ها (𝐶) و پارامتر فازی (𝑚) را تعیین کنید. ماتریس عضویت (𝑈_𝑖𝑗) را با مقادیر تصادفی راه اندازی کنید، جایی که 𝑈_𝑖𝑗 درجه عضویت نقطه داده ii را در خوشه 𝑗 نشان می دهد. 2. محاسبه مراکز خوشه ای: مراکز خوشه را با استفاده از فرمول زیر محاسبه کنید:
  • #22 منشأ: این مجموعه داده توسط زیست شناس و آماردان بریتانیایی رونالد فیشر در مقاله خود در سال 1936 با عنوان "استفاده از اندازه گیری های چندگانه در مسائل طبقه بندی" معرفی شد. محتوا: شامل 150 نمونه از سه گونه گل زنبق (Iris setosa، Iris versicolor و Iris virginica) است. ویژگی ها: هر نمونه دارای چهار ویژگی است: طول کاسبرگ (به سانتی متر) عرض کاسبرگ (به سانتی متر) طول گلبرگ (به سانتی متر) عرض گلبرگ (به سانتی متر) طبقات: سه کلاس وجود دارد که هر کدام مربوط به یک گونه از گل زنبق است (50 نمونه در هر کلاس).