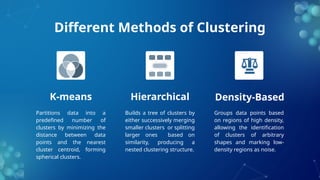
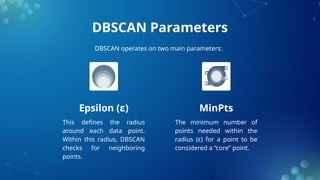
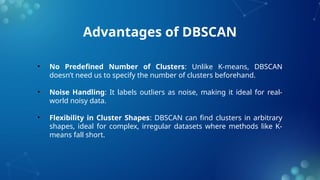
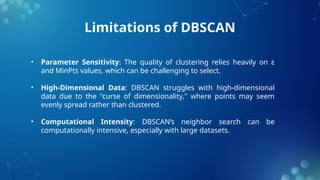
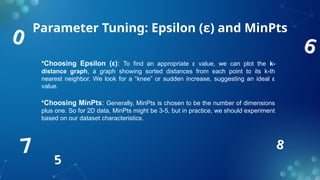
9
0
7
3
5
1
2
4
Density-Based
Spatial Clustering
(DBSCAN)
An Introduction to Density-Based Clustering Algorithm
for Data Mining and Pattern Recognition
Table of contents
01
03
02
04
Introduction
to Clustering
What is
DBSCAN?
Visual
Representation
of DBSCAN
Applications of
DBSCAN
Introduction to Clustering
01
Briefly define clustering as an unsupervised learning
technique that groups data points based on similarity.
9
0
7
3
5
Introduction to Clustering
Clustering is a core part of unsupervised machine learning, where we
organize data points into meaningful groups based on their
characteristics. Clustering doesn’t use predefined labels, so it helps us
discover natural groupings.
Applications are vast, from customer segmentation to geospatial
analysis, image processing, and anomaly detection.
Different Methods of Clustering
Partitions data into a
predefined number of
clusters by minimizing the
distance between data
points and the nearest
cluster centroid, forming
spherical clusters.
Builds a tree of clusters by
either successively merging
smaller clusters or splitting
larger ones based on
similarity, producing a
nested clustering structure.
Groups data points based
on regions of high density,
allowing the identification
of clusters of arbitrary
shapes and marking low-
density regions as noise.
K-means Hierarchical Density-Based
What is
DBSCAN?
DBSCAN stands for Density-Based Spatial Clustering
of Applications with Noise. Unlike other methods, it
can identify clusters of arbitrary shapes, handling noise
in the data effectively. DBSCAN doesn't need us to
specify the number of clusters up front, making it
adaptable to complex datasets. It uses the concept of
data density to identify clusters, labeling low-density
points as noise or outliers.
0
7
5
8
6
DBSCAN Parameters
The minimum number of
points needed within the
radius (ε) for a point to be
considered a “core” point.
This defines the radius
around each data point.
Within this radius, DBSCAN
checks for neighboring
points.
Epsilon (ε) MinPts
DBSCAN operates on two main parameters:
Different Label of Points
There are also three types of points in DBSCAN:
Core Point Border Point Noise Point
Has at least MinPts
neighbors within ε.
Lies within ε of a core
point but has fewer
than MinPts neighbors.
A point that is not
within ε of any core
point, considered an
outlier.
How DBSCAN Works: The Steps
DBSCAN starts by checking each point to see
if it has at least MinPts neighbors within the ε
radius. If so, it’s a core point.
1. Identify Core
Points
Core points with overlapping neighborhoods
connect to form clusters.
2. Cluster Core
Points
Each core point connects with others to
expand clusters, incorporating neighboring
points.
3. Expand Clusters
Points that don’t connect with any core points
are labeled as noise.
4. Label Noise
0
7
5
8
6
2
4
9
0
Visual
Representation of
DBSCAN
https://www.naftaliharris.com/blog/visualizing-dbscan-clusterin
g/
Advantages of DBSCAN
• No Predefined Number of Clusters: Unlike K-means, DBSCAN
doesn’t need us to specify the number of clusters beforehand.
• Noise Handling: It labels outliers as noise, making it ideal for real-
world noisy data.
• Flexibility in Cluster Shapes: DBSCAN can find clusters in arbitrary
shapes, ideal for complex, irregular datasets where methods like K-
means fall short.
Limitations of DBSCAN
• Parameter Sensitivity: The quality of clustering relies heavily on ε
and MinPts values, which can be challenging to select.
• High-Dimensional Data: DBSCAN struggles with high-dimensional
data due to the "curse of dimensionality," where points may seem
evenly spread rather than clustered.
• Computational Intensity: DBSCAN’s neighbor search can be
computationally intensive, especially with large datasets.
0
7
5
8
6
Parameter Tuning: Epsilon (ε) and MinPts
•Choosing Epsilon (ε): To find an appropriate ε value, we can plot the k-
distance graph, a graph showing sorted distances from each point to its k-th
nearest neighbor. We look for a “knee” or sudden increase, suggesting an ideal ε
value.
•Choosing MinPts: Generally, MinPts is chosen to be the number of dimensions
plus one. So for 2D data, MinPts might be 3-5, but in practice, we should experiment
based on our dataset characteristics.
Applications of
DBSCAN
04
9
0
7
3
5
•Geospatial Data Analysis: Identifying high-density areas like urban centers or
areas of interest based on GPS data.
•Image Processing: Separating objects in images.
•Anomaly Detection: Detecting unusual points in datasets, like fraud in financial
data.
•Customer Segmentation: Grouping customers based on purchasing behavior for
targeted marketing strategies.
DBSCAN vs. Other Clustering Methods
1. DBSCAN vs. K-means: Unlike K-means, DBSCAN doesn’t require specifying
the number of clusters. It handles noise well and finds non-spherical clusters,
whereas K-means is limited to circular clusters.
2. DBSCAN vs. Hierarchical Clustering: Hierarchical clustering can struggle with
large datasets and isn’t noise-aware, while DBSCAN is scalable and better at
handling outliers.
0
7
5
8
6
2
4
9
0
Summary
• Clusters based on data density, not shape, handling
noise effectively.
• Requires tuning of ε and MinPts, which are crucial for
effective clustering.
• Is widely used in real-world applications where data
may have noise or require identifying clusters of
irregular shapes.
Q&A
Thank you for your attention! I hope this overview has given you a solid
understanding of DBSCAN and its applications. I’d be happy to answer any
questions you may have.

Density-Based Spatial Clustering of Applications with Noise (DBSCAN)

  • 1.
    9 0 7 3 5 1 2 4 Density-Based Spatial Clustering (DBSCAN) An Introductionto Density-Based Clustering Algorithm for Data Mining and Pattern Recognition
  • 2.
    Table of contents 01 03 02 04 Introduction toClustering What is DBSCAN? Visual Representation of DBSCAN Applications of DBSCAN
  • 3.
    Introduction to Clustering 01 Brieflydefine clustering as an unsupervised learning technique that groups data points based on similarity. 9 0 7 3 5
  • 4.
    Introduction to Clustering Clusteringis a core part of unsupervised machine learning, where we organize data points into meaningful groups based on their characteristics. Clustering doesn’t use predefined labels, so it helps us discover natural groupings. Applications are vast, from customer segmentation to geospatial analysis, image processing, and anomaly detection.
  • 5.
    Different Methods ofClustering Partitions data into a predefined number of clusters by minimizing the distance between data points and the nearest cluster centroid, forming spherical clusters. Builds a tree of clusters by either successively merging smaller clusters or splitting larger ones based on similarity, producing a nested clustering structure. Groups data points based on regions of high density, allowing the identification of clusters of arbitrary shapes and marking low- density regions as noise. K-means Hierarchical Density-Based
  • 6.
    What is DBSCAN? DBSCAN standsfor Density-Based Spatial Clustering of Applications with Noise. Unlike other methods, it can identify clusters of arbitrary shapes, handling noise in the data effectively. DBSCAN doesn't need us to specify the number of clusters up front, making it adaptable to complex datasets. It uses the concept of data density to identify clusters, labeling low-density points as noise or outliers. 0 7 5 8 6
  • 7.
    DBSCAN Parameters The minimumnumber of points needed within the radius (ε) for a point to be considered a “core” point. This defines the radius around each data point. Within this radius, DBSCAN checks for neighboring points. Epsilon (ε) MinPts DBSCAN operates on two main parameters:
  • 8.
    Different Label ofPoints There are also three types of points in DBSCAN: Core Point Border Point Noise Point Has at least MinPts neighbors within ε. Lies within ε of a core point but has fewer than MinPts neighbors. A point that is not within ε of any core point, considered an outlier.
  • 9.
    How DBSCAN Works:The Steps DBSCAN starts by checking each point to see if it has at least MinPts neighbors within the ε radius. If so, it’s a core point. 1. Identify Core Points Core points with overlapping neighborhoods connect to form clusters. 2. Cluster Core Points Each core point connects with others to expand clusters, incorporating neighboring points. 3. Expand Clusters Points that don’t connect with any core points are labeled as noise. 4. Label Noise
  • 10.
  • 11.
  • 12.
    Advantages of DBSCAN •No Predefined Number of Clusters: Unlike K-means, DBSCAN doesn’t need us to specify the number of clusters beforehand. • Noise Handling: It labels outliers as noise, making it ideal for real- world noisy data. • Flexibility in Cluster Shapes: DBSCAN can find clusters in arbitrary shapes, ideal for complex, irregular datasets where methods like K- means fall short.
  • 13.
    Limitations of DBSCAN •Parameter Sensitivity: The quality of clustering relies heavily on ε and MinPts values, which can be challenging to select. • High-Dimensional Data: DBSCAN struggles with high-dimensional data due to the "curse of dimensionality," where points may seem evenly spread rather than clustered. • Computational Intensity: DBSCAN’s neighbor search can be computationally intensive, especially with large datasets.
  • 14.
    0 7 5 8 6 Parameter Tuning: Epsilon(ε) and MinPts •Choosing Epsilon (ε): To find an appropriate ε value, we can plot the k- distance graph, a graph showing sorted distances from each point to its k-th nearest neighbor. We look for a “knee” or sudden increase, suggesting an ideal ε value. •Choosing MinPts: Generally, MinPts is chosen to be the number of dimensions plus one. So for 2D data, MinPts might be 3-5, but in practice, we should experiment based on our dataset characteristics.
  • 15.
  • 16.
    •Geospatial Data Analysis:Identifying high-density areas like urban centers or areas of interest based on GPS data. •Image Processing: Separating objects in images. •Anomaly Detection: Detecting unusual points in datasets, like fraud in financial data. •Customer Segmentation: Grouping customers based on purchasing behavior for targeted marketing strategies.
  • 17.
    DBSCAN vs. OtherClustering Methods 1. DBSCAN vs. K-means: Unlike K-means, DBSCAN doesn’t require specifying the number of clusters. It handles noise well and finds non-spherical clusters, whereas K-means is limited to circular clusters. 2. DBSCAN vs. Hierarchical Clustering: Hierarchical clustering can struggle with large datasets and isn’t noise-aware, while DBSCAN is scalable and better at handling outliers.
  • 18.
    0 7 5 8 6 2 4 9 0 Summary • Clusters basedon data density, not shape, handling noise effectively. • Requires tuning of ε and MinPts, which are crucial for effective clustering. • Is widely used in real-world applications where data may have noise or require identifying clusters of irregular shapes.
  • 19.
    Q&A Thank you foryour attention! I hope this overview has given you a solid understanding of DBSCAN and its applications. I’d be happy to answer any questions you may have.