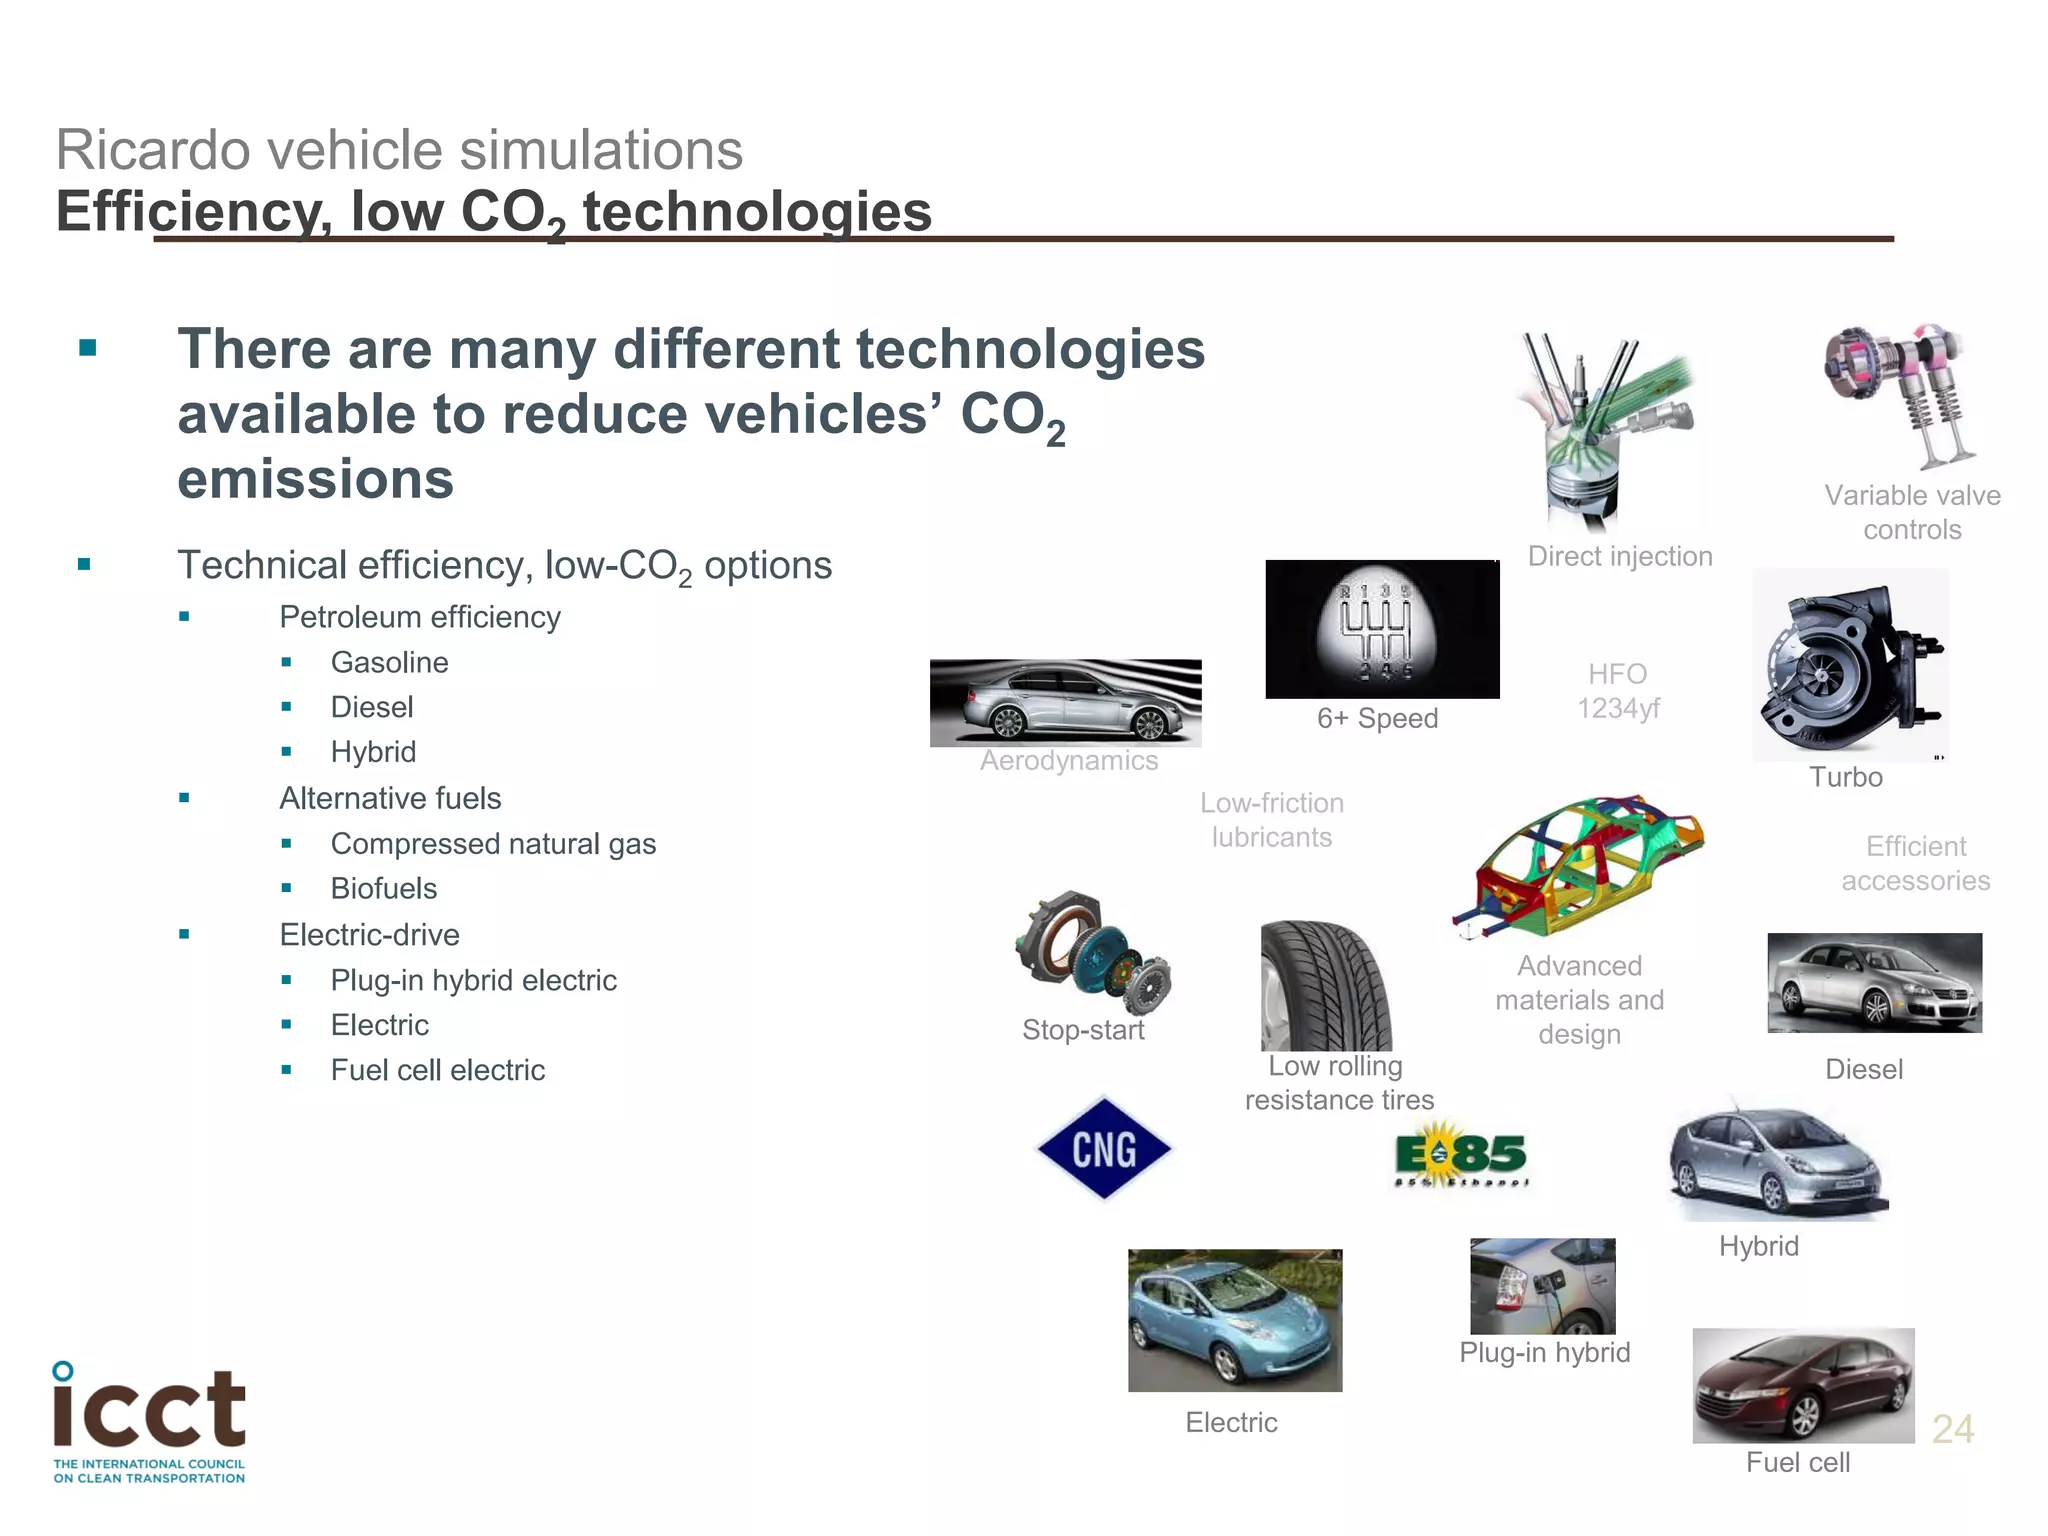
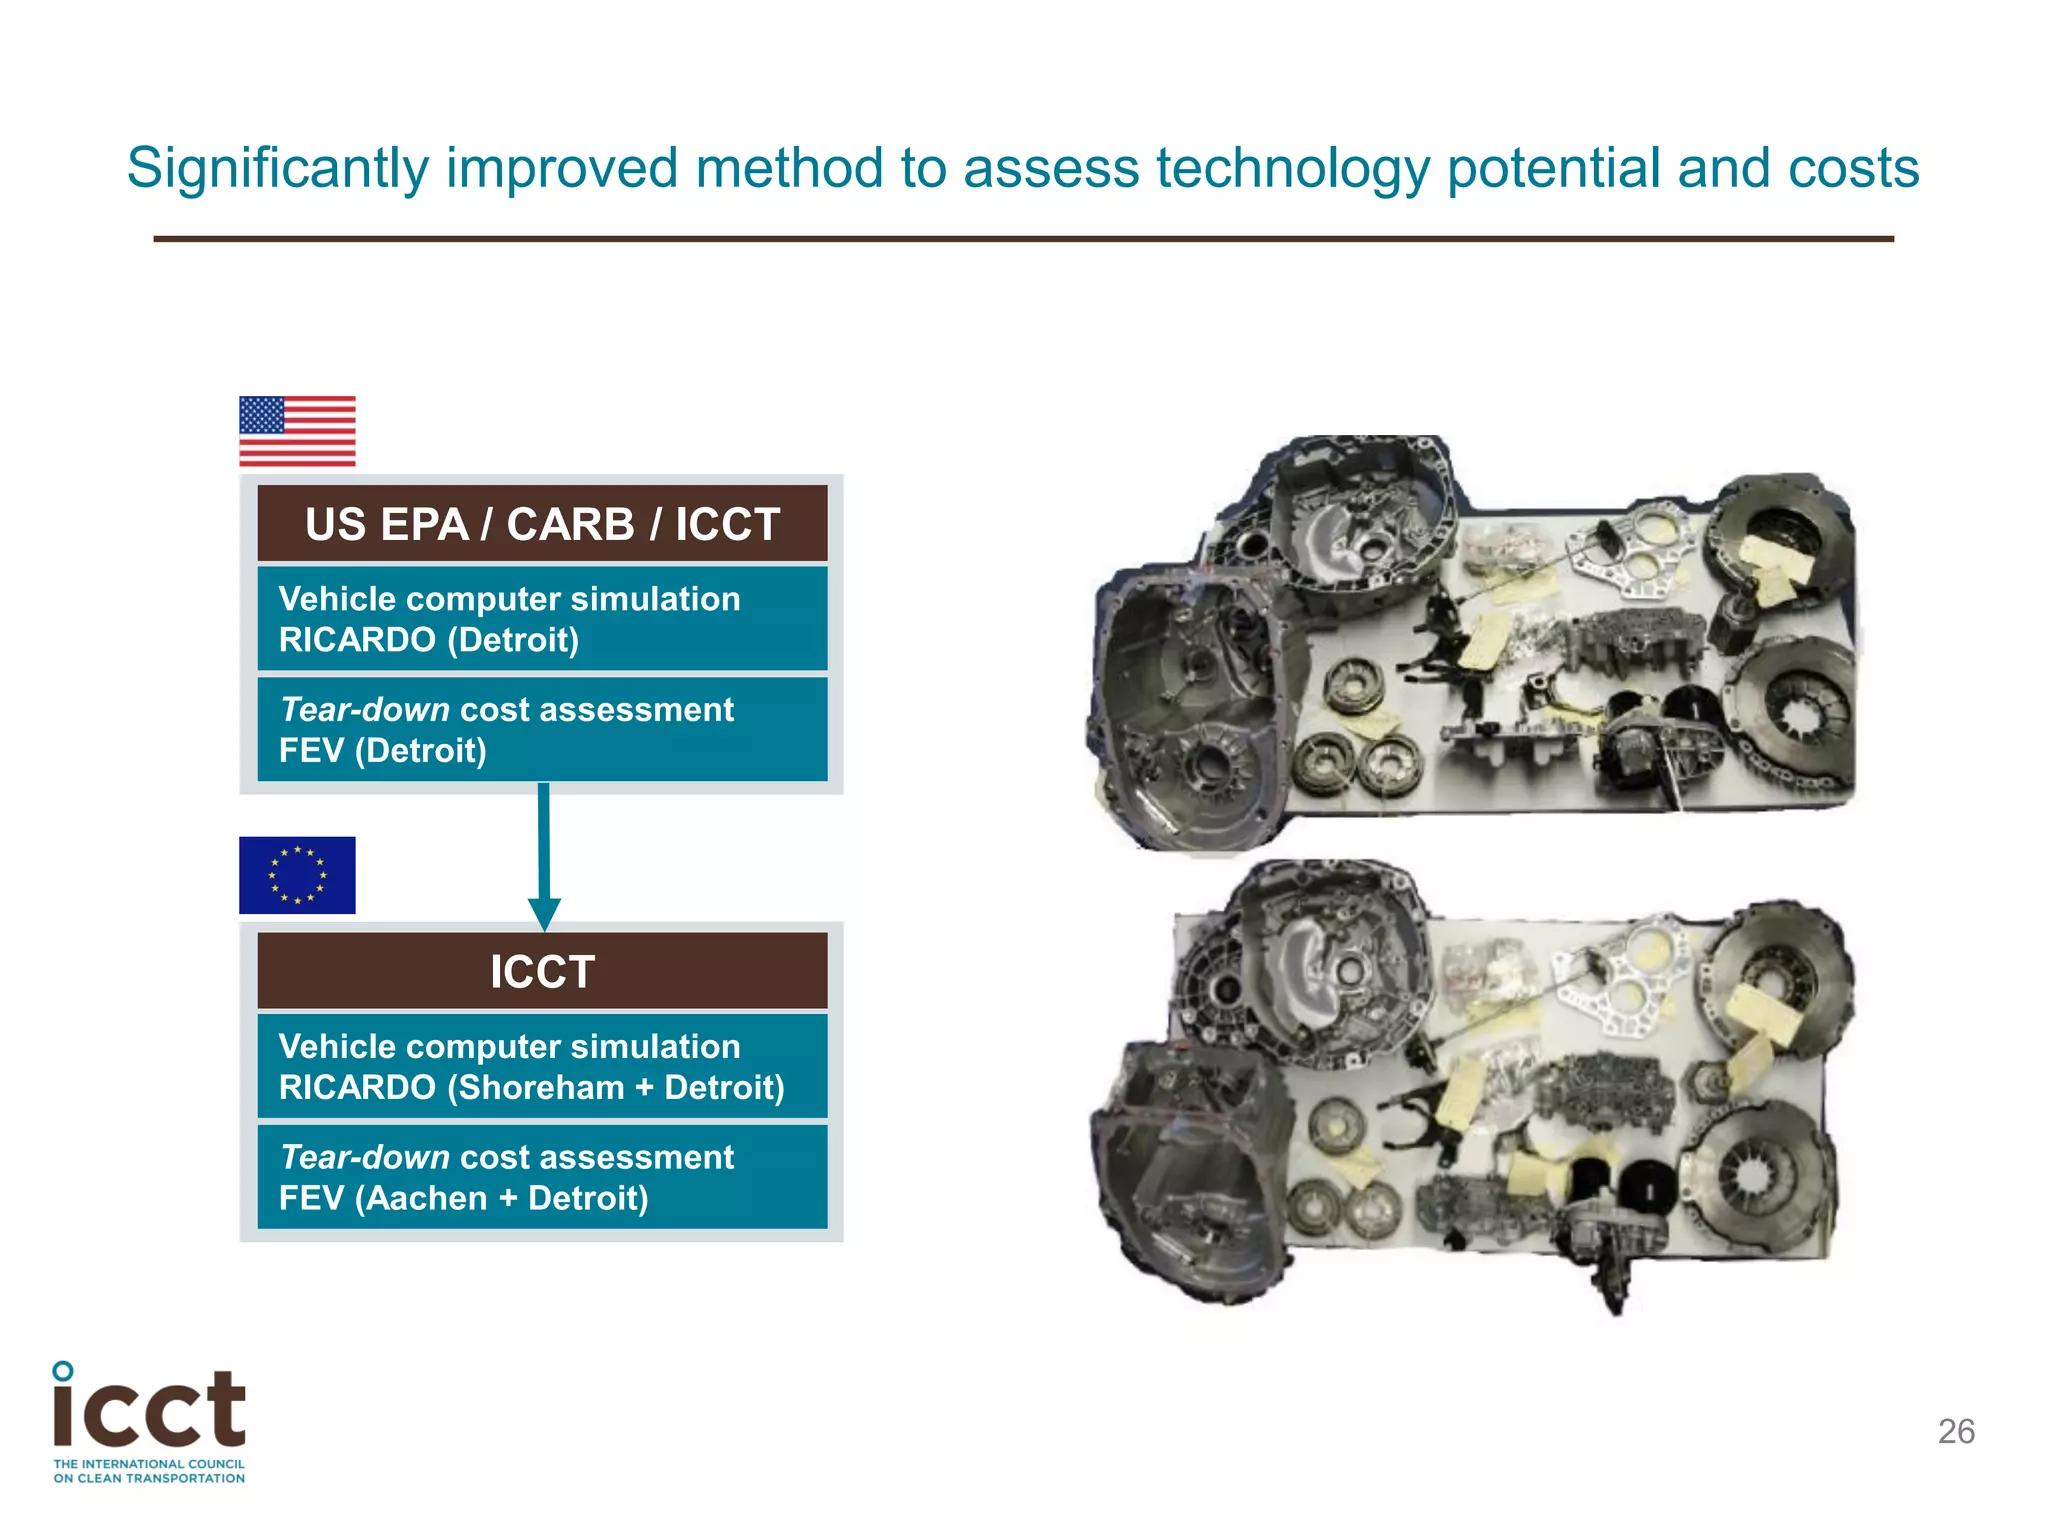
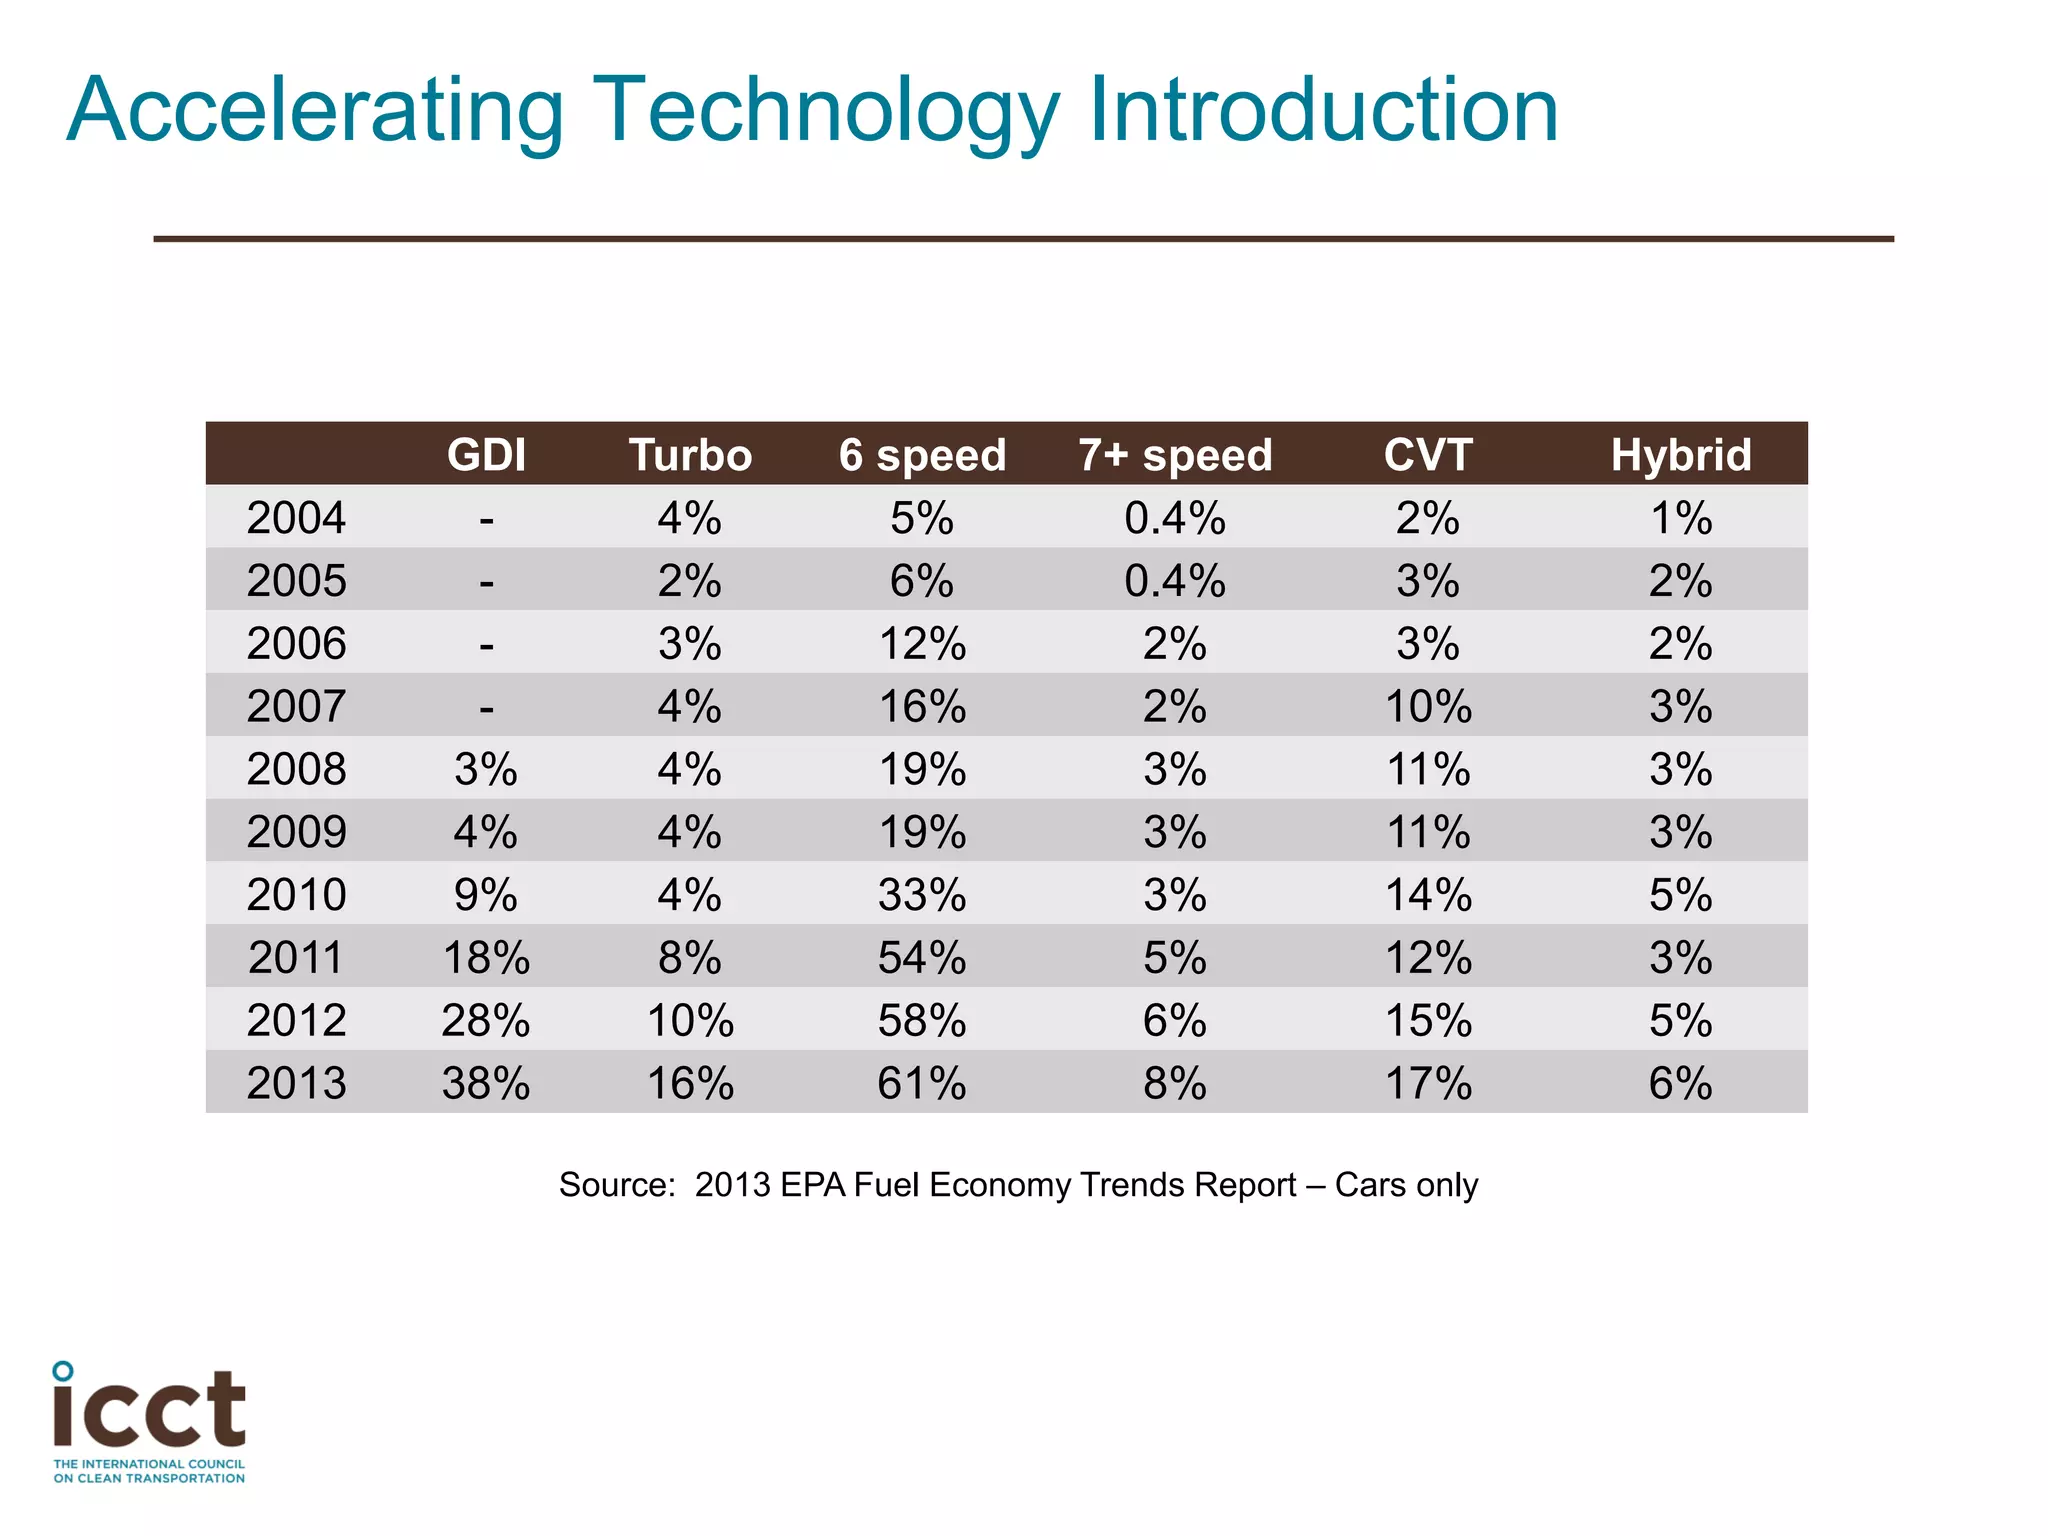
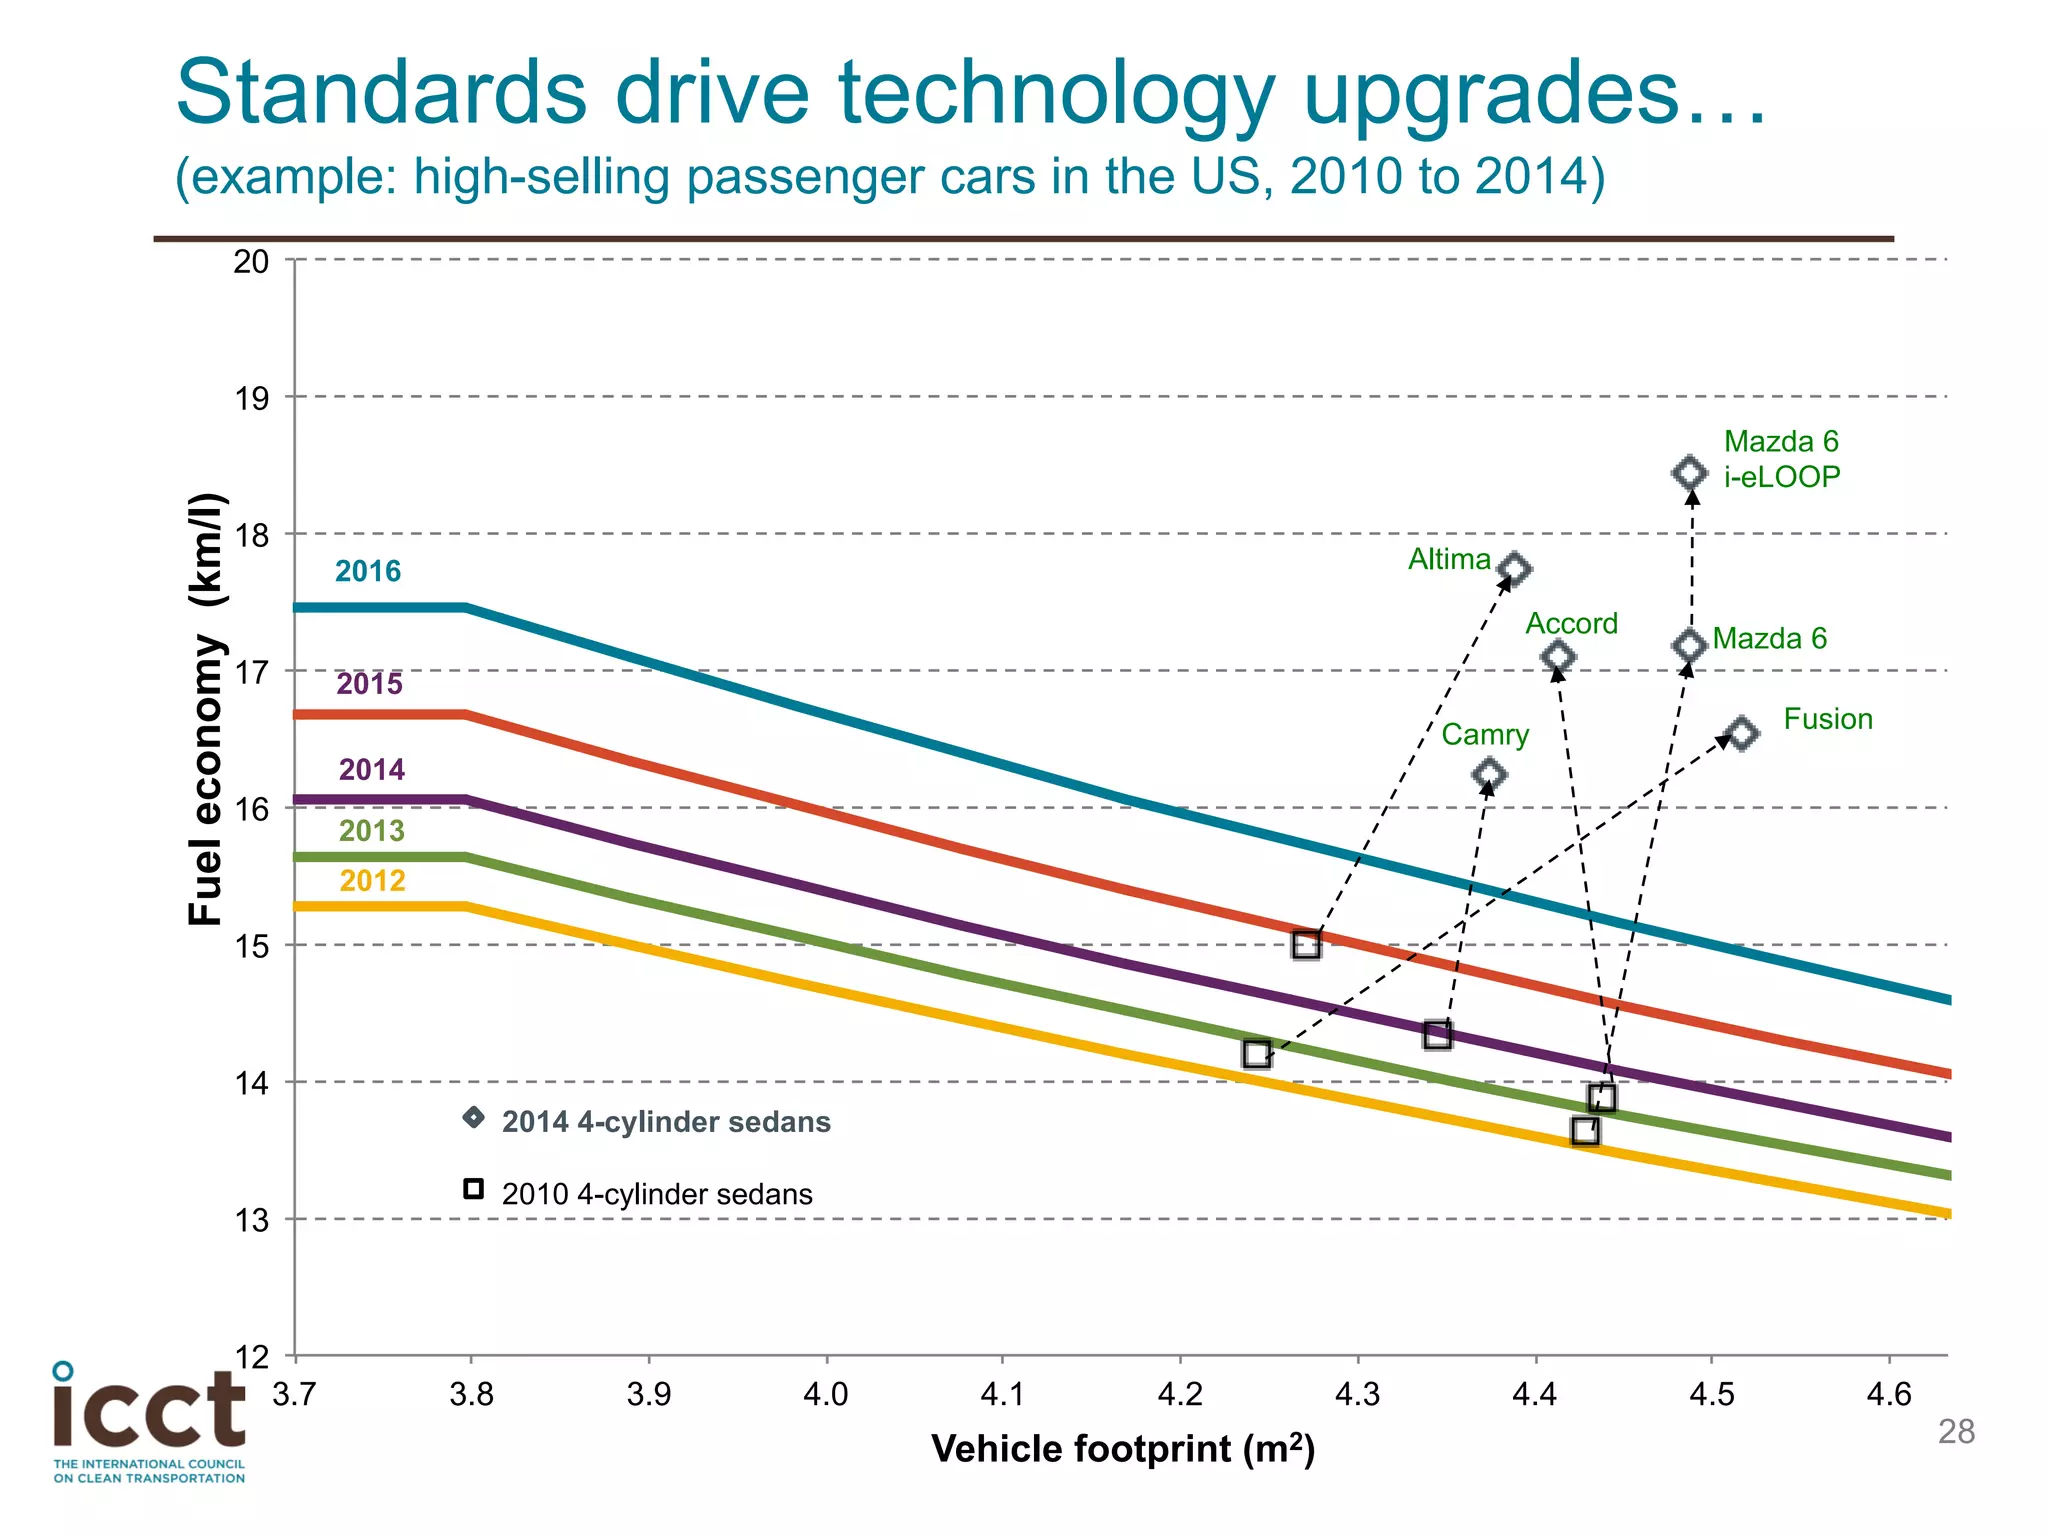
Download as PDF, PPTX

![NOX emission factors [mg/km]
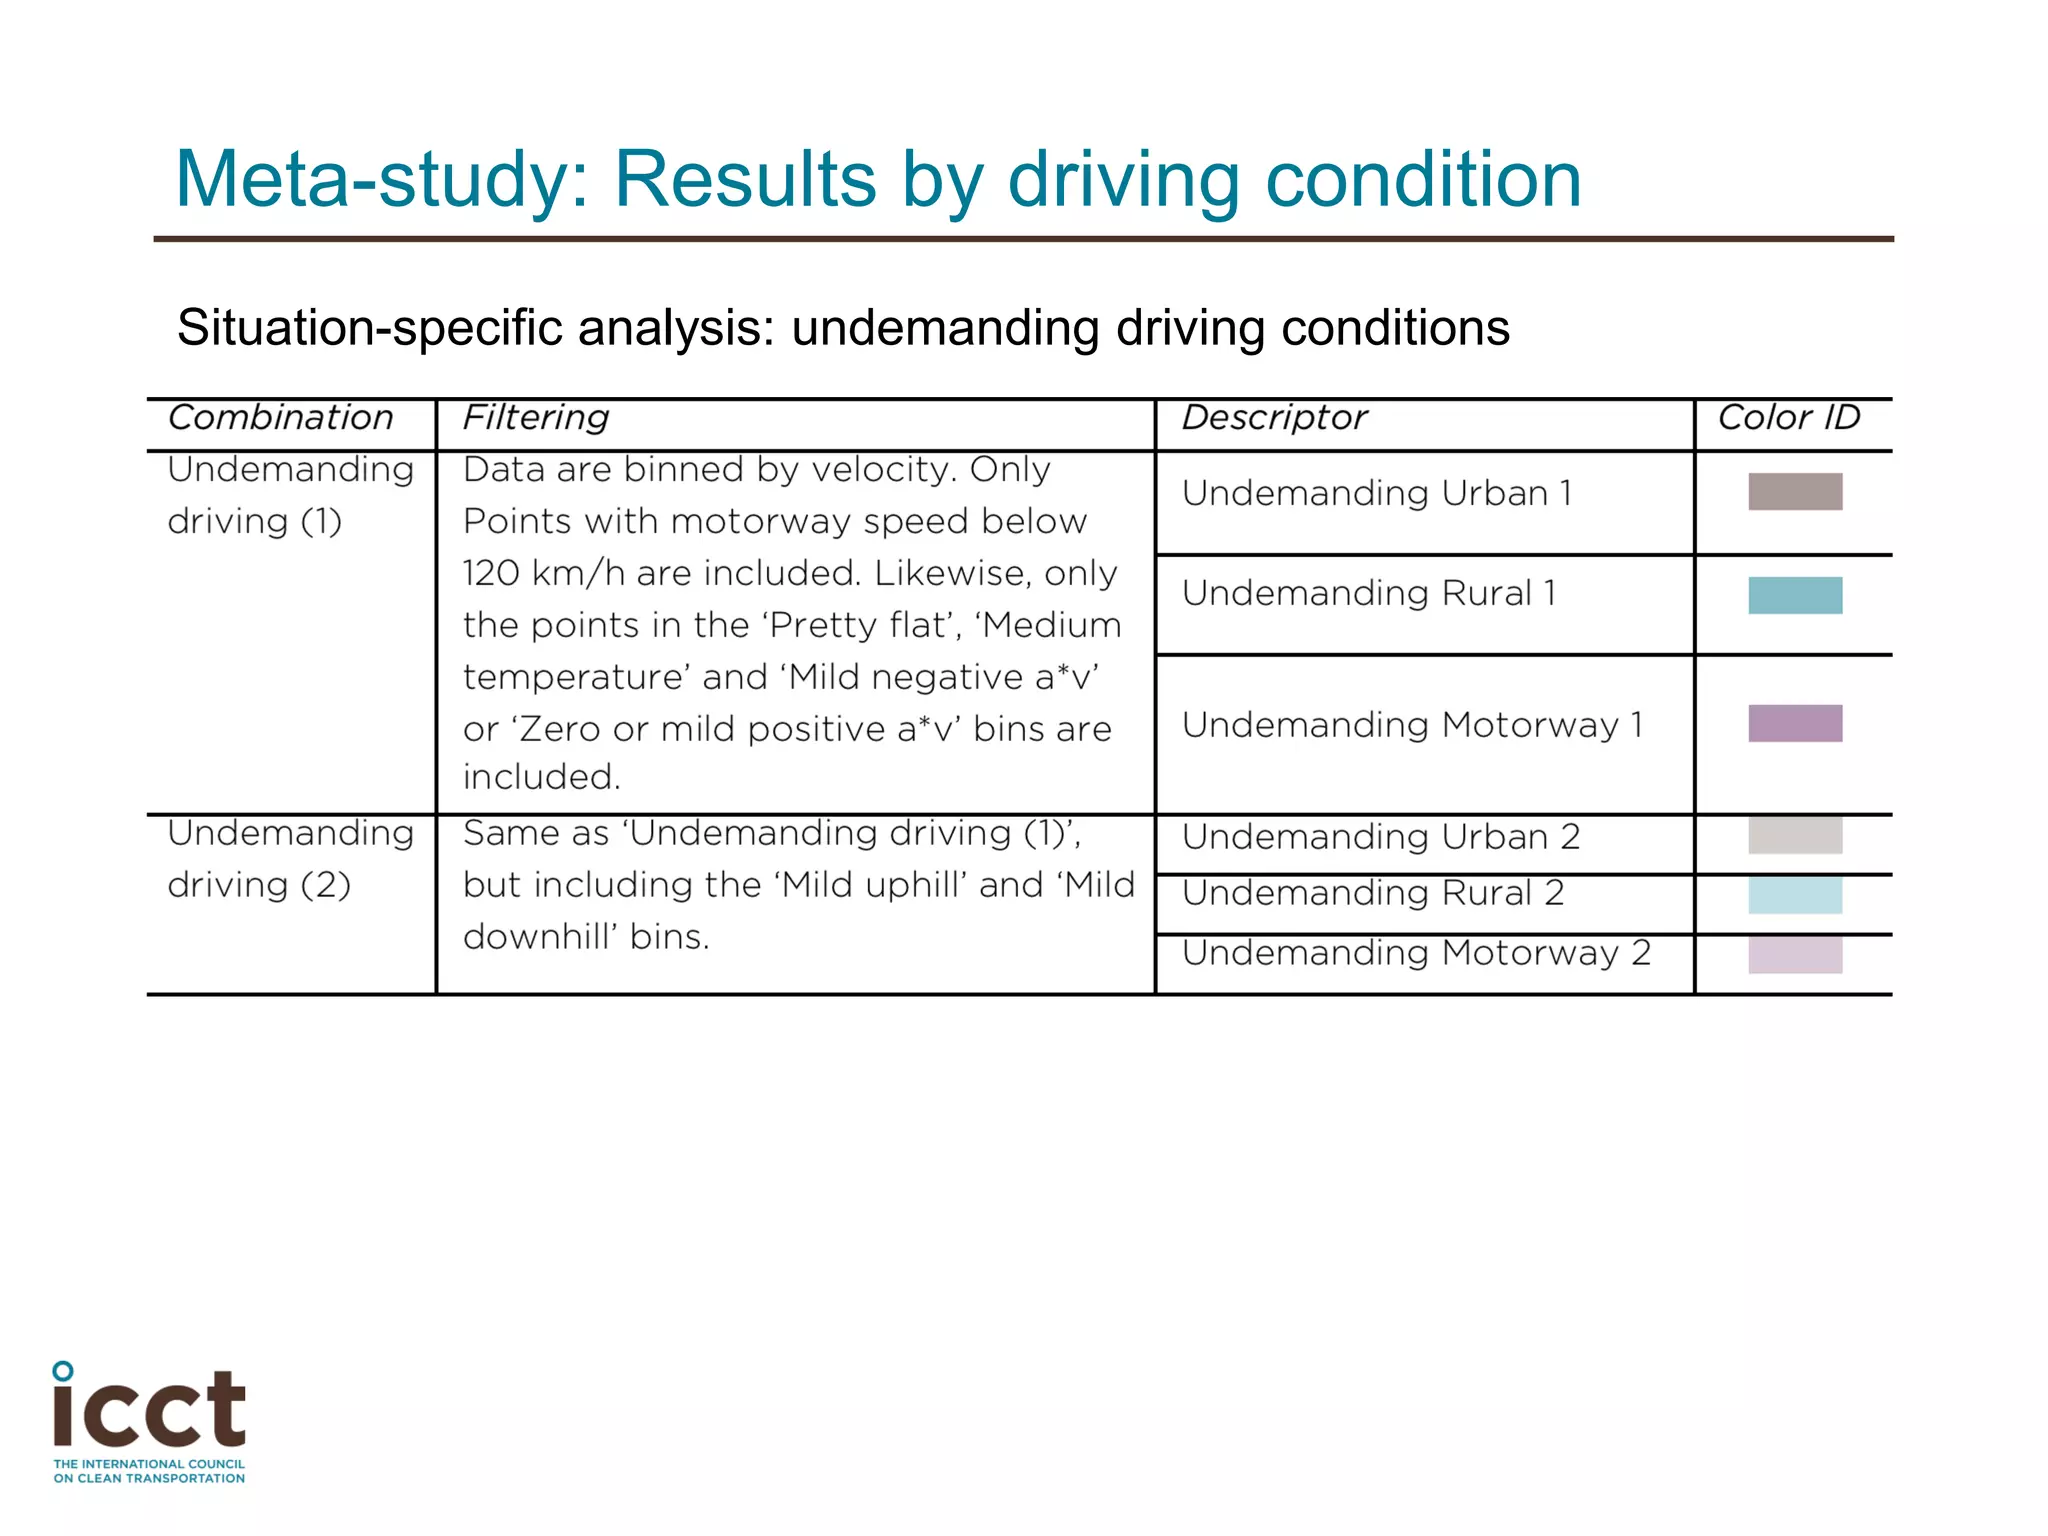
Meta-study: Results by driving condition](https://image.slidesharecdn.com/francovicentepresentation-150320074528-conversion-gate01/75/Regulatory-Outlook-for-real-world-emissions-ICCT-13-2048.jpg)

![0
500
1000
1500
2000
2500
3000
-60%-50%-40%-30%-20%-10%0%
Additionaldirectmanufacturingcosts[EUR]
relativeto2010baseline
95g/km
corresponding
fleet targets
90g/km
80g/km
70g/km
60g/km
Ford Focus2010
159 g/km
2012
109 g/km
-31%
2010
164 g/km
2012
79 g/km
(hybrid)
-52%
Toyota Yaris
2020
CO2 / fuel consumption
relative to 2010 baseline
95 g/km in 2020:
Fuel cost savings: ≈350-450 € / year [BEUC, 2012]
Avoided oil imports: ≈160 million tons 2020-2030 [EC, 2012]
Reduction in CO2: ≈420 million tons 2020-2030 [EC, 2012]
Investment in technology: <1000 € / vehicle [ICCT, 2013]](https://image.slidesharecdn.com/francovicentepresentation-150320074528-conversion-gate01/75/Regulatory-Outlook-for-real-world-emissions-ICCT-25-2048.jpg)


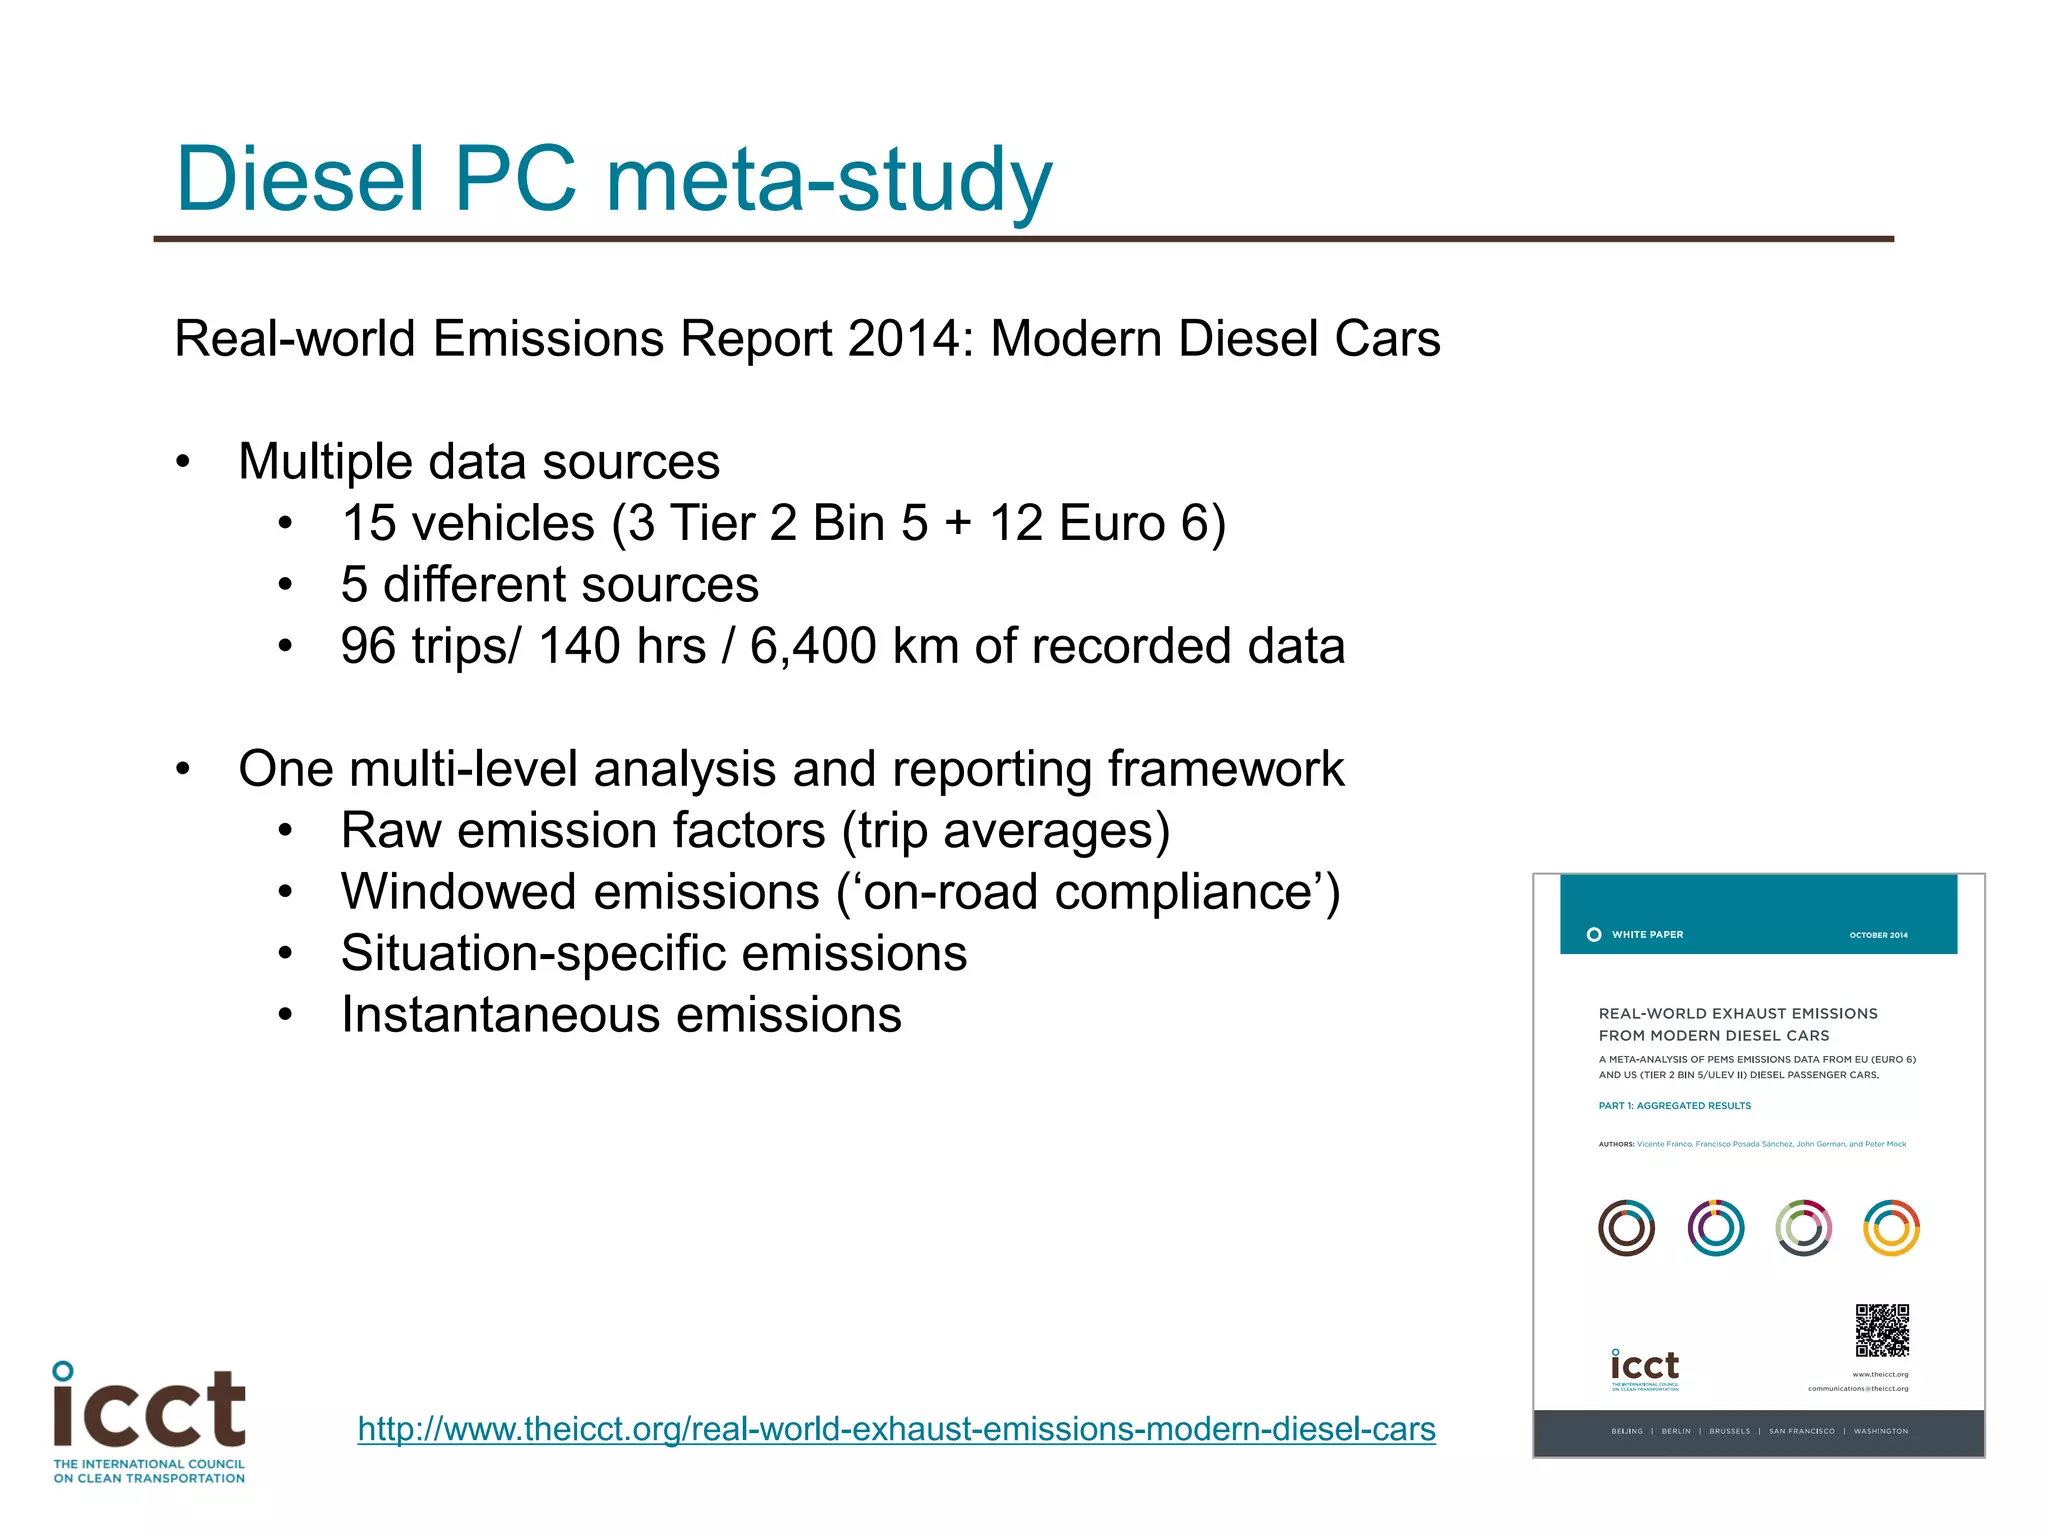
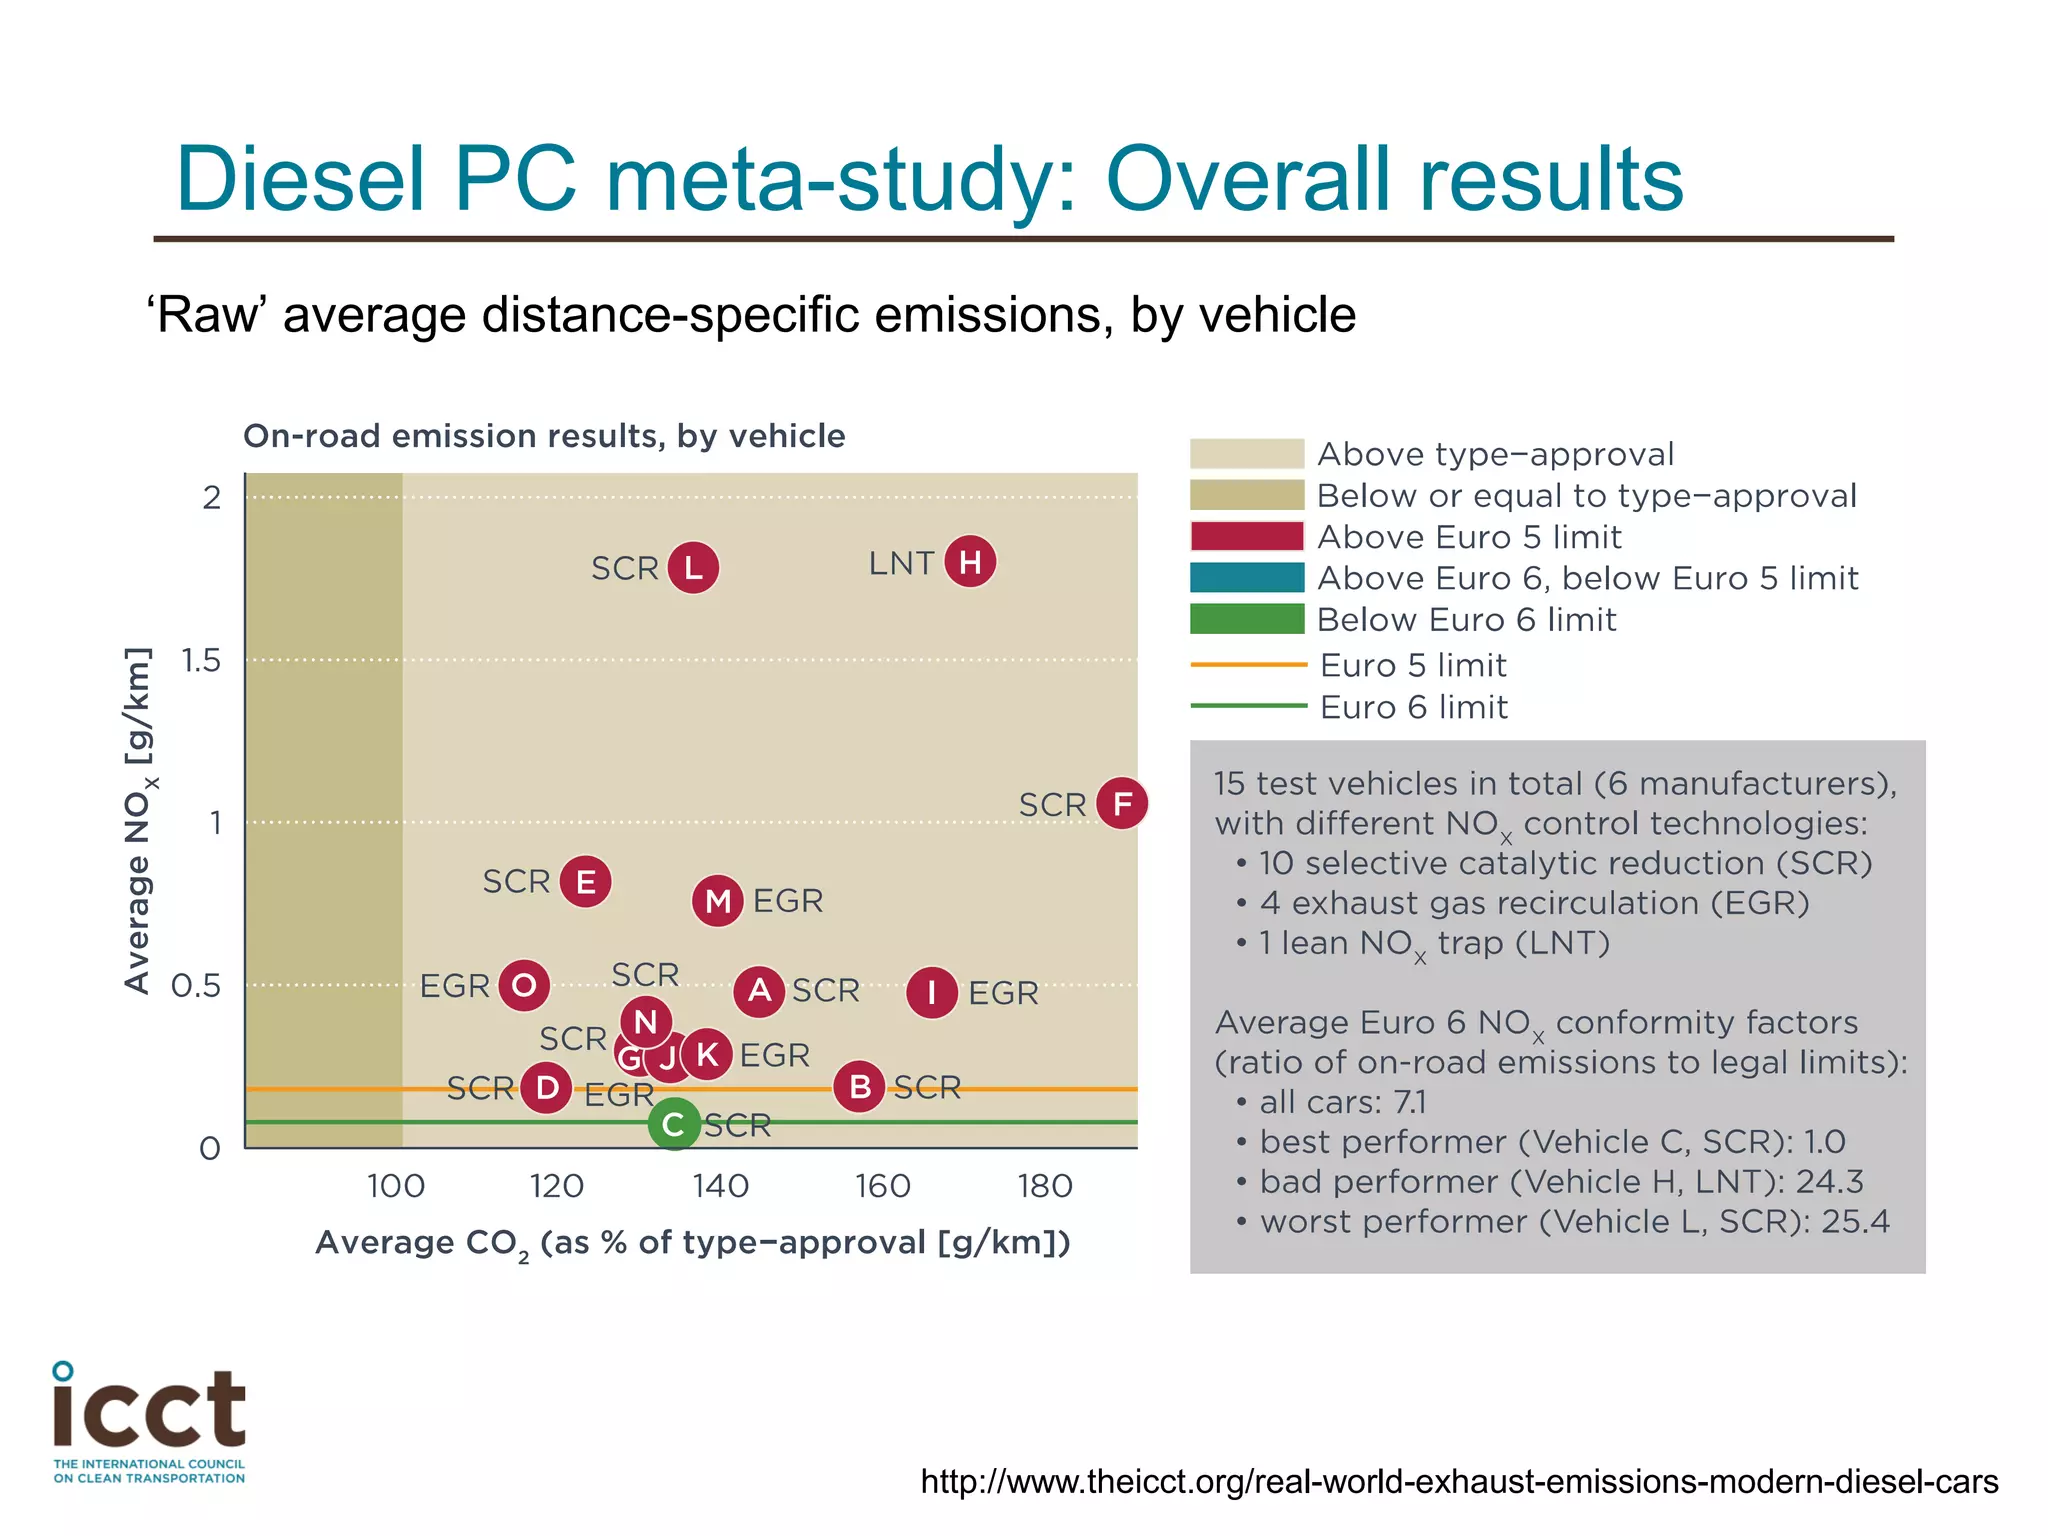
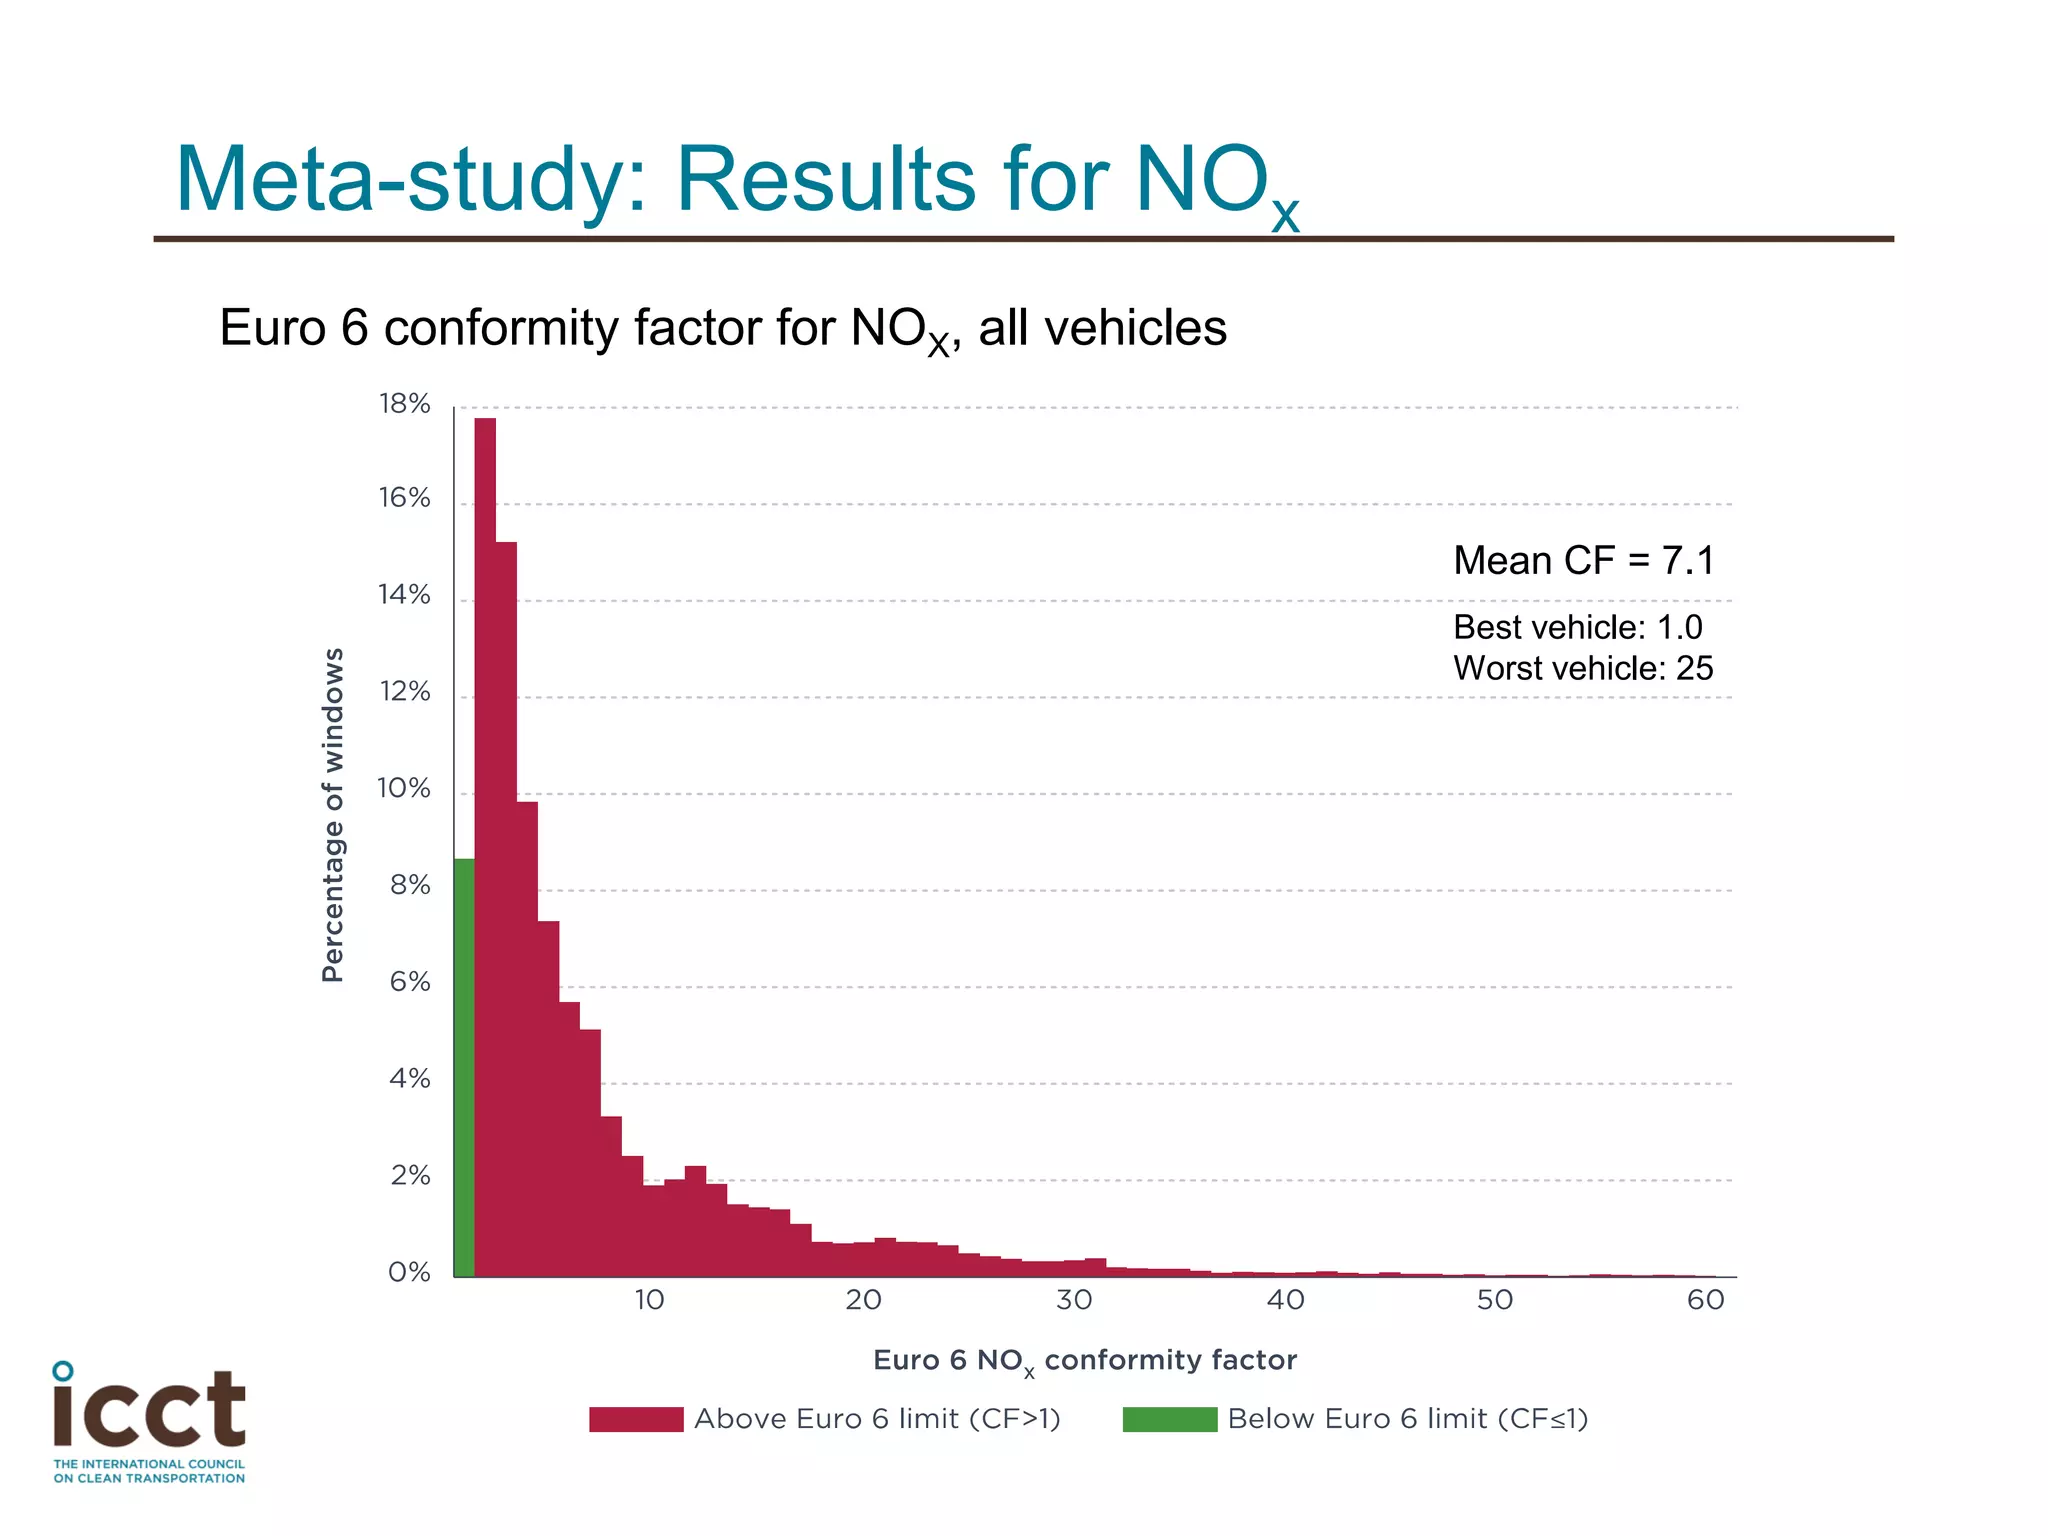
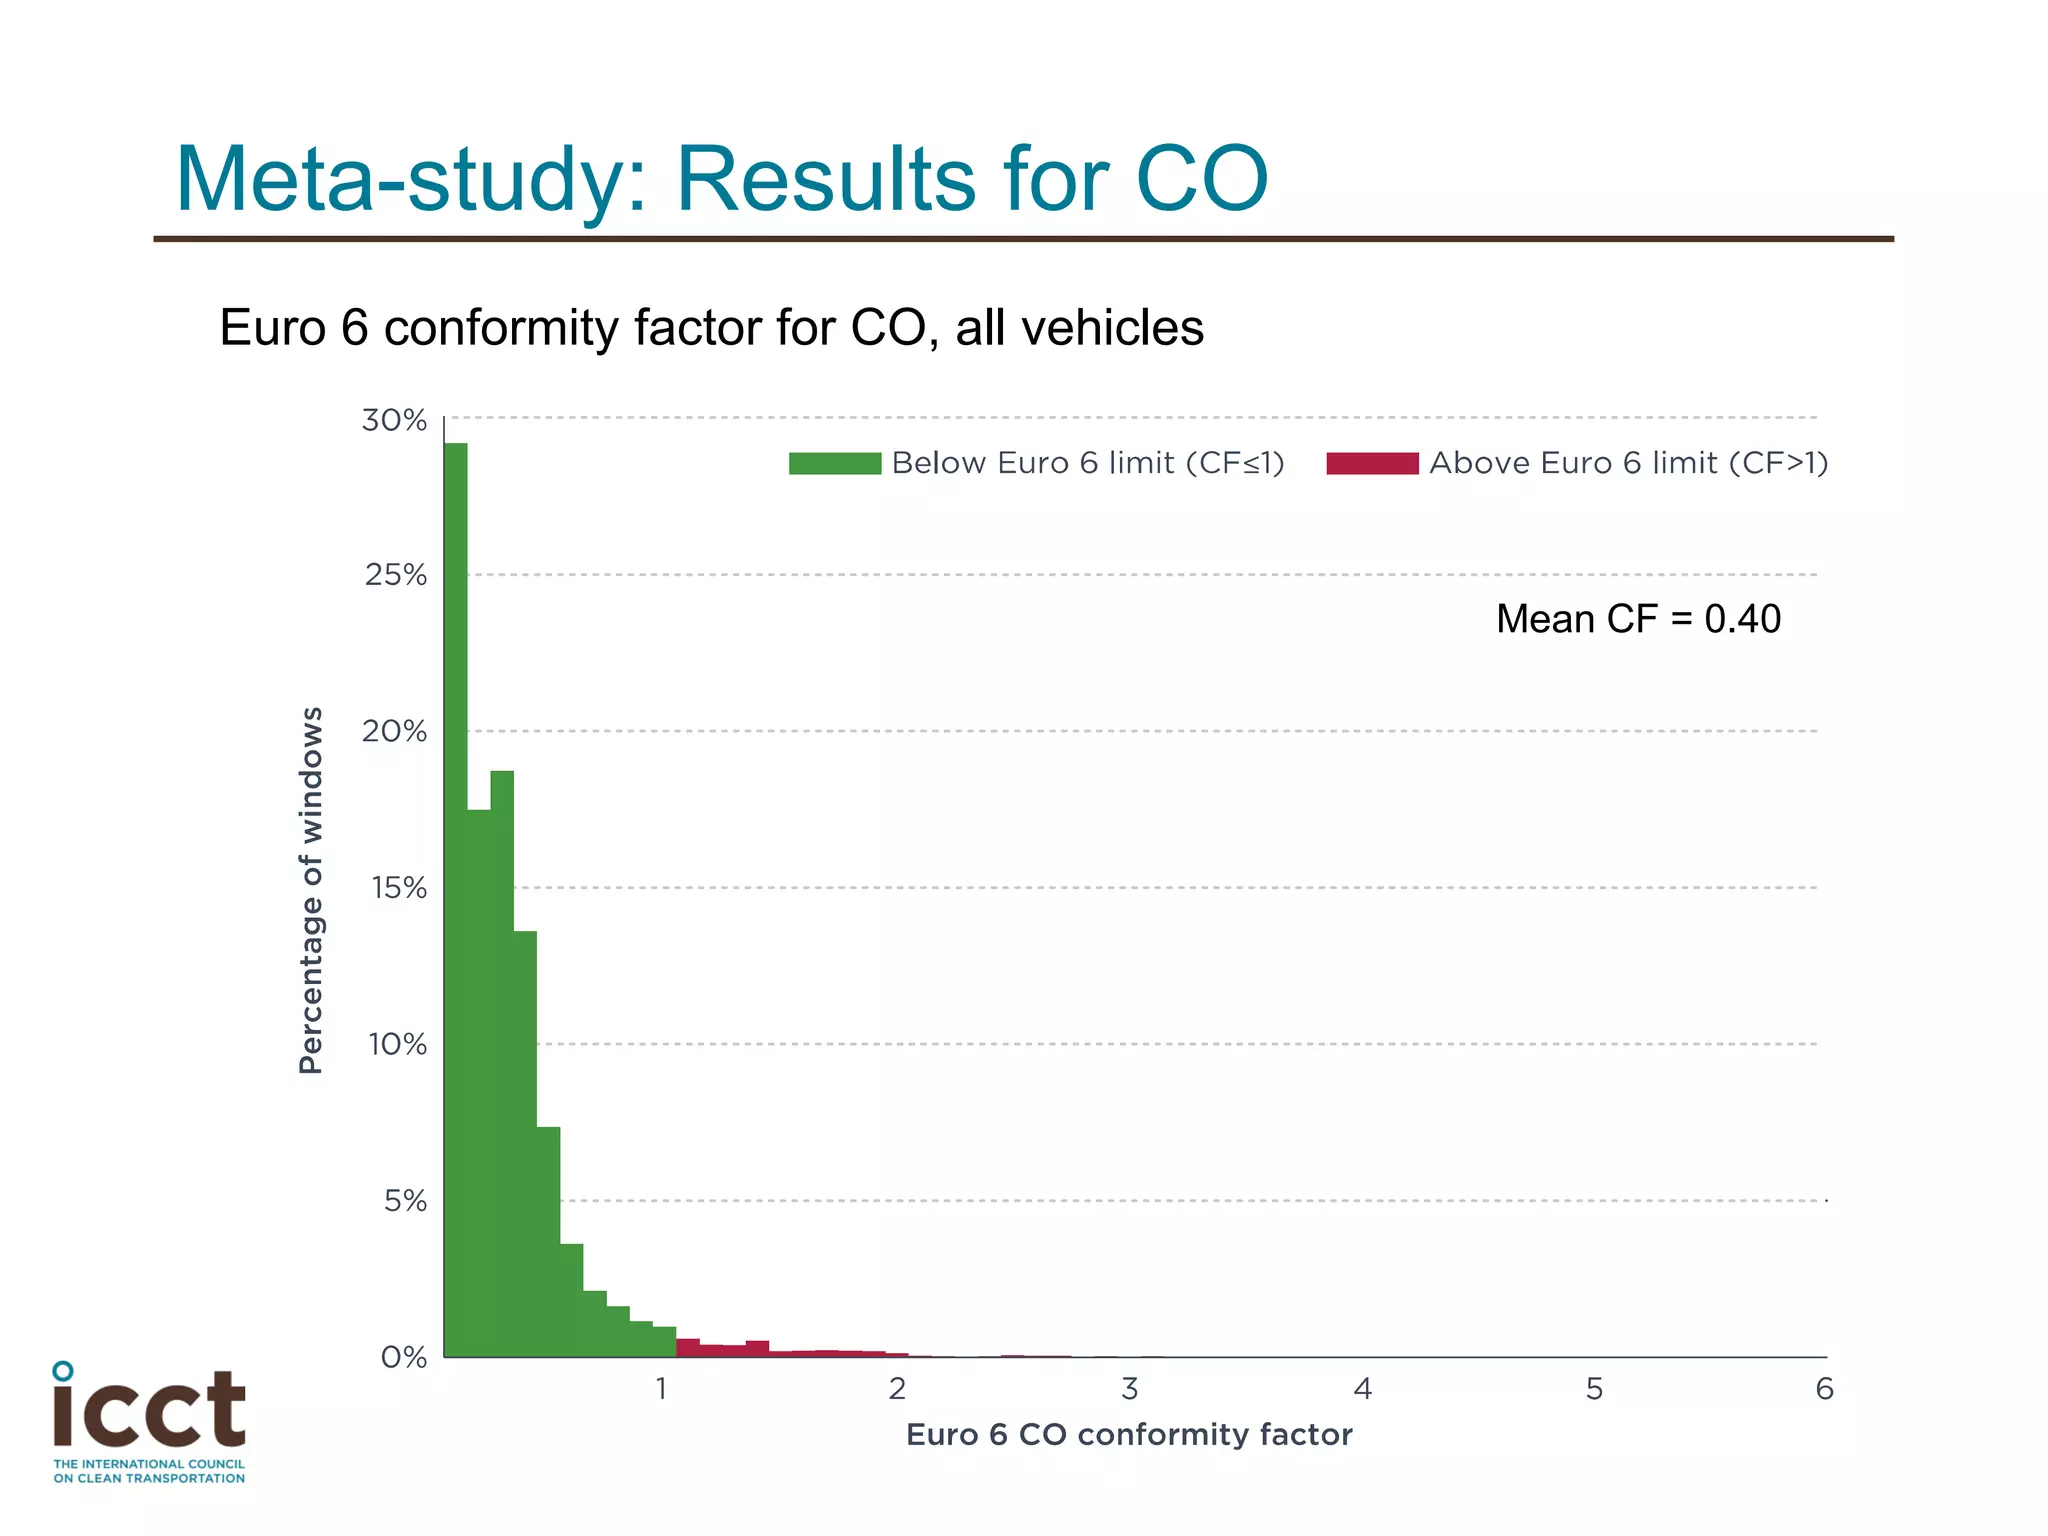
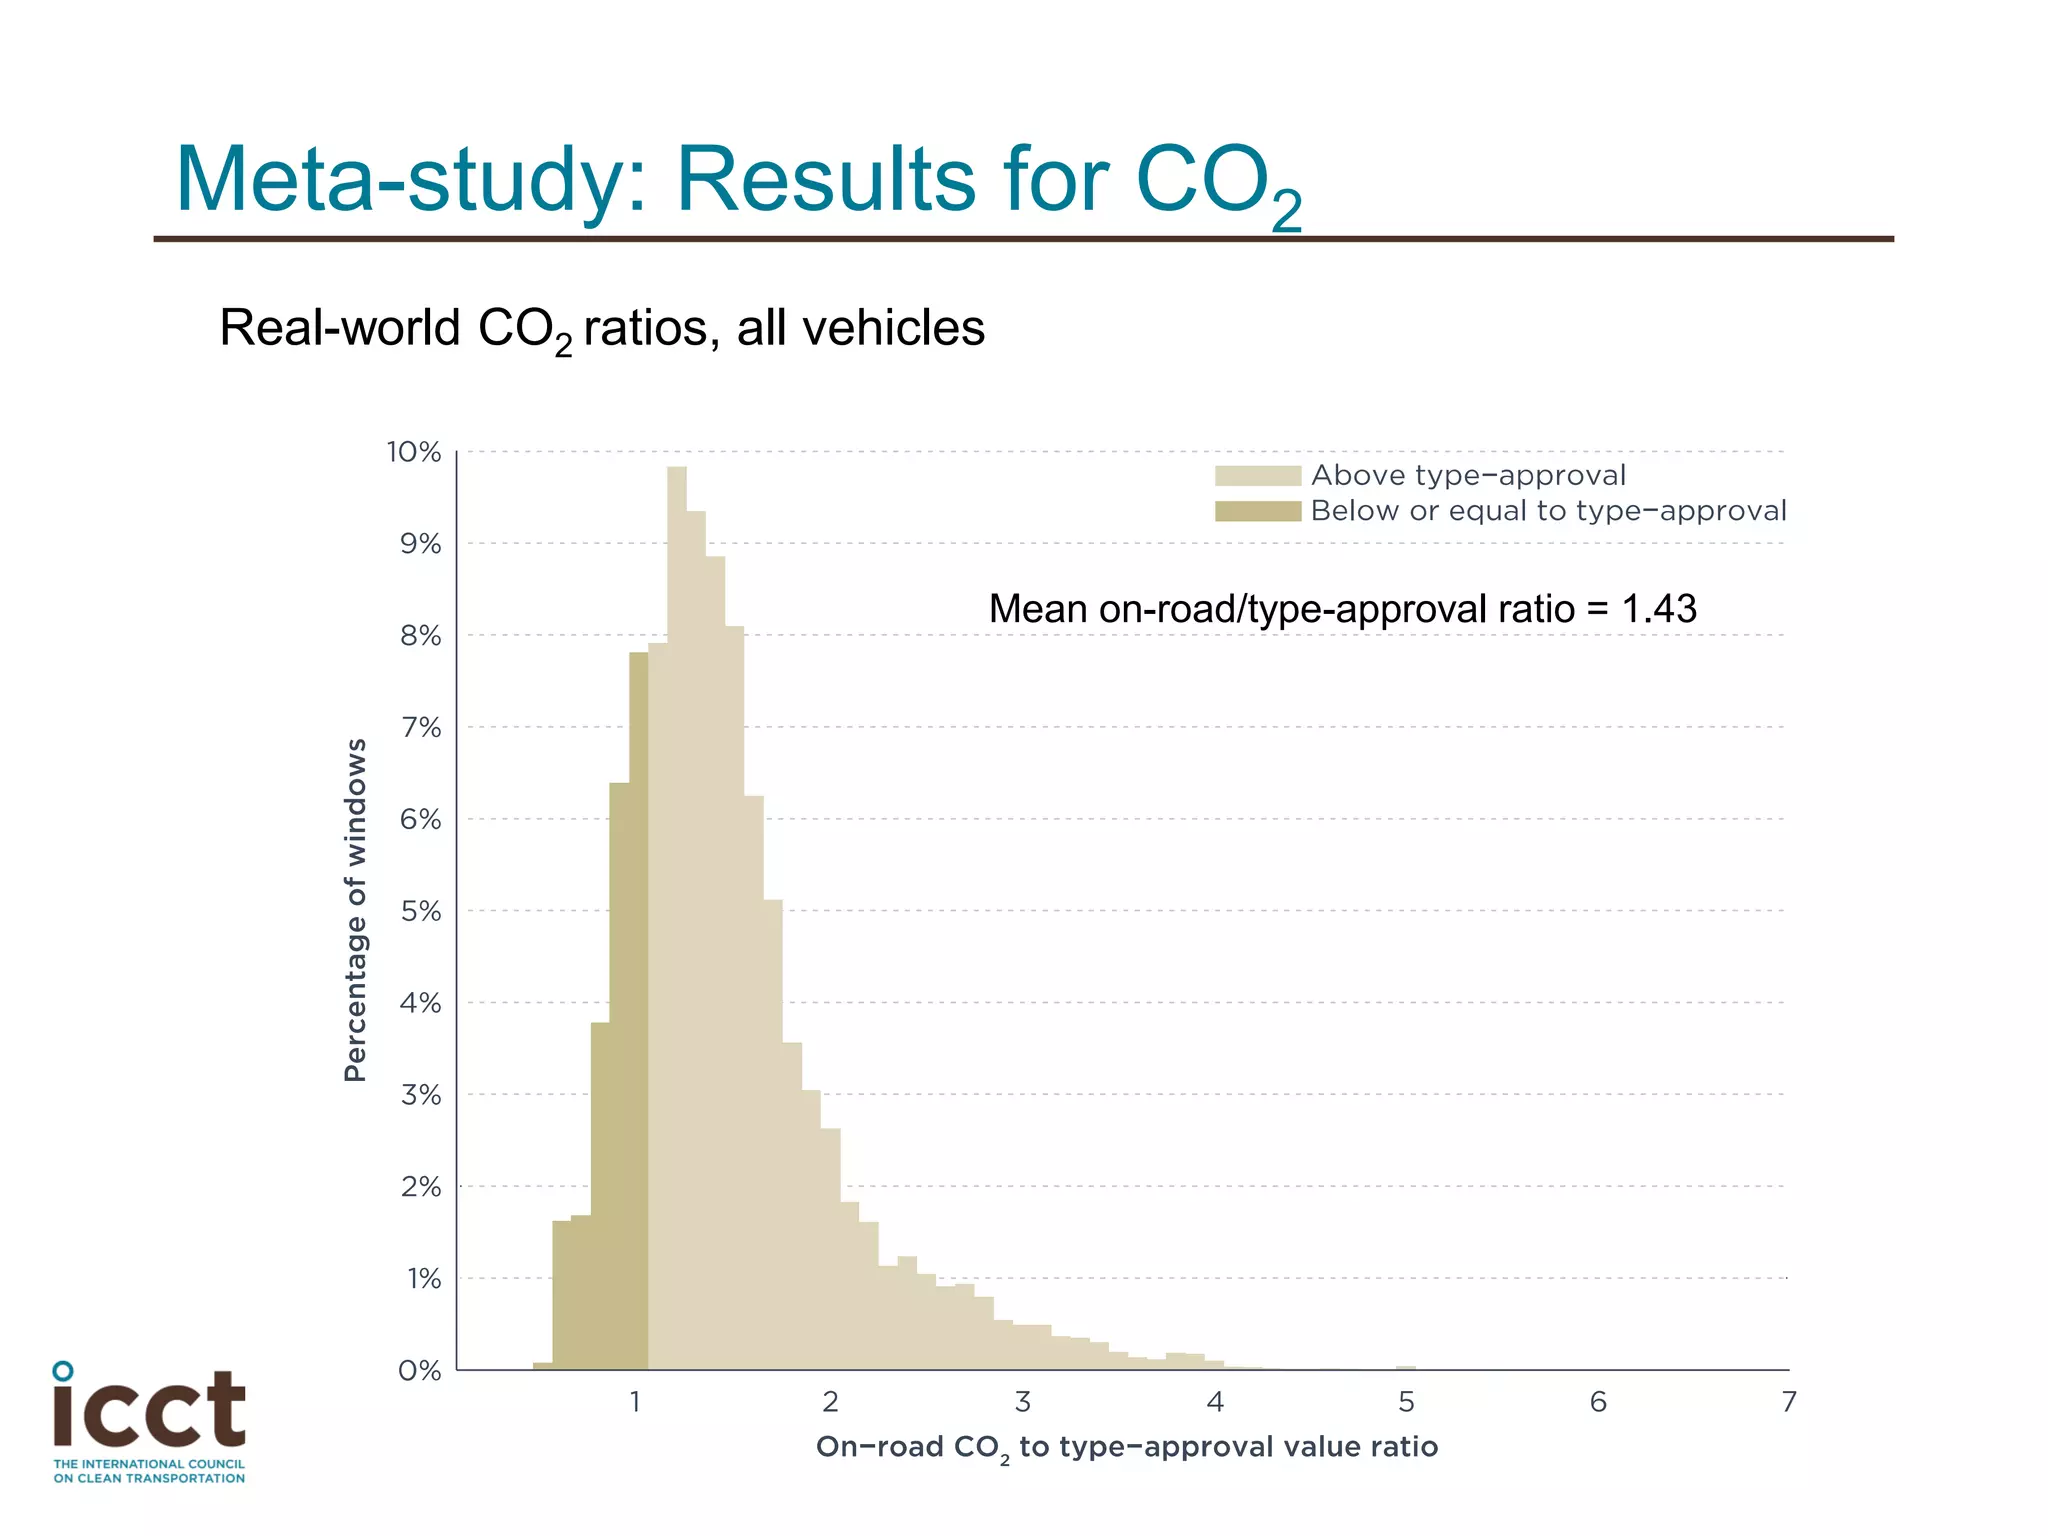
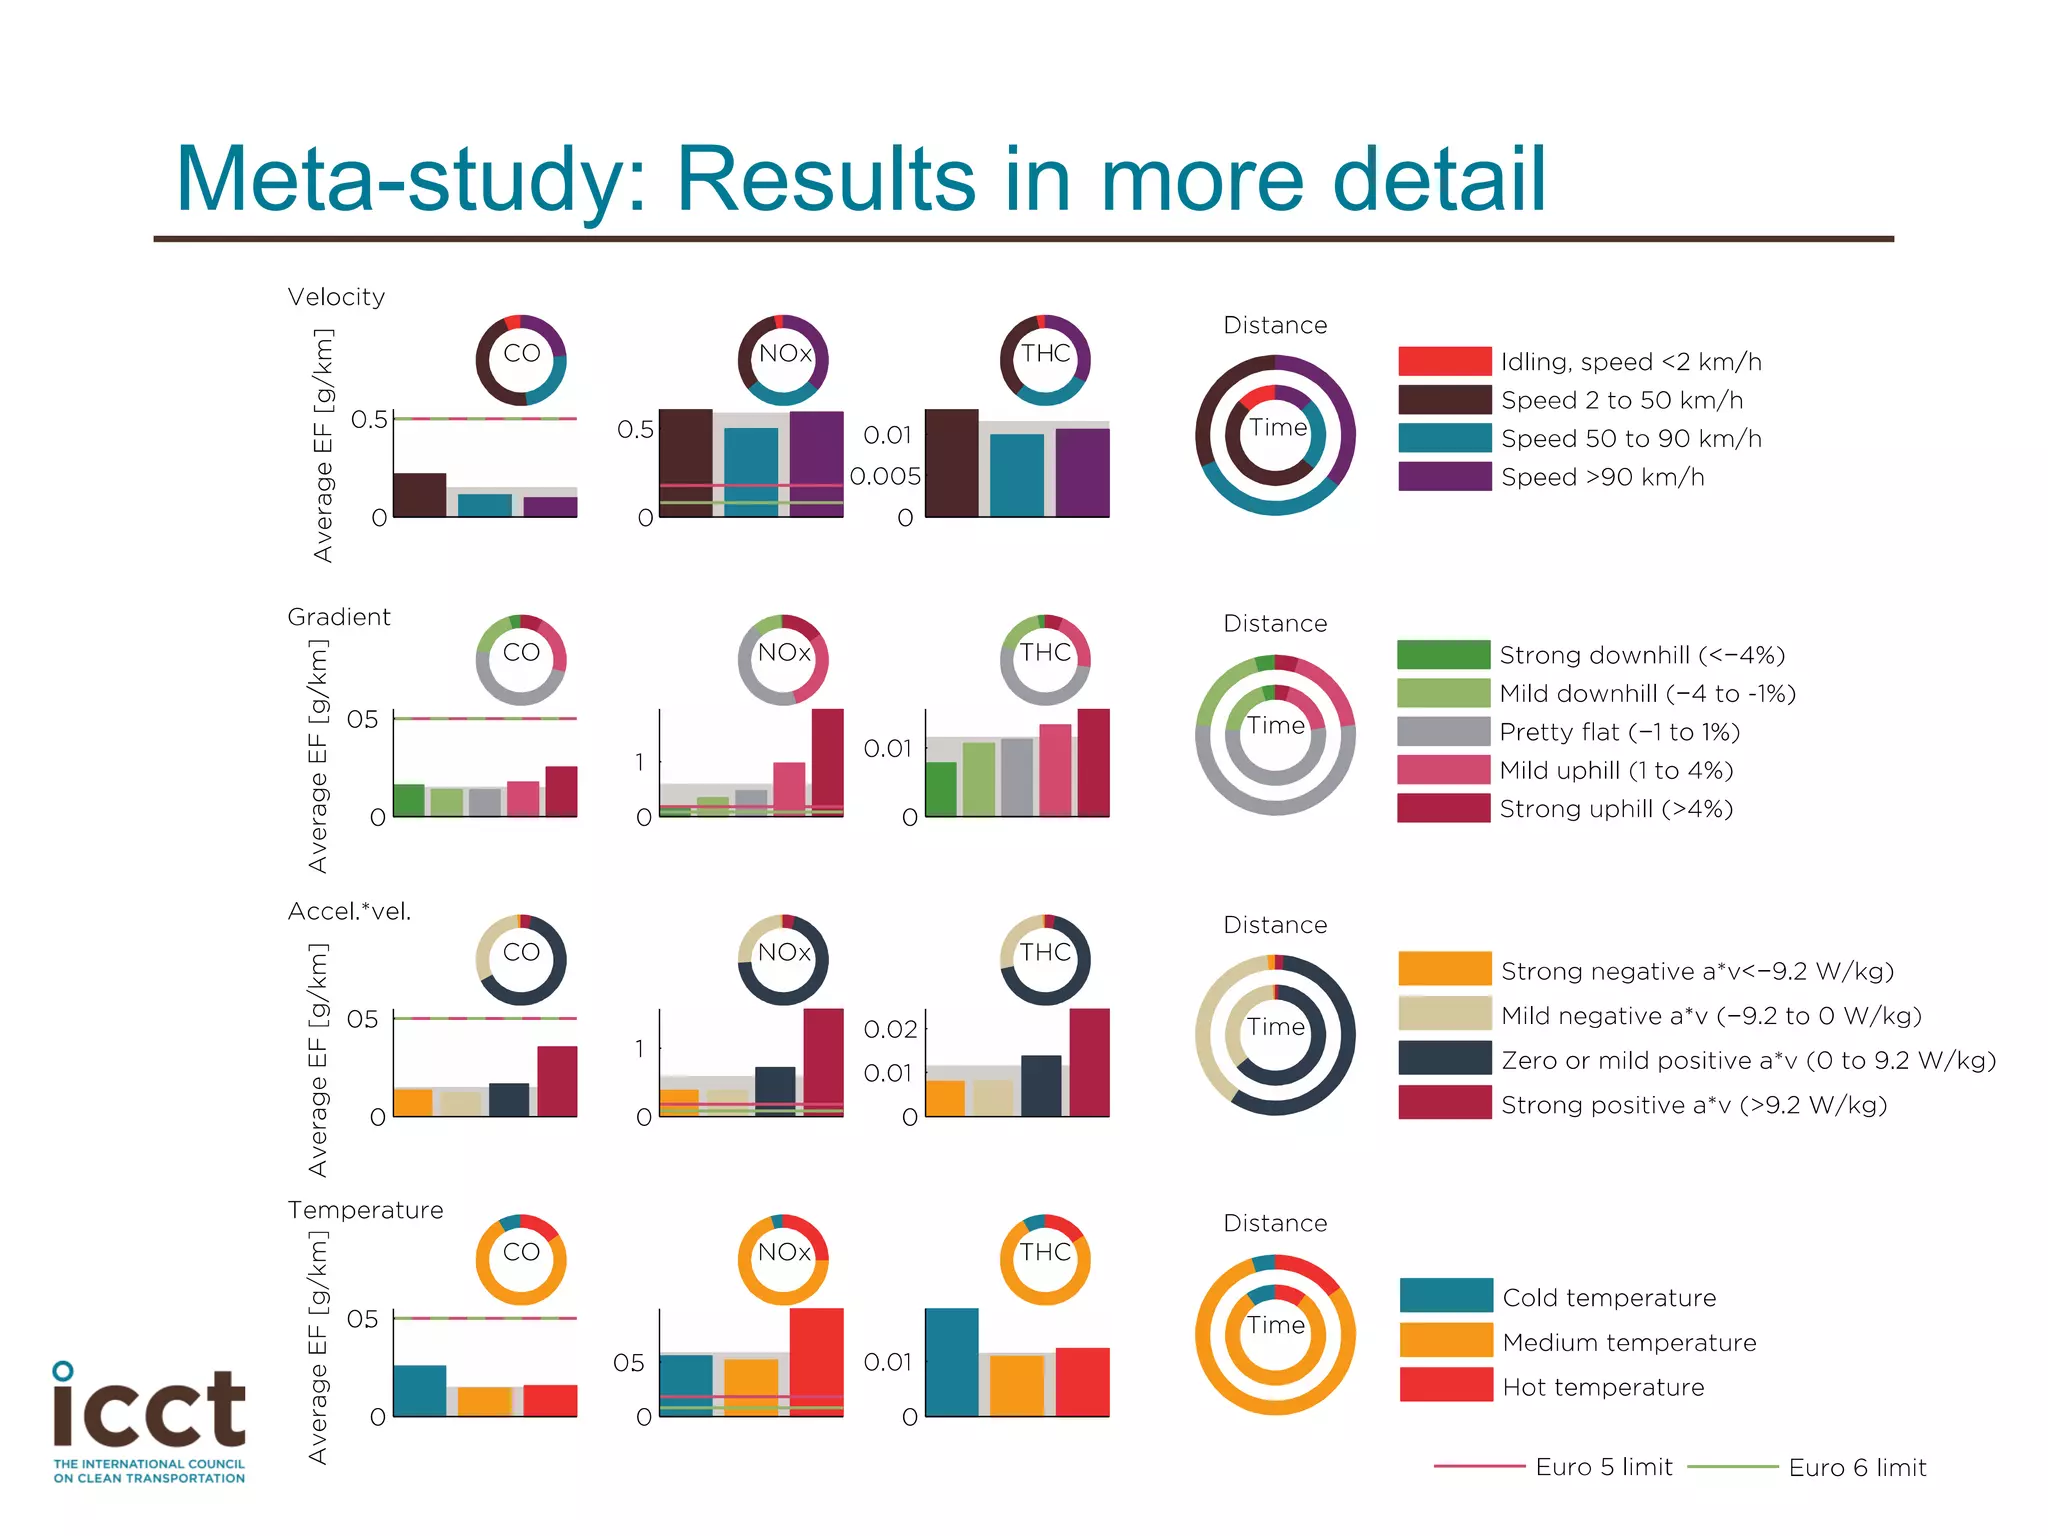
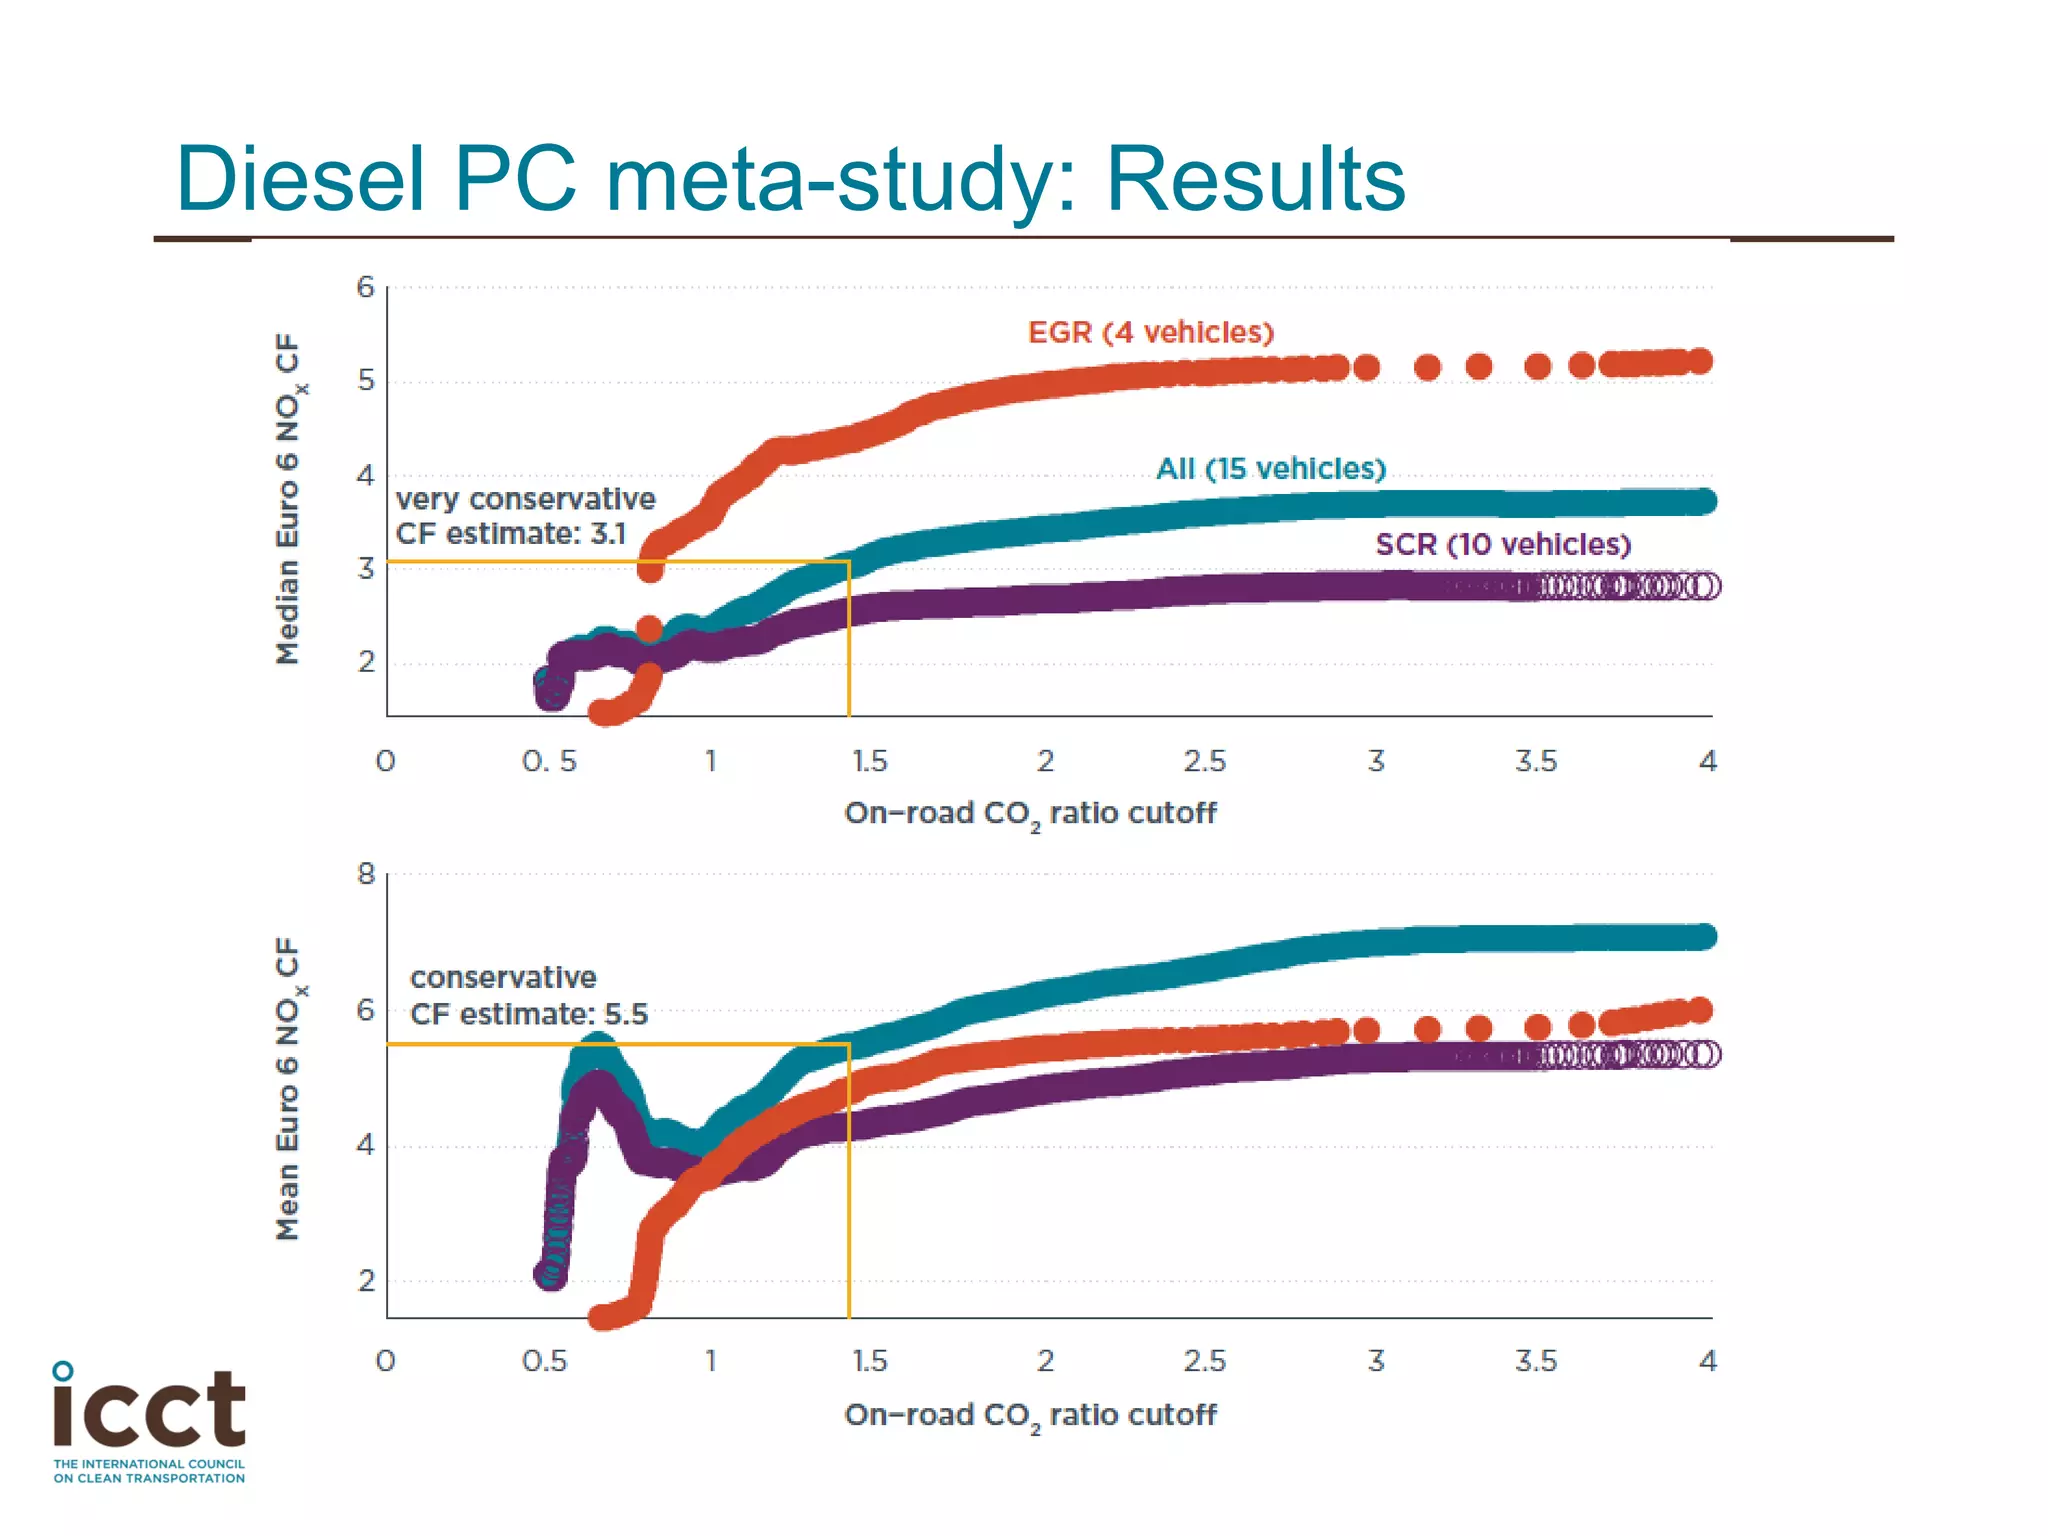
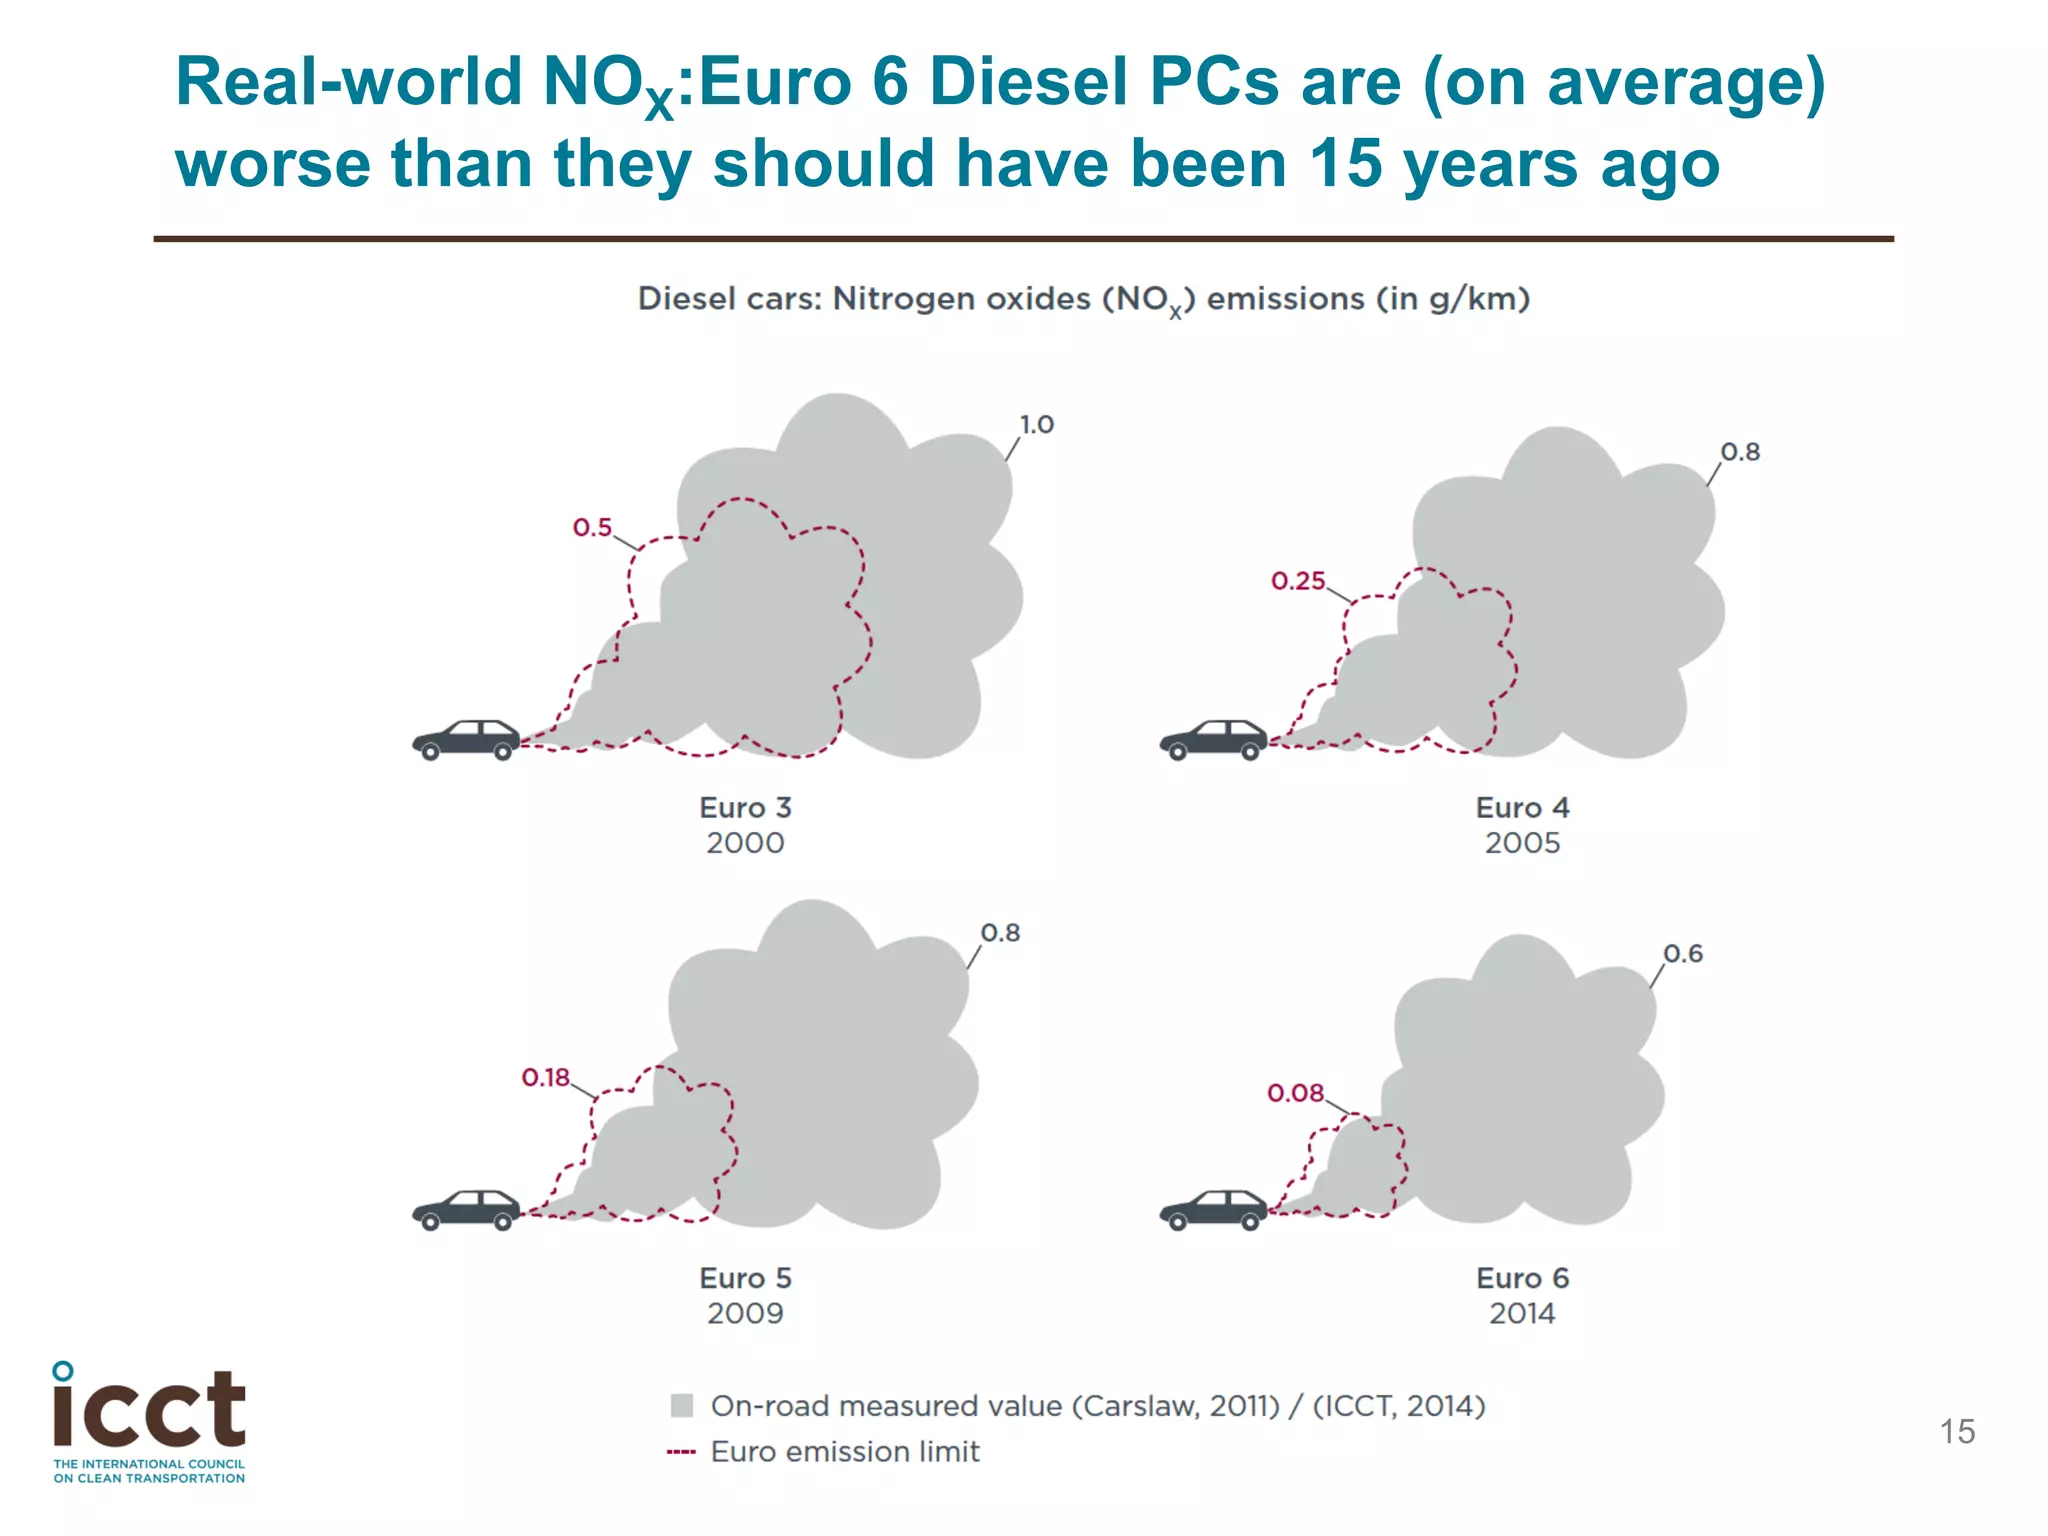
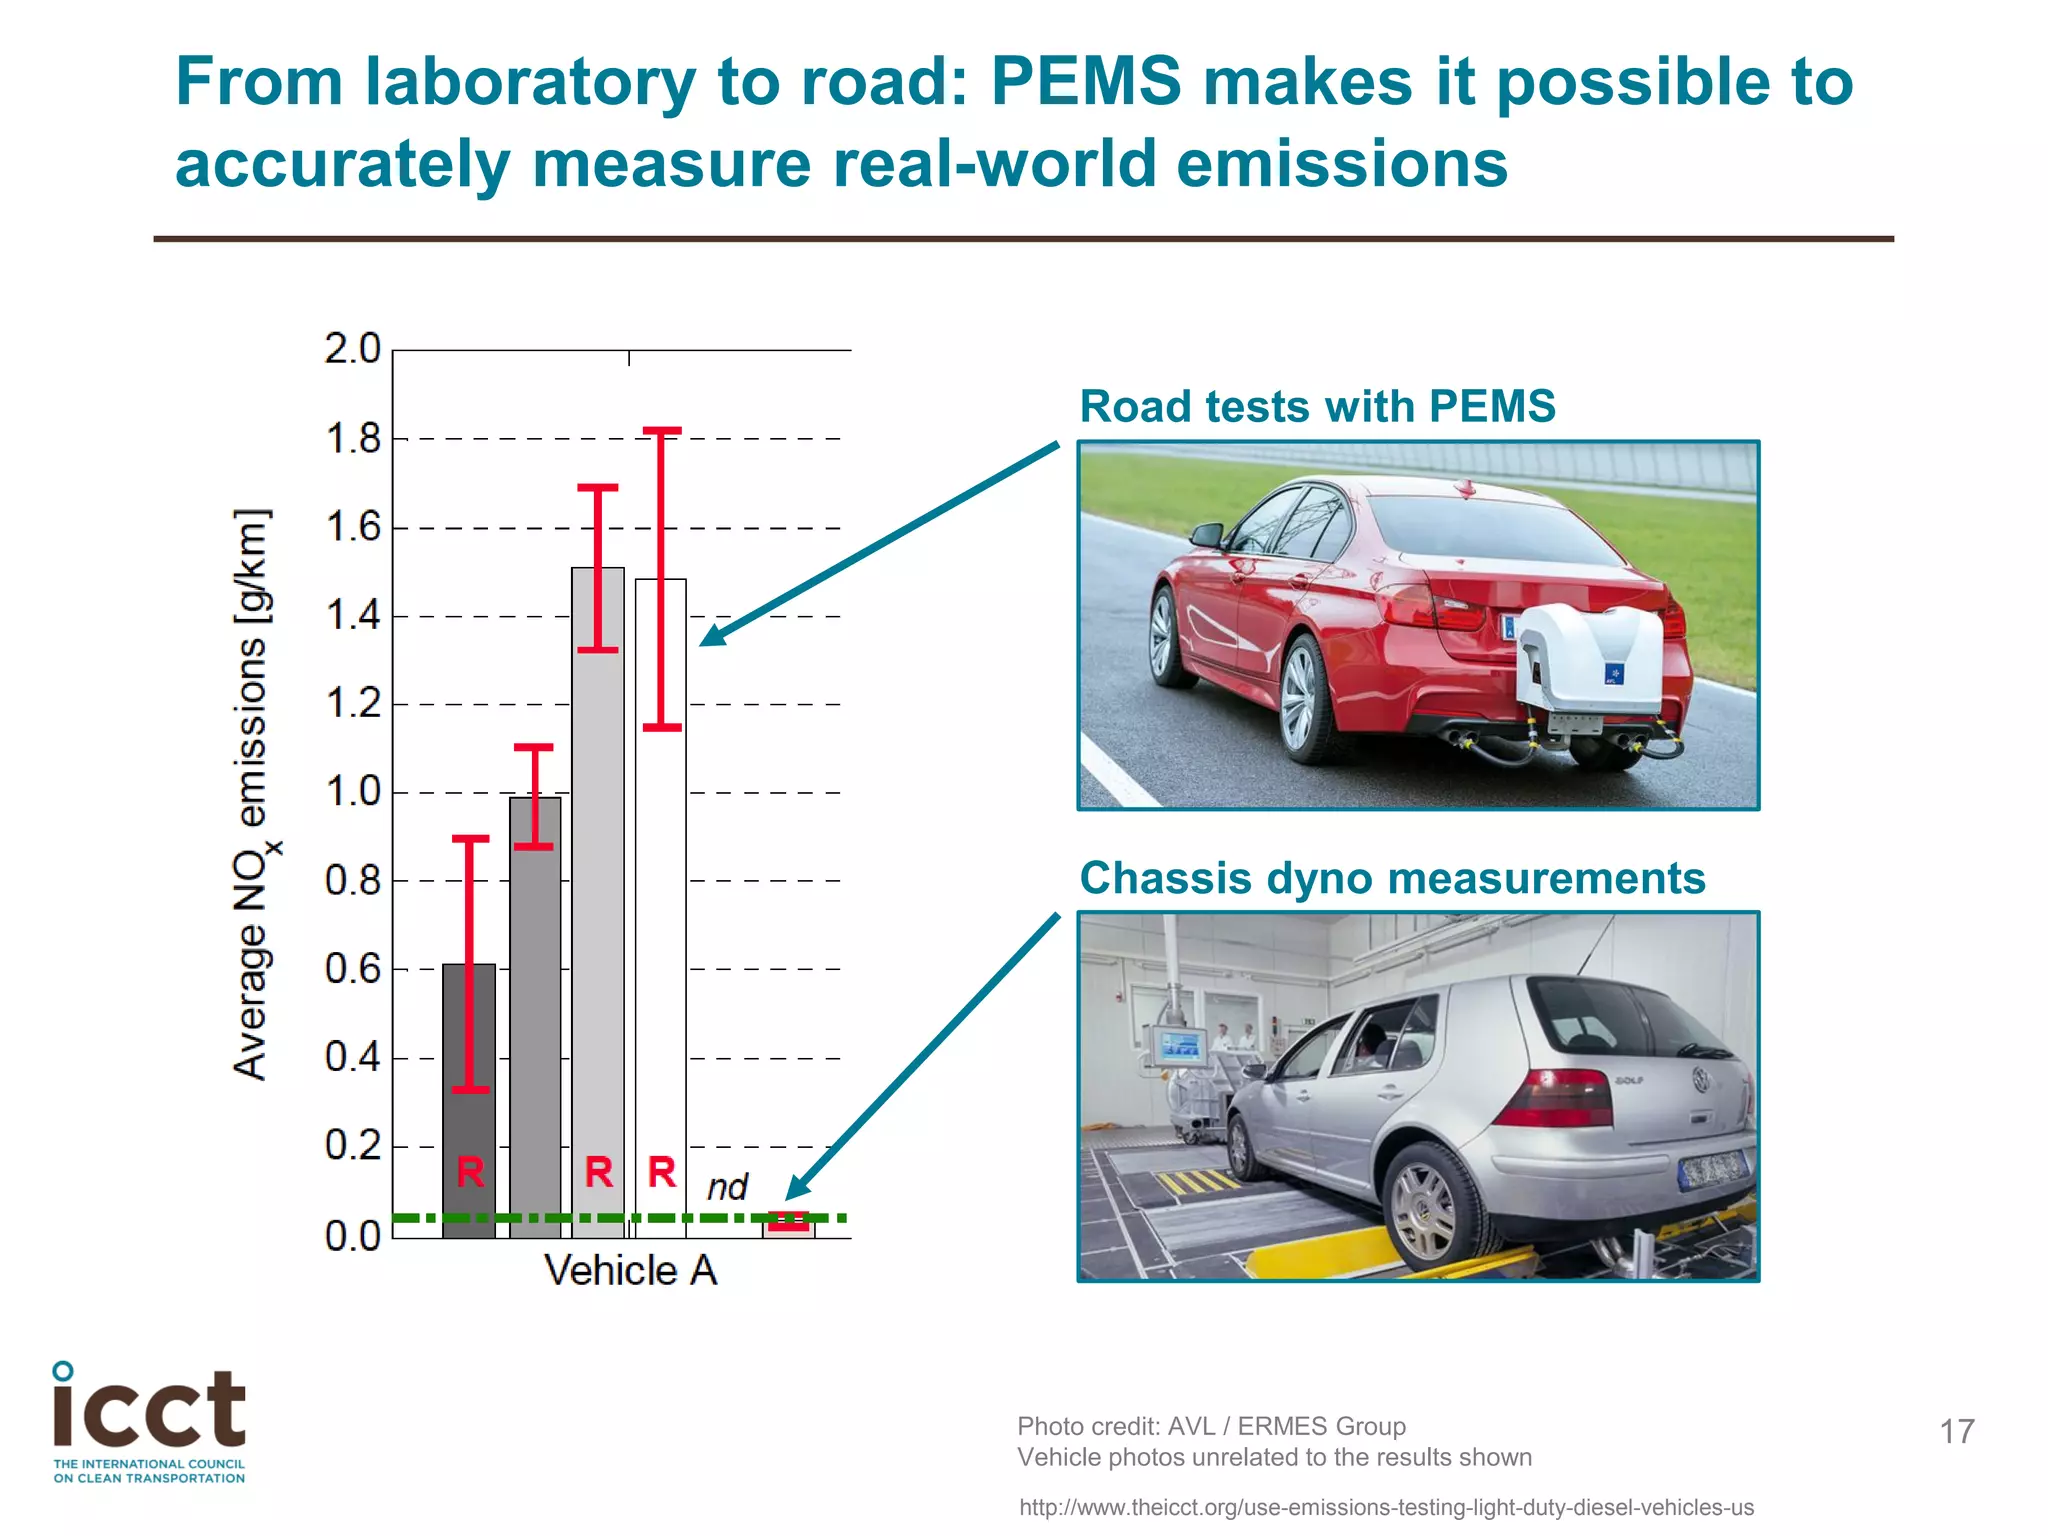
The document discusses regulatory challenges around real-world vehicle emissions testing. It summarizes results from a meta-study of 15 diesel passenger cars that found average NOx emissions were 7 times higher than Euro 6 limits. It also discusses advanced emissions measurement technologies and trends, and various vehicle technologies that can help meet 2020 emissions targets, such as hybrid systems, electric vehicles, and fuel efficiency improvements.