
Download to read offline
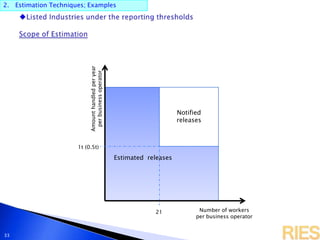
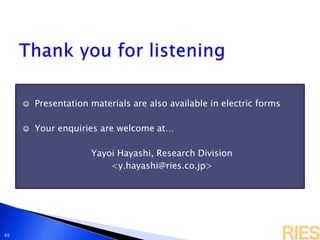
![2. Estimation Techniques; Examples
31
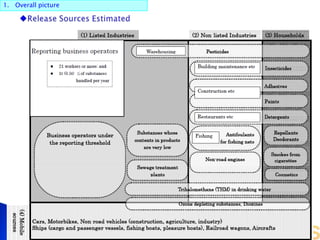
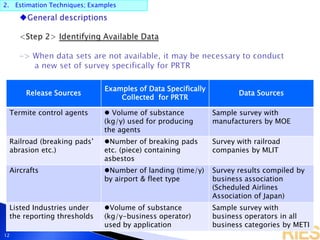
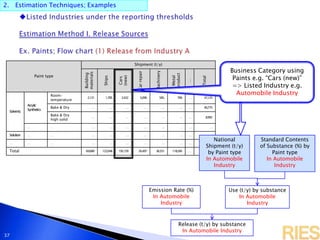
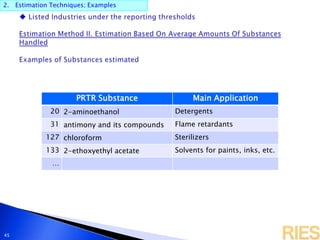
Substance
Shipment (kg/y)
TotalBusiness
use
House-
holds
22 5-amino-1-[2,6-dichloro-4-(trifluoromethyl)phenyl]-3-
cyano-4-[(trifluoromethyl)sulfinyl]pyrazole
8,599 8,599
30 n-alkylbenzenesulfonic acid and its salts(alkyl C=10-14) 1,104 1,104
53 ethylbenzene 16 16
57 ethylene glycol monoethyl ether 546 546
64 2-(4-ethoxyphenyl)-2-methylpropyl 3-phenoxybenzyl ether 3,674 500 4,174
80 xylene 6,116 6,116
… … … …
Total 61,751 49,213 110,964](https://image.slidesharecdn.com/prtrnon-pointestimatemethodinjapan-130609195711-phpapp02/85/Prtr-non-point-estimate-method-in-japan-31-320.jpg)
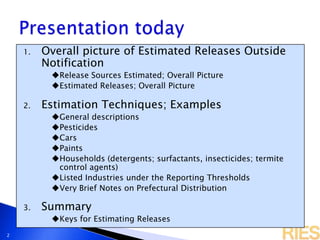
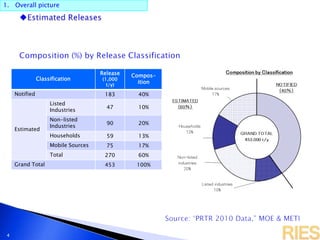
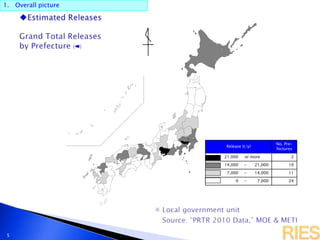
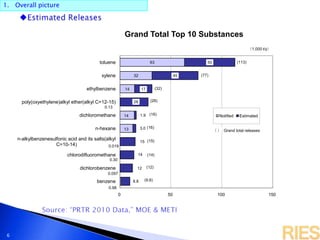
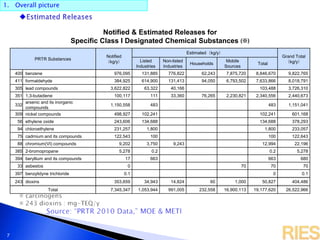
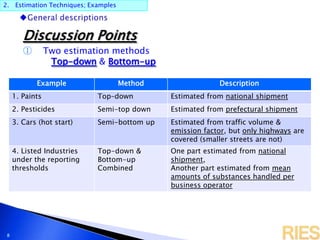
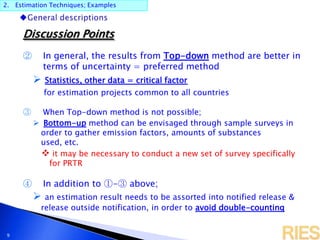
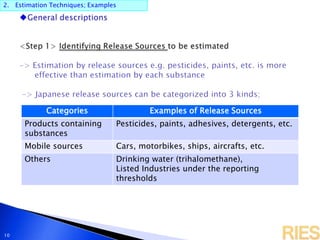
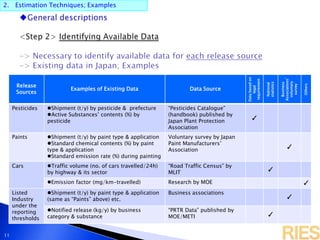
This document provides an overview and examples of techniques used to estimate releases of chemicals outside of notification requirements in Japan. It summarizes the overall picture of estimated releases, which account for 60% of total releases. It then describes two main estimation techniques - top-down and bottom-up. Top-down is preferred when data is available, using national statistics. Bottom-up involves sample surveys. Examples are provided for how releases are estimated for pesticides, mobile sources like cars, paints, and household products using various data sources and emission factors. Keys to the estimations include classifying sources and having substance composition data.


