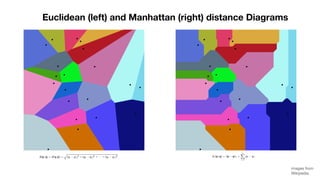
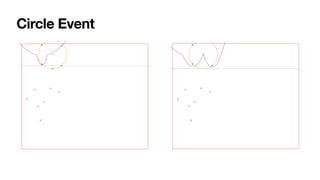
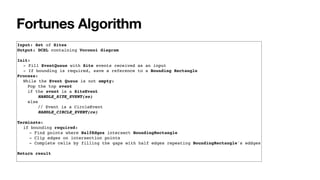
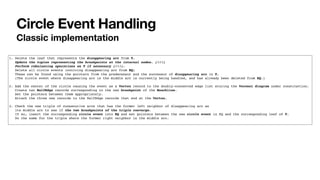
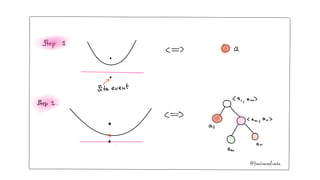
The document summarizes Fortune's algorithm for generating Voronoi diagrams. It begins with background on Voronoi diagrams and their applications. It then outlines Fortune's algorithm, which uses a sweep line and priority queue of events to incrementally build the Voronoi diagram. Key aspects include maintaining a beach line of parabolic arcs, handling site events by splitting arcs and circle events by removing arcs. The algorithm runs in O(n log n) time by using a self-balancing binary search tree to represent the beach line.


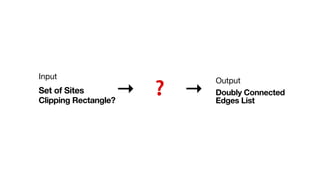


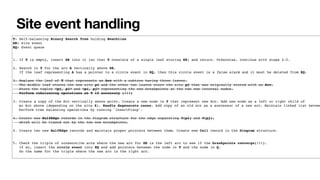
![Diagram (DCEL)
DCEL
vertices: [Vertex]
halfEdges: [HalfEdge]
faces: [Face]
Vertex
x, y: Numeric
incidentHalfEdge: HalfEdge
HalfEdge
incidentFace: Face
twin: HalfEdge?
origin: Vertex?
destination: Vertex?
// Doubly linked list
prev: HalfEdge
next: HalfEdge
getDestination() -> HalfEdge
return next.origin
getOrigin() -> HalfEdge
return prev.destinationFace
// Doubly linked list of half-edges
incidentHalfEdge: HalfEdge](https://image.slidesharecdn.com/fortunesalgorithmslides-200922173726/85/Fortune-s-algorithm-17-320.jpg)


![Everywhere 🙂
• https://en.wikipedia.org/wiki/Voronoi_diagram
• Camille Wormser. Generalized Voronoi Diagrams and Applications.
Computer Science [cs]. Université Nice Sophia Antipolis, 2008. English.
tel-00410850](https://image.slidesharecdn.com/fortunesalgorithmslides-200922173726/85/Fortune-s-algorithm-57-320.jpg)


![Getting Started with Apache Spark: Big Data Made Simple [Free Meetup]](https://cdn.slidesharecdn.com/ss_thumbnails/apachesparkgettingstarted-260203175547-8361bcc3-thumbnail.jpg?width=640&height=640&fit=bounds)

