Download to read offline

![International Journal of Computer Engineering and Technology (IJCET), ISSN 0976-
6367(Print), ISSN 0976 – 6375(Online) Volume 4, Issue 2, March – April (2013), © IAEME
• Qm <= -1, indicating that the community so formed will be a weak structure
and can be easily subjected to frequent changes resulting in the instability.
• Qm = 0, indicating that no more community structures can be extracted from
the given network.
• Qm >= 1, indicating that the structures so formed are strong and are not
subjected to any frequent changes.
In the third module, there exists the regrouping of the isolated vertices based on the
high similarity of their respective modularity values. This finally gives us the required output
network.
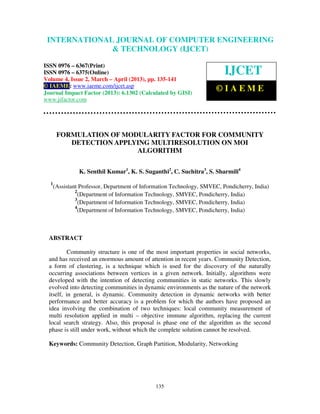
III. ALGORITHM FOR MODULARITY CALCULATION
In context with social networking that can be best cited for the concept proposed the
parameters taken into consideration includes tags in the photos posted, comments received on
the photos posted and related posts that have been shared or agreed upon. There are the
parameters that help in calculating the parameter that helps in calculating the edges cost
between two vertices. This helps in analyzing the strength of the link of the considered
network. The algorithm given below has been developed with the Newman – Girvan as its
base.
Input: Text file containing the cluster
Output: Detection if the cluster is strong or weak
1: Initialize i = 0, cluster_link = 0, net_link = 0
2: while ( ! EOF)
3: Initialize j = 0
4: while ( ! null)
5: Store the values in multi – dimensional array
6: Increment j by 1
7: Increment i by 1
8: Calculate total_cost for each vertex using the multi – dimensional array
9: if (total_cost [vertex] >= limit)
10: edge [vertex] = 1
11: else
12: edge [vertex] = 0
13: Initialize count to 0
14: for m = 1 to n do
15: if edge [m] = 1
16: Increment count by 1
17: if (count) not equal to 0
18: cluster_link = count
19: else
20: cluster does not exist
21: Obtain max (neighbour_values) and store as degree of the respective cluster
22: Repeat steps 1 to 21 for all existing clusters in the considered network
23: From step 22, obtain net_link value
24: Use cluster_link, net_link and degree values to calculate Qm
25: Check the Qm value to see if the cluster is weak or strong
26: Stop
138](https://image.slidesharecdn.com/formulationofmodularityfactorforcommunitydetectionapplying-130403041921-phpapp02/85/Formulation-of-modularity-factor-for-community-detection-applying-4-320.jpg)

![International Journal of Computer Engineering and Technology (IJCET), ISSN 0976-
6367(Print), ISSN 0976 – 6375(Online) Volume 4, Issue 2, March – April (2013), © IAEME
REFERENCES
Books
[1] M. E. J. Newman, Networks – An Introduction (Oxford)
Journal Papers
[2] Keehyung Kim, Ri McKay, and Byung – Ro Moon, Multiobjective Evolutionary
Algorithms for Dynamic Social Netowork Clustering, ACM 2010.
[3] Mao – Guo Gong, Ling – Jun Zhang, Jing Jing - Ma, and Li – Cheng Jiao,
Community Detection in Dynamic Social Networks based on Multiobjective Immune
Algorithm, Journal of Computer Science and Technology, May 2012.
[4] Jianbin Huang, Heli Sun, Yaguang Liu, Qinbao Song, and Tim Weninger, Towards
Online Multiresolution Community Detection in Large – Scale Networks, August 2011.
[5] M. E. J. Newman and M. Girvan, Finding and evaluating community structure in
networks, August 2003.
[6] M. E. J. Newman, Fast algorithm for detecting community structure in networks,
September 2003.
[7] C. O. Dorso and A. D. Menus, Community Detection in Networks, International
Journal of Bifurcation and Chaos, 2010.
[8] K. Sendil Kumar, K. S. Suganthi, C. Suchitra and S. Sharmili, An Analysis for the
Detection of Network Communities in Dynamic Environments, International Journal of
Applied Information Sciences, February 2013.
141](https://image.slidesharecdn.com/formulationofmodularityfactorforcommunitydetectionapplying-130403041921-phpapp02/85/Formulation-of-modularity-factor-for-community-detection-applying-7-320.jpg)

This document discusses a proposed algorithm for community detection in dynamic social networks. It involves applying multi-resolution techniques to a multi-objective immune algorithm. The algorithm aims to maximize community quality and minimize temporal cost. It has three modules: 1) calculating modularity and betweenness values, 2) identifying high similarity vertex pairs, and 3) regrouping isolated vertices based on modularity values. A case study on Facebook is provided to demonstrate detecting strong and weak communities based on user activities like photos tagged, comments, and posts shared. The algorithm is presented as the first phase for community detection in dynamic networks, with the second phase still under development.

![Community detection in social networks[1]](https://cdn.slidesharecdn.com/ss_thumbnails/communitydetectioninsocialnetworks1-121022180209-phpapp02-thumbnail.jpg?width=640&height=640&fit=bounds)