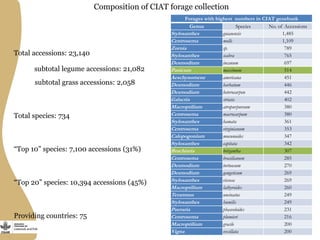
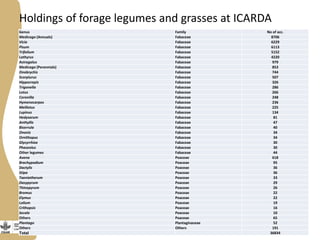
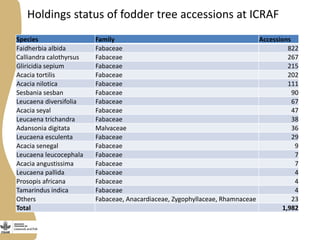
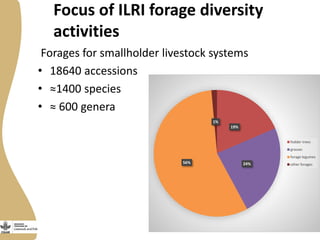
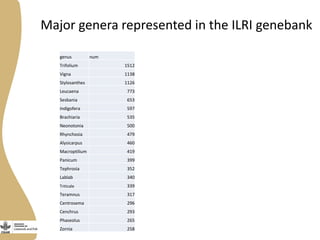
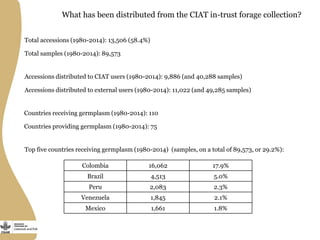
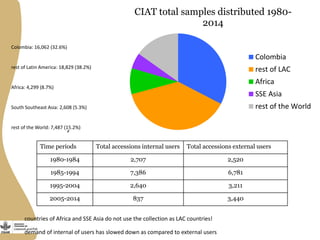
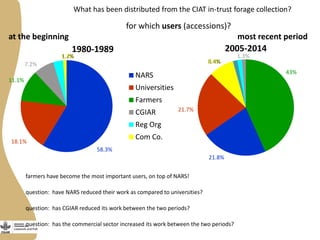
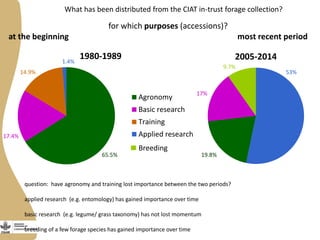
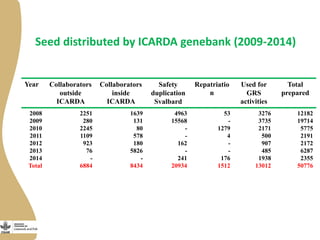
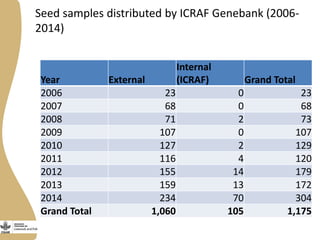
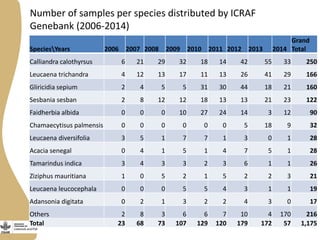
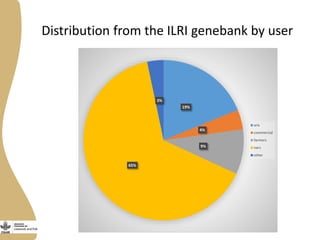
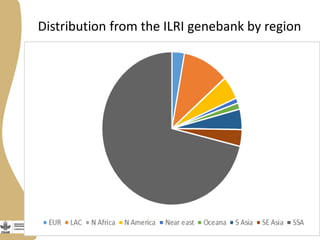
Forage and Fodder Tree Selection for Future Challenges—Linking
Genebanks to Forage Use, Addis Ababa, 16-20 March 2015
Forage and fodder tree selection for
future challenges: Linking users to
genebanks
Daniel Debouck, Jean Hanson, Ahmed Amri and Alice Muchugi
 purpose(s) of genetic collections
 contents of genetic collections
 uses (distribution) of genetic collections
Contents
Forage diversity
Grasses
 90% of cultivated genera originated
in sub Saharan Africa
 Over 1000 species used as feed
Forage legumes and other
herbaceous plants
 Most important legumes species
originated in the Americas or the
Mediterranean regions
 Food feed crops – Cowpea, Lablab
are African
Fodder shrubs and trees
 Most commonly grown
originated in Central America
and sub Saharan Africa
 Problems of anti-nutritional
factors
Purpose of CIAT tropical forage collection
to make tropical forage options available to small-holder farmers in lowland tropics
as ground cover
against drought
as living fence
against flooding
Composition of CIAT forage collection
Forages with highest numbers in CIAT genebank
Genus Species No. of Accessions
Stylosanthes guianensis 1,485
Centrosema molle 1,109
Zornia sp. 789
Stylosanthes scabra 765
Desmodium incanum 697
Panicum maximum 514
Aeschynomene americana 451
Desmodium barbatum 446
Desmodium heterocarpon 442
Galactia striata 402
Macroptilium atropurpureum 380
Centrosema macrocarpum 380
Stylosanthes hamata 361
Centrosema virginianum 353
Calopogonium mucunoides 347
Stylosanthes capitata 342
Brachiaria brizantha 307
Centrosema brasilianum 285
Desmodium tortuosum 270
Desmodium gangeticum 269
Stylosanthes viscosa 269
Macroptilium lathyroides 260
Teramnus uncinatus 249
Stylosanthes humilis 249
Pueraria phaseoloides 231
Centrosema plumieri 216
Macroptilium gracile 200
Vigna vexillata 200
Total species: 734
“Top 10” species: 7,100 accessions (31%)
“Top 20” species: 10,394 accessions (45%)
Providing countries: 75
Total accessions: 23,140
subtotal legume accessions: 21,082
subtotal grass accessions: 2,058
Holdings of forage legumes and grasses at ICARDA
Genus Family No of acc.
Medicago (Annuals) Fabaceae 8706
Vicia Fabaceae 6229
Pisum Fabaceae 6113
Trifolium Fabaceae 5152
Lathyrus Fabaceae 4220
Astragalus Fabaceae 979
Medicago (Perennials) Fabaceae 853
Onobrychis Fabaceae 744
Scorpiurus Fabaceae 507
Hippocrepis Fabaceae 326
Trigonella Fabaceae 286
Lotus Fabaceae 266
Coronilla Fabaceae 248
Hymenocarpos Fabaceae 236
Melilotus Fabaceae 225
Lupinus Fabaceae 134
Hedysarum Fabaceae 81
Anthyllis Fabaceae 47
Biserrula Fabaceae 40
Ononis Fabaceae 34
Ornithopus Fabaceae 34
Glycyrrhiza Fabaceae 30
Phaseolus Fabaceae 30
Other legumes Fabaceae 44
Avena Poaceae 618
Brachypodium Poaceae 95
Dactylis Poaceae 36
Stipa Poaceae 36
Taeniatherum Poaceae 33
Dasypyrum Poaceae 29
Thinopyrum Poaceae 26
Bromus Poaceae 22
Elymus Poaceae 22
Lolium Poaceae 19
Crithopsis Poaceae 16
Secale Poaceae 10
Others Poaceae 65
Plantago Plantaginaceae 52
Others Others 191
Total 36834
Holdings status of fodder tree accessions at ICRAF
Species Family Accessions
Faidherbia albida Fabaceae 822
Calliandra calothyrsus Fabaceae 267
Gliricidia sepium Fabaceae 215
Acacia tortilis Fabaceae 202
Acacia nilotica Fabaceae 111
Sesbania sesban Fabaceae 90
Leucaena diversifolia Fabaceae 67
Acacia seyal Fabaceae 47
Leucaena trichandra Fabaceae 38
Adansonia digitata Malvaceae 36
Leucaena esculenta Fabaceae 29
Acacia senegal Fabaceae 9
Leucaena leucocephala Fabaceae 7
Acacia angustissima Fabaceae 7
Leucaena pallida Fabaceae 4
Prosopis africana Fabaceae 4
Tamarindus indica Fabaceae 4
Others Fabaceae, Anacardiaceae, Zygophyllaceae, Rhamnaceae 23
Total 1,982
Focus of ILRI forage diversity
activities
Forages for smallholder livestock systems
• 18640 accessions
• ≈1400 species
• ≈ 600 genera
19%
24%56%
1%
fodder trees
grasses
forage legumes
other forages
Major genera represented in the ILRI genebank
genus num
Trifolium 1512
Vigna 1138
Stylosanthes 1126
Leucaena 773
Sesbania 653
Indigofera 597
Brachiaria 535
Neonotonia 500
Rhynchosia 479
Alysicarpus 460
Macroptilium 419
Panicum 399
Tephrosia 352
Lablab 340
Triticale 339
Teramnus 317
Centrosema 296
Cenchrus 293
Phaseolus 265
Zornia 258
What has been distributed from the CIAT in-trust forage collection?
Total accessions (1980-2014): 13,506 (58.4%)
Total samples (1980-2014): 89,573
Accessions distributed to CIAT users (1980-2014): 9,886 (and 40,288 samples)
Accessions distributed to external users (1980-2014): 11,022 (and 49,285 samples)
Countries receiving germplasm (1980-2014): 110
Countries providing germplasm (1980-2014): 75
Top five countries receiving germplasm (1980-2014) (samples, on a total of 89,573, or 29.2%):
Colombia 16,062 17.9%
Brazil 4,513 5.0%
Peru 2,083 2.3%
Venezuela 1,845 2.1%
Mexico 1,661 1.8%
Time periods Total accessions internal users Total accessions external users
1980-1984 2,707 2,520
1985-1994 7,386 6,781
1995-2004 2,640 3,211
2005-2014 837 3,440
CIAT total samples distributed 1980-
2014
Colombia
rest of LAC
Africa
SSE Asia
rest of the World
Colombia: 16,062 (32.6%)
rest of Latin America: 18,829 (38.2%)
Africa: 4,299 (8.7%)
South Southeast Asia: 2,608 (5.3%)
rest of the World: 7,487 (15.2%)
countries of Africa and SSE Asia do not use the collection as LAC countries!
demand of internal of users has slowed down as compared to external users
What has been distributed from the CIAT in-trust forage collection?
for which users (accessions)?
1980-1989
NARS
Universities
Farmers
CGIAR
Reg Org
Com Co.
2005-2014
at the beginning most recent period
farmers have become the most important users, on top of NARS!
question: have NARS reduced their work as compared to universities?
question: has CGIAR reduced its work between the two periods?
question: has the commercial sector increased its work between the two periods?
58.3%
21.8%
18.1%
21.7%
11.1%
43%
7.2%
1.3%1.2%
8.4%
What has been distributed from the CIAT in-trust forage collection?
for which purposes (accessions)?
1980-1989
Agronomy
Basic research
Training
Applied research
2005-2014
at the beginning most recent period
Breeding
question: have agronomy and training lost importance between the two periods?
applied research (e.g. entomology) has gained importance over time
basic research (e.g. legume/ grass taxonomy) has not lost momentum
breeding of a few forage species has gained importance over time
53%
1.4%
19.8%65.5%
17.4%
17%
14.9%
9.7%
Seed distributed by ICARDA genebank (2009-2014)
Year Collaborators
outside
ICARDA
Collaborators
inside
ICARDA
Safety
duplication
Svalbard
Repatriatio
n
Used for
GRS
activities
Total
prepared
2008
2009
2010
2011
2012
2013
2014
Total
2251
280
2245
1109
923
76
-
6884
1639
131
80
578
180
5826
-
8434
4963
15568
-
-
162
-
241
20934
53
-
1279
4
-
-
176
1512
3276
3735
2171
500
907
485
1938
13012
12182
19714
5775
2191
2172
6287
2355
50776
Seed samples distributed by ICRAF Genebank (2006-
2014)
Year External
Internal
(ICRAF) Grand Total
2006 23 0 23
2007 68 0 68
2008 71 2 73
2009 107 0 107
2010 127 2 129
2011 116 4 120
2012 155 14 179
2013 159 13 172
2014 234 70 304
Grand Total 1,060 105 1,175
Number of samples per species distributed by ICRAF
Genebank (2006-2014)
SpeciesYears 2006 2007 2008 2009 2010 2011 2012 2013 2014
Grand
Total
Calliandra calothyrsus 6 21 29 32 18 14 42 55 33 250
Leucaena trichandra 4 12 13 17 11 13 26 41 29 166
Gliricidia sepium 2 4 5 5 31 30 44 18 21 160
Sesbania sesban 2 8 12 12 18 13 13 21 23 122
Faidherbia albida 0 0 0 10 27 24 14 3 12 90
Chamaecytisus palmensis 0 0 0 0 0 0 5 18 9 32
Leucaena diversifolia 3 5 1 7 7 1 3 0 1 28
Acacia senegal 0 4 1 5 1 4 7 5 1 28
Tamarindus indica 3 4 3 3 2 3 6 1 1 26
Ziziphus mauritiana 1 0 5 2 1 5 2 2 3 21
Leucaena leucocephala 0 0 0 5 5 4 3 1 1 19
Adansonia digitata 0 2 1 3 2 2 4 3 0 17
Others 2 8 3 6 6 7 10 4 170 216
Total 23 68 73 107 129 120 179 172 57 1,175
Distribution from the ILRI genebank by user
19%
4%
9%
65%
3%
aris
commercial
farmers
nars
other
Distribution from the ILRI genebank by region
How can we increase the use of the CIAT in-trust forage collection?
0
2000
4000
6000
8000
10000
12000
14000
2009 2010 2011 2012 2013 2014
http://www.ciat.cgiar.org/urg
numbers of visits:
8,289 7,917
12,750
10,436
9,400
5,858
to enable requests from cell phones!
to put at forefront data useful to users
ICARDA new collected Forages, pastures and
rangeland species, 2009-2014
Crop
Samples collected
Annual Medics
349
Clover
633
Grasspea
96
Pastures and rangeland
787
Pea
28
Vetch
149
Total
2003
Activities to support forage use in ILRI
• Diversity in Napier grass
– Phenotyping for biomass under drought
– Genotyping using SSRs
• Diversity in Buffel grass
• Phenotyping for biomass under drought and cold environments
• Nutritional diversity
– Improved diagnostics for forage diseases
– Forage seed production of promising genotypes
– Forage seed agribusiness development
Concluding remarks
 the four genebanks keep large options in legumes unmatched elsewherer
(tremendous assets in post CBD context, when N fertilizers are expensive)
 the four genebanks do not distribute to the expected high levels
 the distribution is regional and with a strong neighborhood effect
 users have been shifting over time, with farmers and commercial sector
gaining
 purposes have shifted over time, with agronomy declining and
breeding gaining
 there is a need for another mindset in genebanks: not curators, but
users!

Forage and fodder tree selection for future challenges: Linking users to genebanks

  • 1.
    Forage and FodderTree Selection for Future Challenges—Linking Genebanks to Forage Use, Addis Ababa, 16-20 March 2015 Forage and fodder tree selection for future challenges: Linking users to genebanks Daniel Debouck, Jean Hanson, Ahmed Amri and Alice Muchugi
  • 2.
     purpose(s) ofgenetic collections  contents of genetic collections  uses (distribution) of genetic collections Contents
  • 3.
    Forage diversity Grasses  90%of cultivated genera originated in sub Saharan Africa  Over 1000 species used as feed Forage legumes and other herbaceous plants  Most important legumes species originated in the Americas or the Mediterranean regions  Food feed crops – Cowpea, Lablab are African Fodder shrubs and trees  Most commonly grown originated in Central America and sub Saharan Africa  Problems of anti-nutritional factors
  • 4.
    Purpose of CIATtropical forage collection to make tropical forage options available to small-holder farmers in lowland tropics as ground cover against drought as living fence against flooding
  • 5.
    Composition of CIATforage collection Forages with highest numbers in CIAT genebank Genus Species No. of Accessions Stylosanthes guianensis 1,485 Centrosema molle 1,109 Zornia sp. 789 Stylosanthes scabra 765 Desmodium incanum 697 Panicum maximum 514 Aeschynomene americana 451 Desmodium barbatum 446 Desmodium heterocarpon 442 Galactia striata 402 Macroptilium atropurpureum 380 Centrosema macrocarpum 380 Stylosanthes hamata 361 Centrosema virginianum 353 Calopogonium mucunoides 347 Stylosanthes capitata 342 Brachiaria brizantha 307 Centrosema brasilianum 285 Desmodium tortuosum 270 Desmodium gangeticum 269 Stylosanthes viscosa 269 Macroptilium lathyroides 260 Teramnus uncinatus 249 Stylosanthes humilis 249 Pueraria phaseoloides 231 Centrosema plumieri 216 Macroptilium gracile 200 Vigna vexillata 200 Total species: 734 “Top 10” species: 7,100 accessions (31%) “Top 20” species: 10,394 accessions (45%) Providing countries: 75 Total accessions: 23,140 subtotal legume accessions: 21,082 subtotal grass accessions: 2,058
  • 6.
    Holdings of foragelegumes and grasses at ICARDA Genus Family No of acc. Medicago (Annuals) Fabaceae 8706 Vicia Fabaceae 6229 Pisum Fabaceae 6113 Trifolium Fabaceae 5152 Lathyrus Fabaceae 4220 Astragalus Fabaceae 979 Medicago (Perennials) Fabaceae 853 Onobrychis Fabaceae 744 Scorpiurus Fabaceae 507 Hippocrepis Fabaceae 326 Trigonella Fabaceae 286 Lotus Fabaceae 266 Coronilla Fabaceae 248 Hymenocarpos Fabaceae 236 Melilotus Fabaceae 225 Lupinus Fabaceae 134 Hedysarum Fabaceae 81 Anthyllis Fabaceae 47 Biserrula Fabaceae 40 Ononis Fabaceae 34 Ornithopus Fabaceae 34 Glycyrrhiza Fabaceae 30 Phaseolus Fabaceae 30 Other legumes Fabaceae 44 Avena Poaceae 618 Brachypodium Poaceae 95 Dactylis Poaceae 36 Stipa Poaceae 36 Taeniatherum Poaceae 33 Dasypyrum Poaceae 29 Thinopyrum Poaceae 26 Bromus Poaceae 22 Elymus Poaceae 22 Lolium Poaceae 19 Crithopsis Poaceae 16 Secale Poaceae 10 Others Poaceae 65 Plantago Plantaginaceae 52 Others Others 191 Total 36834
  • 7.
    Holdings status offodder tree accessions at ICRAF Species Family Accessions Faidherbia albida Fabaceae 822 Calliandra calothyrsus Fabaceae 267 Gliricidia sepium Fabaceae 215 Acacia tortilis Fabaceae 202 Acacia nilotica Fabaceae 111 Sesbania sesban Fabaceae 90 Leucaena diversifolia Fabaceae 67 Acacia seyal Fabaceae 47 Leucaena trichandra Fabaceae 38 Adansonia digitata Malvaceae 36 Leucaena esculenta Fabaceae 29 Acacia senegal Fabaceae 9 Leucaena leucocephala Fabaceae 7 Acacia angustissima Fabaceae 7 Leucaena pallida Fabaceae 4 Prosopis africana Fabaceae 4 Tamarindus indica Fabaceae 4 Others Fabaceae, Anacardiaceae, Zygophyllaceae, Rhamnaceae 23 Total 1,982
  • 8.
    Focus of ILRIforage diversity activities Forages for smallholder livestock systems • 18640 accessions • ≈1400 species • ≈ 600 genera 19% 24%56% 1% fodder trees grasses forage legumes other forages
  • 9.
    Major genera representedin the ILRI genebank genus num Trifolium 1512 Vigna 1138 Stylosanthes 1126 Leucaena 773 Sesbania 653 Indigofera 597 Brachiaria 535 Neonotonia 500 Rhynchosia 479 Alysicarpus 460 Macroptilium 419 Panicum 399 Tephrosia 352 Lablab 340 Triticale 339 Teramnus 317 Centrosema 296 Cenchrus 293 Phaseolus 265 Zornia 258
  • 10.
    What has beendistributed from the CIAT in-trust forage collection? Total accessions (1980-2014): 13,506 (58.4%) Total samples (1980-2014): 89,573 Accessions distributed to CIAT users (1980-2014): 9,886 (and 40,288 samples) Accessions distributed to external users (1980-2014): 11,022 (and 49,285 samples) Countries receiving germplasm (1980-2014): 110 Countries providing germplasm (1980-2014): 75 Top five countries receiving germplasm (1980-2014) (samples, on a total of 89,573, or 29.2%): Colombia 16,062 17.9% Brazil 4,513 5.0% Peru 2,083 2.3% Venezuela 1,845 2.1% Mexico 1,661 1.8%
  • 11.
    Time periods Totalaccessions internal users Total accessions external users 1980-1984 2,707 2,520 1985-1994 7,386 6,781 1995-2004 2,640 3,211 2005-2014 837 3,440 CIAT total samples distributed 1980- 2014 Colombia rest of LAC Africa SSE Asia rest of the World Colombia: 16,062 (32.6%) rest of Latin America: 18,829 (38.2%) Africa: 4,299 (8.7%) South Southeast Asia: 2,608 (5.3%) rest of the World: 7,487 (15.2%) countries of Africa and SSE Asia do not use the collection as LAC countries! demand of internal of users has slowed down as compared to external users
  • 12.
    What has beendistributed from the CIAT in-trust forage collection? for which users (accessions)? 1980-1989 NARS Universities Farmers CGIAR Reg Org Com Co. 2005-2014 at the beginning most recent period farmers have become the most important users, on top of NARS! question: have NARS reduced their work as compared to universities? question: has CGIAR reduced its work between the two periods? question: has the commercial sector increased its work between the two periods? 58.3% 21.8% 18.1% 21.7% 11.1% 43% 7.2% 1.3%1.2% 8.4%
  • 13.
    What has beendistributed from the CIAT in-trust forage collection? for which purposes (accessions)? 1980-1989 Agronomy Basic research Training Applied research 2005-2014 at the beginning most recent period Breeding question: have agronomy and training lost importance between the two periods? applied research (e.g. entomology) has gained importance over time basic research (e.g. legume/ grass taxonomy) has not lost momentum breeding of a few forage species has gained importance over time 53% 1.4% 19.8%65.5% 17.4% 17% 14.9% 9.7%
  • 14.
    Seed distributed byICARDA genebank (2009-2014) Year Collaborators outside ICARDA Collaborators inside ICARDA Safety duplication Svalbard Repatriatio n Used for GRS activities Total prepared 2008 2009 2010 2011 2012 2013 2014 Total 2251 280 2245 1109 923 76 - 6884 1639 131 80 578 180 5826 - 8434 4963 15568 - - 162 - 241 20934 53 - 1279 4 - - 176 1512 3276 3735 2171 500 907 485 1938 13012 12182 19714 5775 2191 2172 6287 2355 50776
  • 15.
    Seed samples distributedby ICRAF Genebank (2006- 2014) Year External Internal (ICRAF) Grand Total 2006 23 0 23 2007 68 0 68 2008 71 2 73 2009 107 0 107 2010 127 2 129 2011 116 4 120 2012 155 14 179 2013 159 13 172 2014 234 70 304 Grand Total 1,060 105 1,175
  • 16.
    Number of samplesper species distributed by ICRAF Genebank (2006-2014) SpeciesYears 2006 2007 2008 2009 2010 2011 2012 2013 2014 Grand Total Calliandra calothyrsus 6 21 29 32 18 14 42 55 33 250 Leucaena trichandra 4 12 13 17 11 13 26 41 29 166 Gliricidia sepium 2 4 5 5 31 30 44 18 21 160 Sesbania sesban 2 8 12 12 18 13 13 21 23 122 Faidherbia albida 0 0 0 10 27 24 14 3 12 90 Chamaecytisus palmensis 0 0 0 0 0 0 5 18 9 32 Leucaena diversifolia 3 5 1 7 7 1 3 0 1 28 Acacia senegal 0 4 1 5 1 4 7 5 1 28 Tamarindus indica 3 4 3 3 2 3 6 1 1 26 Ziziphus mauritiana 1 0 5 2 1 5 2 2 3 21 Leucaena leucocephala 0 0 0 5 5 4 3 1 1 19 Adansonia digitata 0 2 1 3 2 2 4 3 0 17 Others 2 8 3 6 6 7 10 4 170 216 Total 23 68 73 107 129 120 179 172 57 1,175
  • 17.
    Distribution from theILRI genebank by user 19% 4% 9% 65% 3% aris commercial farmers nars other
  • 18.
    Distribution from theILRI genebank by region
  • 19.
    How can weincrease the use of the CIAT in-trust forage collection? 0 2000 4000 6000 8000 10000 12000 14000 2009 2010 2011 2012 2013 2014 http://www.ciat.cgiar.org/urg numbers of visits: 8,289 7,917 12,750 10,436 9,400 5,858 to enable requests from cell phones! to put at forefront data useful to users
  • 20.
    ICARDA new collectedForages, pastures and rangeland species, 2009-2014 Crop Samples collected Annual Medics 349 Clover 633 Grasspea 96 Pastures and rangeland 787 Pea 28 Vetch 149 Total 2003
  • 21.
    Activities to supportforage use in ILRI • Diversity in Napier grass – Phenotyping for biomass under drought – Genotyping using SSRs • Diversity in Buffel grass • Phenotyping for biomass under drought and cold environments • Nutritional diversity – Improved diagnostics for forage diseases – Forage seed production of promising genotypes – Forage seed agribusiness development
  • 22.
    Concluding remarks  thefour genebanks keep large options in legumes unmatched elsewherer (tremendous assets in post CBD context, when N fertilizers are expensive)  the four genebanks do not distribute to the expected high levels  the distribution is regional and with a strong neighborhood effect  users have been shifting over time, with farmers and commercial sector gaining  purposes have shifted over time, with agronomy declining and breeding gaining  there is a need for another mindset in genebanks: not curators, but users!