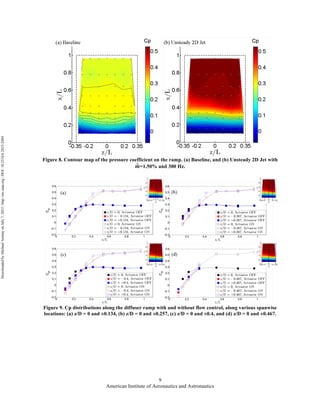
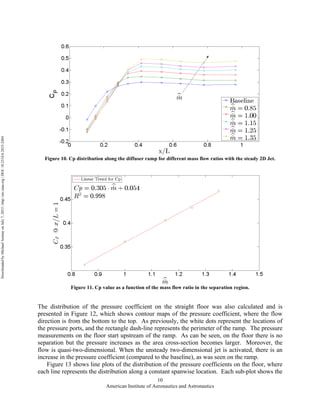
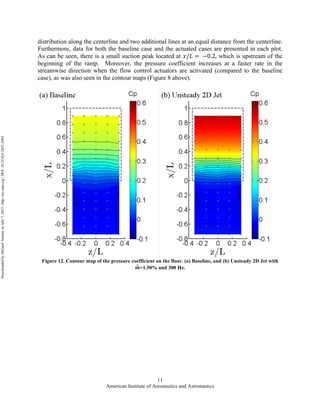
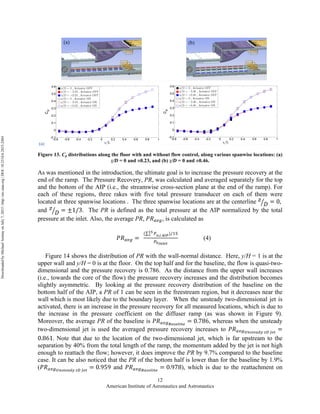
American Institute of Aeronautics and Astronautics
1
Flow Control in a Diffuser at Transonic Conditions
Jeremy Gartner1
and Michael Amitay2
Rensselaer Polytechnic Institute, Troy, NY 12180, USA
In some airplanes such as fighter jets and UAVs, short inlet ducts replace the more
conventional ducts due to their shorter length. However, these ducts, which are associated
with low length-to-diameter ratio and low aspect ratio, experience massive separation and
the presence of secondary flow structures. These flow phenomena are undesirable as they
lead to pressure losses and distortion at the Aerodynamic Interface Plane (AIP), where the
engine face is located. Due to the complex interaction between the separation and the
secondary flow structures, it was necessary to first understand the flow mechanisms, and
how to control them at a more fundamental level. Therefore, a new diffuser with an upper
ramp and a straight floor was designed and built and a canonical flow field was achieved
by applying suction at the corners of the rectangular diffuser. The objective of this project
was to explore the effectiveness of different flow control techniques in a high subsonic (up
to Mach 0.83) diffuser. It was shown that the activation of either a steady or unsteady two-
dimensional Jet, located just upstream of the ramp, delayed separation on the ramp and
increased the pressure recovery by 9.7% at a Mach number of 0.7 and with a mass flow
ratio of 𝒎 = 𝟏. 𝟓𝟎%. In addition to the two-dimensional jet actuator, arrays of sweeping
and pulsed jets were also tested. They were evaluated at their maximum mass flow ratio
𝒎 = 𝟎. 𝟔𝟓% . The pressure recovery was increased by 3.7%, suggesting that these two
actuators performed better than the two-dimensional jet actuator when it was activated at
a mass flow ratio of 𝒎 = 𝟏%.
Nomenclature
AIP = aerodynamic interface plane
𝒎 = actuator mass flow ratio
Minlet = Mach number at the inlet
PR = pressure recovery
Pinlet = static pressure at the inlet
𝛾 = specific heat ratio
Cp = pressure coefficient
P0 = total pressure
P = static pressure
1. Introduction
Heightened interest in short and curved inlet ducts for aircraft has led to further understanding of
the flowfield configuration existing in such devices as well as to a better knowledge of the issues
faced with their design and operation, as well as novel methods of mitigating these issues.
1
Graduate Student, Department of Mechanical, Aerospace & Nuclear Engineering, 110 8th
Street, Troy, NY. AIAA Member.
2
Professor and James L. Decker ’45 Endowed Chair in Aerospace Engineering, and Director of the Center for Flow Physics and
Control, 110 8th
Street, Troy NY. AIAA Associate Fellow. Corresponding author. Email: amitam@rpi.edu author.
DownloadedbyMichaelAmitayonJuly7,2015|http://arc.aiaa.org|DOI:10.2514/6.2015-2484
45th AIAA Fluid Dynamics Conference
22-26 June 2015, Dallas, TX
AIAA 2015-2484
Copyright © 2015 by the American Institute of Aeronautics and Astronautics, Inc. All rights reserved.
AIAA Aviation
American Institute of Aeronautics and Astronautics
2
Several factors related to engine and aircraft performance and operation drive the use of short
inlet duct designs, such as the overall airframe length reduction enabled by a shorter duct and
reduction of frontal planform by incorporating the engine into the airframe. These factors lead to
reduction in weight and fuel consumption and allow for innovative external and integrated
aerodynamics, such as Blended Wing Bodies1
. Other factors that must be considered are stability
margins for operation of a jet engine following the duct, where uneven pressure distribution and
secondary flow structures can lead to engine stall at the compressor (surge stall)2, 3
.
A considerable body of work is available in the literature concerning the analysis of the
flowfield in S-ducts4-12
. This previous research have shed light on the main features of the
flowfield existing in aggressively curved ducts, where the rapid curvature in the duct results in
cross stream pressure gradients in the direction normal to the turn, leading to the onset of a
secondary flow structure composed of two counter rotating vortices. Other structures also co-
exist with these counter-rotating vortices, such as cross stream flow at the internal surfaces
which invade the local boundary layer leading to further flow detachment7, 8, 11-13
disrupting the
flow and creating recirculation zones in the duct. The symmetric counter-rotating vortices can be
described by the inviscid flow equations, caused solely by the turning of the flow. These pressure
driven counter rotating vortices convect the low momentum fluid of the boundary layer towards
the center of the duct impacting flow uniformity and pressure recovery at the face of the engine
located downstream, at the aerodynamics interface plane.
Implementation of passive and active flow control techniques in inlet S-ducts has been an
active field of research2, 11-19
. The predominant forms of actuation are vortex generators, steady
and unsteady jet blowing tangent to the surface, synthetic jet actuators, and many more. Recent
work have studied multiple actuation devices14, 17
including combination of flow control
techniques. Although most of the previous work was focused on circular cross section ducts7-10,
17, 18
, emphasis was also given to rectangular cross section S-ducts5, 11-16
. All of the work
performed with flow control had the objective of improving the pressure recovery and pressure
distribution at the exit of the duct.
As noted by Chen13
the secondary flow phenomena (i.e., a flow with mean streamwise
vorticity) is attributed to two mechanisms: i) the skew-induced, inviscid process, which is caused
by any bend in the flow path of ducts with any cross sectional shape, and ii) a stress-induced
mechanism occurring in any non-circular ducts, straight or not, due to anisotropy of the Reynolds
stresses. Also noted is that further complexity in the flow structure is added by swirl
development in the second bend of the s-duct. This reverse in the curvature is accredited with the
crossover of the transverse velocity component near the side walls, an essentially inviscid
process. Another feature of S-ducts is the reversed pressure gradient caused by the opposite
curvature of the second bend. Therefore, the secondary flow generated by the first bend is
attenuated, being reversed depending on the aggressiveness of the turn (i.e. aspect ratio L/D, the
offset and area ratio between the inlet and the exit sections).
A compact inlet with a high subsonic flow was studied at the Center for Flow, Physics and
Control (CeFPaC) at Rensselaer Polytechnic Institute, with the goal of increasing the pressure
recovery and reducing the flow distortion by using passive and active flow control methods. Due
to the complexity of the interaction between the flow field mechanisms (secondary structures and
recirculating flow) and the actuators, a new experimental setup was designed and built to
decouple the secondary flow structures and the separated flow. Therefore, a deeper
understanding of the interaction between the actuators and the flow field will enable to improve
the actuators efficiency in compact inlet ducts.
DownloadedbyMichaelAmitayonJuly7,2015|http://arc.aiaa.org|DOI:10.2514/6.2015-2484
American Institute of Aeronautics and Astronautics
3
The objective of the current work is to decouple the flow mechanisms in a simplified diffuser
in order to create a canonical flow, and to test different active flow control actuators with the
goal of improving the pressure recovery.
2. Experimental Setup
2.1. Wind Tunnel Facility
The high subsonic facility at the Center for Flow Physics and Control (CeFPaC) at Rensselaer
Polytechnic Institute was utilized in the current experiments. The high subsonic facility is a blow
down, open return wind tunnel. The inlet duct geometry allowed for Mach numbers up to 0.83 (a
mass flow rate up to 2.57 kg/s) although most data presented here was acquired at a Mach
number of 0.7. Figure 1 shows the flow path of the facility and labels each component. The air
through the blower passes a diffuser and the settling chamber. Next, it enters the contraction
followed by the inlet duct (test section), and finally exits the facility through a diffuser.
The blower is a Cincinnati Fan model HP -12G29 run by a 100 HP motor controlled by a
variable frequency drive. The blower produces a volumetric flow rate up to 170 m3
/min. The air
exits the blower and enters the diffuser section that transitions the circular cross-section of the
blower to the square cross-section of the settling chamber. The air is slowed as it enters the
settling chamber where the fluid is conditioned through a set of screens and a honeycomb. In
addition, a thermocouple as well as a static pressure ring were used to monitored the
experiments. The air then enters the contraction section with a contraction ratio of 146:1 and a
conventional 5th
order polynomial curvature.
The air then enters the inlet duct, which has a constant rectangular cross-section with a length
of 300mm for boundary layer growth as well as to measure the inlet Mach number. Another
static pressure ring and a thermocouple were incorporated in this section. Utilizing a one-
dimensional isentropic flow assumption, the inlet Mach number was found from the static
pressure rings at the inlet and the settling chamber. From the total quantities measured in the
settling chamber and the static pressure measured in the inlet, the Mach number from the
isentropic flow assumption is:
Figure 1. Experimental Facility.
DownloadedbyMichaelAmitayonJuly7,2015|http://arc.aiaa.org|DOI:10.2514/6.2015-2484
American Institute of Aeronautics and Astronautics
4
𝑀!"#$% =
!!
!!"#$%
!!!
!
− 1 ∗
!
!!!
(1)
Following the constant area section of the inlet is the test section, which will be discussed in
detail in a later section. Then, the air exits through a diffuser, which has a diffusion angle of 3o
to
slow down the flow and to reduce the total pressure head as the air exits into the open room.
2.2. Test Section
The test section has a length-to-diameter ratio of 1.43 with an initial rectangular cross-section
area of 66.7 mm tall by 152.4 mm wide, which transitions to a square cross-section 145.5 mm by
152.4 mm resulting in an area ratio of Aexit/Ainlet of 2.18. The design allows for easy removal and
exchange of parts. For example, different flow control actuators can be inserted and the windows
can be changed to apply bleed on the walls to make the flow more spatially uniform. The floor is
made from aluminium and incorporated 74 pressure taps to measure the distribution of the static
pressure on the floor. The diffuser ramp has a length of 217.3 mm and its shape was designed to
enable a constant pressure gradient along the ramp.
The diffuser ramp and the floor were instrumented with steady pressure taps (measured using
four Scanivalve DSA3217, 16 channels each, with a full range of ±5 psid) and high frequency
pressure transducers (Kulite models XTL-140 & XCQ-06268 and Endevco model 8510B-5) as
shown in Figure 2. The diffuser ramp was instrumented with 68 steady pressure ports and seven
Endevco dynamic pressure transducers. The floor was instrumented with 74 steady pressure taps
and seven Kulite transducers. At the end of the diffuser ramp (named here “the AIP”), total
pressure measurements were acquired using steady and high frequency transducers, which were
mounted on six specially designed rakes. Each rake contained both the steady and the high
frequency total pressure transducers at five discrete locations (a total of 30 total pressure ports).
Figure 2. Test Section of the Diffuser ramp.
DownloadedbyMichaelAmitayonJuly7,2015|http://arc.aiaa.org|DOI:10.2514/6.2015-2484
American Institute of Aeronautics and Astronautics
5
The static pressures measured from these taps was used to calculate the pressure coefficient
𝐶! at each location. The definition of 𝐶! used here is:
𝐶! =
!
!!!"#$%
!
!
!!"#$%
− 1 (2)
2.3. Suction/Blowing System
As explained previously, one of the goals of this study is to decouple the two flow
mechanisms (i.e., separation and secondary structures) and study the effect of different flow
control actuators on a canonical flow. In order to achieve that, bleed plates were inserted into the
side walls near to the upper and lower corners as shown in Figure 3. These strategic locations
were chosen with the help of CFD simulations. The suction was aspirated normal to the side
walls, through a system of pipes that were connected to a suction pump (see Figure 1 above).
The flowrate through the pipes was monitored using a flowmeter (Dwyer 2000-20VF4), and
controlled with a vacuum pump (PneuPak 13-30-A) through a Variational Frequency Driver
(VFD) to ensure the repeatability of the experiments.
Figure 3. Bleeding Plates incorporated in the side windows.
2.4. Actuation Air Supply System
Flow control actuation was achieved through compressed air injected upstream of the point of
separation. A pressure tank was connected to the building’s compressor, enabling a high volume
of air to be contained at high pressures (up to 110 psig) and released when required. Before
entering the inlet, the air was conditioned and quantified. A filter (5 micron) and a water
separator were installed to clean the air. The air line was equipped with pressure regulators used
to regulate the mass flow, a flow meter (Omega FLMG series, 150 sCFM), a pressure transducer
and a thermocouple (to correct the flow meter reading). These measurements allowed for the
quantification of injected mass flows to the system. Plastic tubing (1/2” in diameter) was then
employed to connect the supply air to the actuators.
DownloadedbyMichaelAmitayonJuly7,2015|http://arc.aiaa.org|DOI:10.2514/6.2015-2484
American Institute of Aeronautics and Astronautics
6
2.5. Flow Control Actuators
Different flow control actuators were used in order to mitigate the flow separation on the
diffuser ramp and thus increase the pressure recovery at the AIP. The actuators presented here
are a pulsed jets array, a sweeping jets array, a steady and an unsteady two-dimensional jet
actuator.
2.5.1. Pulsed Jets Array and Sweeping Jets Array Actuators
The pulsed jets array and sweeping jets array actuators (designed and fabricated by Advanced
Fluidic LLC) provided unsteady jets (see Figure 4). There are 11 inlets through which the flow
enters into cavities with a bi-stable configuration which causes the air to periodically switch from
the left orifice to the right one and vice versa (see Figure 5). The frequency of the switching is a
function of the inlet pressure and the geometry of the actuator.
Figure 4. (a) Pulsed Jets Array; (b) Sweeping Jets Array.
Figure 5. Pulsed Jet Actuator.
2.5.2. A Rotary Valve Based Steady/Unsteady Jet Actuator
In order to obtained either steady or unsteady control jets, a rotary valve actuator was
designed and fabricated (Figure 6). Compressed air was introduced through one side of the
rotary valve body. This body encases a cylindrical rotor, which was driven by an electric DC-
Micromotor (Series 3863 from Faulhaber). The rotor is hollow so that compressed air can flow
through the interior of the rotor and to pass through 10 slots that were machined on the rotor
DownloadedbyMichaelAmitayonJuly7,2015|http://arc.aiaa.org|DOI:10.2514/6.2015-2484
American Institute of Aeronautics and Astronautics
7
circomference. As the rotor spins in the valve body, the rotor slots align periodically with a slot
machined in the rotor housing, which connects the exit of the rotor housing to an actuator. The
rotor was machined from titanium and has a diametral clearance of 0.254 mm to minimize air
leakage and to enable a smooth rotation of the rotor. The DC-Micromotor was coupled to an
encoder which connected to a computer and enabled to adjust the frequency of the unsteady jet.
When steady blowing was desired, the rotor was removed. The rotary valve can generate
unsteady jets with a frequency from 0 to 900 Hz. The air from the cavity enters the injector block
(actuator), whose role is to reduce the flow path area to increase the jet velocity and to redirect
the flow so that it is exits tangential to the inlet wall trough a rectangular slit (Figure 7), creating
a two-dimensional jet. The rectangular slit is located just upstream of the beginning of the
diffuser ramp and it is 152.4 mm in length. In the present work, an orifice width of 1mm was
studied.
Figure 6. Rotor and cavity of the rotary valve.
Figure 7. Cross-Section of the tunnel with the rotary valve and the 2-D Jet.
3. Results
The results presented here are for the baseline and the actuated cases, when the flow control
actuators used were the unsteady and steady two-dimensional jet, the pulsed jets array and the
sweeping jets array. Note that the baseline flow is where no flow control was applied but with
side wall suction (through the bleed plates) at a volumetric flow rate of 100CFM. As discussed
previously, the main objective of this study is to explore the effectiveness of active flow control
DownloadedbyMichaelAmitayonJuly7,2015|http://arc.aiaa.org|DOI:10.2514/6.2015-2484
American Institute of Aeronautics and Astronautics
8
actuators to modify a canonical flow, without the presence of secondary flow structures. Bleed
plates where inserted at the four corners where the secondary structures are the most susceptible
to form and suction through these bleed plates was applied via a vacuum pump. The steady and
unsteady 2D jet actuators were activated at normalized mass flow rate going from 𝑚 = 0.85%
up to 𝑚 = 1.50% , where the mass flow rate of the actuator is defined as:
𝑚 =
!!"#$!#%&
!!"##$%
∙ 100% (3)
The best pressure recovery performance was found to be with the unsteady 2D Jet pulsing at
a frequency of 300Hz and with a mass flow ratio of 𝑚 = 1.50%. Therefore, the following results
will present this case. Figure 8a and b show contour maps of the pressure coefficient on the
diffuser ramp for the baseline and flow control case, respectively, where the flow is from the
bottom to the top. The white dots indicate the pressure ports location, and the rectangle around
the contour map represents the perimeter of the ramp. The normalized streamwise and spanwise
directions are indicated by 𝑥/𝐿 and 𝑧/𝐿, respectively, and the active flow control actuators were
located at the beginning of the ramp, which is defined as the origin, i.e. 𝑥/𝐿 =   0. For both cases,
there is a region , at the beginning of the ramp, of negative pressure coefficient indicating an
acceleration of the flow due to the curvature of the ramp. Farther downstream, there is a region
of quasi-constant pressure coefficient, suggesting flow separation. Actuating the 2-D Jet added
momentum to the flow, which yielded in an increase in the pressure coefficient.
In order to quantify the previous results, Cp lines are plotted in Figure 9, where the lines
represent the streamwise distribution of the pressure coefficient at a different spanwise locations.
Each sub-plot shows the distribution of Cp along the centerline and two additional lines at an
equal distance from the centerline. Moreover, each sub-plot contains data of both the baseline
and flow control cases where the baseline is represented with solid lines and solid symbols, while
the flow control case is with dotted lines and open symbols. It can be seen from these plots that
for the baseline case separation occurates at about 𝑥/𝐿 ≈ 0.4, which means that the flow control
actuators are relatively far away upstream to the separation point. However, using flow control
case delayed the separation to 𝑥/𝐿 ≈ 0.54 and also increased the separation.
Figure 10 shows the pressure coefficient distribution along the ramp for the steady two-
dimensional jet at different mass flow ratios and for the baseline. The suction peak for the flow
control cases is lower than for the baseline showing a larger acceleration due to the injected flow.
In addition, a constant increase of the pressure coefficient value can be seen in the separation
region as the mass flow ration is increased. This linear relationship is quantified in Figure 11.
DownloadedbyMichaelAmitayonJuly7,2015|http://arc.aiaa.org|DOI:10.2514/6.2015-2484
American Institute of Aeronautics and Astronautics
9
Figure 8. Contour map of the pressure coefficient on the ramp. (a) Baseline, and (b) Unsteady 2D Jet with
𝒎=1.50% and 300 Hz.
Figure 9. Cp distributions along the diffuser ramp with and without flow control, along various spanwise
locations: (a) z/D = 0 and ±0.134, (b) z/D = 0 and ±0.257, (c) z/D = 0 and ±0.4, and (d) z/D = 0 and ±0.467.
DownloadedbyMichaelAmitayonJuly7,2015|http://arc.aiaa.org|DOI:10.2514/6.2015-2484
American Institute of Aeronautics and Astronautics
10
Figure 10. Cp distribution along the diffuser ramp for different mass flow ratios with the steady 2D Jet.
Figure 11. Cp value as a function of the mass flow ratio in the separation region.
The distribution of the pressure coefficient on the straight floor was also calculated and is
presented in Figure 12, which shows contour maps of the pressure coefficient, where the flow
direction is from the bottom to the top. As previously, the white dots represent the locations of
the pressure ports, and the rectangle dash-line represents the perimeter of the ramp. The pressure
measurements on the floor start upstream of the ramp. As can be seen, on the floor there is no
separation but the pressure increases as the area cross-section becomes larger. Moreover, the
flow is quasi-two-dimensional. When the unsteady two-dimensional jet is activated, there is an
increase in the pressure coefficient (compared to the baseline), as was seen on the ramp.
Figure 13 shows line plots of the distribution of the pressure coefficients on the floor, where
each line represents the distribution along a constant spanwise location. Each sub-plot shows the
DownloadedbyMichaelAmitayonJuly7,2015|http://arc.aiaa.org|DOI:10.2514/6.2015-2484
American Institute of Aeronautics and Astronautics
11
distribution along the centerline and two additional lines at an equal distance from the centerline.
Furthermore, data for both the baseline case and the actuated cases are presented in each plot.
As can be seen, there is a small suction peak located at 𝑥/𝐿 =  −0.2, which is upstream of the
beginning of the ramp. Moreover, the pressure coefficient increases at a faster rate in the
streamwise direction when the flow control actuators are activated (compared to the baseline
case), as was also seen in the contour maps (Figure 8 above).
Figure 12. Contour map of the pressure coefficient on the floor. (a) Baseline, and (b) Unsteady 2D Jet with
𝒎=1.50% and 300 Hz.
DownloadedbyMichaelAmitayonJuly7,2015|http://arc.aiaa.org|DOI:10.2514/6.2015-2484
American Institute of Aeronautics and Astronautics
12
(a)
Figure 13. Cp distributions along the floor with and without flow control, along various spanwise locations: (a)
z/D = 0 and ±0.23, and (b) z/D = 0 and ±0.46.
As was mentioned in the introduction, the ultimate goal is to increase the pressure recovery at the
end of the ramp. The Pressure Recovery, PR, was calculated and averaged separately for the top
and the bottom of the AIP (i.e., the streamwise cross-section plane at the end of the ramp). For
each of these regions, three rakes with five total pressure transducer on each of them were
located at three spanwise locations . The three spanwise locations are at the centerline 𝑧
𝐷 = 0,  
and 𝑧
𝐷 = ±1/3. The PR is defined as the total pressure at the AIP normalized by the total
pressure at the inlet. Also, the average PR, 𝑃𝑅!"#, is calculated as
𝑃𝑅!"# =   
( !!,!  !"#)/!"!"
!
!!!"#$%
(4)
Figure 14 shows the distribution of PR with the wall-normal distance. Here, y/H = 1 is at the
upper wall and y/H = 0 is at the floor. On the top half and for the baseline, the flow is quasi-two-
dimensional and the pressure recovery is 0.786. As the distance from the upper wall increases
(i.e., towards the core of the flow) the pressure recovery increases and the distribution becomes
slightly asymmetric. By looking at the pressure recovery distribution of the baseline on the
bottom half of the AIP, a PR of 1 can be seen in the freestream region, but it decreases near the
wall which is most likely due to the boundary layer. When the unsteady two-dimensional jet is
activated, there is an increase in the pressure recovery for all measured locations, which is due to
the increase in the pressure coefficient on the diffuser ramp (as was shown in Figure 9).
Moreover, the average PR of the baseline is 𝑃𝑅!!"!"#$%&'$
= 0.786, whereas when the unsteady
two-dimensional jet is used the averaged pressure recovery increases to 𝑃𝑅!!"!!"#$%&'  !!  !"#
=
0.861. Note that due to the location of the two-dimensional jet, which is far upstream to the
separation by 40% from the total length of the ramp, the momentum added by the jet is not high
enough to reattach the flow; however, it does improve the PR by 9.7% compared to the baseline
case. It can be also noticed that the PR of the bottom half is lower than for the baseline by 1.9%
(𝑃𝑅!!"!"#$%&'(  !!  !"#
= 0.959 and 𝑃𝑅!!"!"#$%&'$
= 0.978), which is due to the reattachment on
DownloadedbyMichaelAmitayonJuly7,2015|http://arc.aiaa.org|DOI:10.2514/6.2015-2484
American Institute of Aeronautics and Astronautics
13
the ramp which “pulls” the flow upward and therefore decreases the energy near the floor.
Despite this negative effect on the flow, the overall balance on the pressure recovery is still
higher than for the baseline.
Figure 14. Pressure Recovery distribution at the AIP for the baseline and unsteady 2D jet with 𝒎=1.50% and
fact = 300 Hz.
The pressure recovery increased linearly with the mass flow ratio for the steady two-dimensional
jet actuator as shown in Figure 15. According to this equation, a mass flow ratio of 3.1% would
eventually be needed in order to obtain a Pressure Recovery of 1, meaning that there would be a
full reattachment in the diffuser ramp. This mass flow ratio can be used in the equation from
Figure 11, leading to the result that a pressure coefficient of 1 would be obtained at the AIP. The
meaning is that enough energy would be invested to entirely reattach the flow, but that due to the
diffuser the flow would slow down to a velocity of zero at the end of the diffuser which would
therefore be a stagnation point.
Figure 15. Pressure Recovery average on the top half as a function of the steady 2D Jet mass flow ratio.
DownloadedbyMichaelAmitayonJuly7,2015|http://arc.aiaa.org|DOI:10.2514/6.2015-2484
American Institute of Aeronautics and Astronautics
14
A comparison between the different actuators performances is presented in Figure 16. The
frequency actuation of the unsteady two-dimensional jet actuator is not significant compared to
the steady two-dimensional jet. It is assumed that it is due to the long distance between the jet slit
and the separation point. The cross flow of the wind tunnel interacting with this unsteady flow
leads to a decay of the unsteady component by the time that the actuator flow reaches the
separation point. A new actuator bringing the two-dimensional jet slit closer to the separation
point is currently built in order to use to to our advantage the shedding frequency of the flow.
The “sweeping jets array” and “pulsed jets array” actuators showed similar performance. A mass
flow ratio of 0.65% led to a higher pressure recovery than the two-dimensional jet with a mass
flow ratio of 1%, showing a high potential if a higher mass flow ratio was possible. However, the
flow was chocked, meaning that a higher mass mass flow ratio cannot be obtained without
changing the geometry of these actuators.
Figure 16. Pressure Recovery comparison for the different flow control actuators.
4. Conclusion
A new diffuser apparatus was designed and built where a Mach number up to M = 0.83 can be
achieved. The apparatus was instrumented with multiple steady and unsteady pressure
transducers on the diffuser ramp, on the floor and at the AIP. The symmetry of the baseline flow
was achieved by applying suction at the corners of the rectangular diffuser. Different actuators
were tested, and all of them showed a mitigation of the separation and a higher pressure recovery
than for the baseline. The actuators were sweeping jet array, pulsed jets array, steady and
unsteady two-dimensional jet. The flow conditions for all the experiments were M = 0.7 in the
tunnel, and a suction was applied at the corners. The two-dimensional jet actuator was evaluated
for different mass flow ratios, as well as at steady and unsteady conditions. The steady two-
dimensional jet was tested at 𝑚 = 0.85%, 1%, 1.15%, 1.25% and 1.35%, and the unsteady
two-dimensional jet was tested at 𝑚 = 1%, 1.25% and 1.50% at the frequencies 100Hz, 300Hz,
600Hz and 900Hz. The results showed that the steady and unsteady affected the flow very
DownloadedbyMichaelAmitayonJuly7,2015|http://arc.aiaa.org|DOI:10.2514/6.2015-2484
American Institute of Aeronautics and Astronautics
15
similarly (at the same mass flow rate), where the improvement in pressure recovery (compared to
the baseline) increased with increasing the mass flow rate. It is assumed that the small difference
in pressure recovery between the steady and unsteady case, is due to the long distance between
the location of the two-dimensional jet and the separation point
𝑥
𝐿 = 0  𝑣𝑠   𝑥
𝐿 ≈ 0.4, respectively . The largest performance enhancement was obtained by
the unsteady two-dimensional jet actuator with a mass flow rate ratio of 1.50% and a frequency
of 300Hz, which improved the pressure recovery by 9.7%.
The performance enhancement obtained by either the sweeping jet array or the pulsed jets
array were also tested. It was found that with the current actuators design there is a limit on the
maximum achievable mass flow rate ratio 𝑚 = 0.65% due to the fact that the flow was
chocked at the actuator’s outlet. Still, under this limitation, these actuators yielded a larger
increase in the pressure recovery compared to the two dimensional jet that was activated at a
mass flow ratio of 𝑚 = 1%.
Acknowledgments
The authors would like to thank Anthony Mickalauskas, David Digiulio, Matthew Jadusingh
and Tanzim Imam for their crucial contribution throughout the project. We also would like to
thank the financial support from Northrop Grumman Corporation monitored by Ms. Florine
(Cannelle) Valerie and Peter Sudak.
References
1
Dagget, D. L., Kawai, R., Friedman, D., “Blended Wing Body Systems Studies: Boundary
Layer Ingestion Inlets With Active Flow Control,” Technical Report NASA/CR-2003-212670.
Hampton, VA, 2003.
2
Scribben, A. C., Ng, W., Burdisso, R. “Effectiveness of a Serpentine Inlet Duct Flow Control
Technique at Design and Off-design Simulated Flight Conditions,” Journal of Turbomachinery,
Vol. 128, April 2006, pp. 332-339.
3
Mattingly, J. D., Heiser, W. H., Preatt, D. T., Aircraft Engine Design, AIAA Educational
Series, 2002.
4
Bansod, P., and Bradshaw, P., “The Flow in S-Shaped Ducts,” Aeronautical Quarterly., vol.
23, pp. 131–140, 1972.
5
Launder, B. E., Ying, W. M., “Secondary flows in ducts of square cross-section.” Journal of
Fluid Mechanics, vol. 54, part 2, pp. 289-295, 1972.
6
Enayet, M. M., Gibson, M. M., Taylor A. P., Yianneskis, M., "Laser-Doppler measurements
of laminar and turbulent flow in a pipe bend." International Journal of Heat and Fluid Flow,
Volume 3, Issue 4, pp. 213-219, 1982.
7
Wellborn, S., B. Reichert., T. Okiishi, “An experimental investigation on the flow in a
diffusing s-duct” NASA Technical Memorandum 105809, 1992.
8
Wellborn, S., T. Okiishi, B. Reichert. “A study of the compressible flow through a diffusing
S-Duct.” NASA Technical Memorandum 106411, 1993.
9
Whitelaw, J. H., and S. C. M. Yu. "Velocity measurements in an S-shaped diffusing duct."
Experiments in Fluids, Volume 15, Issue 4-5, pp. 364-367, 1993
10
Whitelaw, J. H., and S. C. M. Yu. "Turbulent flow characteristics in an S-shaped diffusing
duct." Flow Measurement and Instrumentation, vol. 4, no. 3. pp 171-179, 1993
DownloadedbyMichaelAmitayonJuly7,2015|http://arc.aiaa.org|DOI:10.2514/6.2015-2484
American Institute of Aeronautics and Astronautics
16
11
Ng, Y. T., Luo, S. C., Lim, T. T., Ho Q. W., “On the relation between centrifugal force and
radial pressure gradient in flow inside curved and S-shaped ducts.” Physics of Fluids, Volume
20, Issue 5, pp. 055109-055109-15, 2008.
12
Ng, Y. T., S. C. Luo, T. T. Lim, and Q. W. Ho. "On swirl development in a square cross-
sectioned, S-shaped duct." Experiments in Fluids, Volume 6, Issue 41, pp. 975-989, 2006.
13
Chen, Y. “Subsonic Flows through S-Ducts with Flow Control,” PhD Thesis, Department of
Mechanical, Aerospace & Nuclear Engineering, Rensselaer Polytechnic Institute, Troy, NY, July
2012.
14
Vaccaro, J. C., “Flow Control in a Compact Inlet,” PhD Thesis, Department of Mechanical,
Aerospace & Nuclear Engineering, Rensselaer Polytechnic Institute, Troy, NY, April 2011.
15
Debronski, B., “Experimental Investigation of Flow Control Techniques in a Compact Inlet
Duct,” MSc. Dissertation, Department of Mechanical, Aerospace & Nuclear Engineering,
Rensselaer Polytechnic Institute, Troy, NY, December 2012.
16
Amitay, M., Pitt, D., Glezer, A. “Separation Control in Duct Flows.” Journal of Aircraft,
Vol. 39, No. 4, pp. 616-620, 2002
17Gissen, A. N., Vukasinovic, B., McMillan, M. L., Glezer, A., “Dynamics of Hybrid Flow
Control in a Boundary-Layer-Ingesting Offset Diffuser,” AIAA Paper 2011-3096, 41st AIAA
Fluid Dynamics Conference and Exhibit, Honolulu, HI, 2011.
18
Jirasek, A., “Design of Vortex Generator Flow Control in Inlets.” Journal of Aircraft, Vol.
43, No. 6, pp. 1886-1892, 2006
DownloadedbyMichaelAmitayonJuly7,2015|http://arc.aiaa.org|DOI:10.2514/6.2015-2484

Flow Control in a Diffuser at Transonic Conditions

  • 1.
    American Institute ofAeronautics and Astronautics 1 Flow Control in a Diffuser at Transonic Conditions Jeremy Gartner1 and Michael Amitay2 Rensselaer Polytechnic Institute, Troy, NY 12180, USA In some airplanes such as fighter jets and UAVs, short inlet ducts replace the more conventional ducts due to their shorter length. However, these ducts, which are associated with low length-to-diameter ratio and low aspect ratio, experience massive separation and the presence of secondary flow structures. These flow phenomena are undesirable as they lead to pressure losses and distortion at the Aerodynamic Interface Plane (AIP), where the engine face is located. Due to the complex interaction between the separation and the secondary flow structures, it was necessary to first understand the flow mechanisms, and how to control them at a more fundamental level. Therefore, a new diffuser with an upper ramp and a straight floor was designed and built and a canonical flow field was achieved by applying suction at the corners of the rectangular diffuser. The objective of this project was to explore the effectiveness of different flow control techniques in a high subsonic (up to Mach 0.83) diffuser. It was shown that the activation of either a steady or unsteady two- dimensional Jet, located just upstream of the ramp, delayed separation on the ramp and increased the pressure recovery by 9.7% at a Mach number of 0.7 and with a mass flow ratio of 𝒎 = 𝟏. 𝟓𝟎%. In addition to the two-dimensional jet actuator, arrays of sweeping and pulsed jets were also tested. They were evaluated at their maximum mass flow ratio 𝒎 = 𝟎. 𝟔𝟓% . The pressure recovery was increased by 3.7%, suggesting that these two actuators performed better than the two-dimensional jet actuator when it was activated at a mass flow ratio of 𝒎 = 𝟏%. Nomenclature AIP = aerodynamic interface plane 𝒎 = actuator mass flow ratio Minlet = Mach number at the inlet PR = pressure recovery Pinlet = static pressure at the inlet 𝛾 = specific heat ratio Cp = pressure coefficient P0 = total pressure P = static pressure 1. Introduction Heightened interest in short and curved inlet ducts for aircraft has led to further understanding of the flowfield configuration existing in such devices as well as to a better knowledge of the issues faced with their design and operation, as well as novel methods of mitigating these issues. 1 Graduate Student, Department of Mechanical, Aerospace & Nuclear Engineering, 110 8th Street, Troy, NY. AIAA Member. 2 Professor and James L. Decker ’45 Endowed Chair in Aerospace Engineering, and Director of the Center for Flow Physics and Control, 110 8th Street, Troy NY. AIAA Associate Fellow. Corresponding author. Email: amitam@rpi.edu author. DownloadedbyMichaelAmitayonJuly7,2015|http://arc.aiaa.org|DOI:10.2514/6.2015-2484 45th AIAA Fluid Dynamics Conference 22-26 June 2015, Dallas, TX AIAA 2015-2484 Copyright © 2015 by the American Institute of Aeronautics and Astronautics, Inc. All rights reserved. AIAA Aviation
  • 2.
    American Institute ofAeronautics and Astronautics 2 Several factors related to engine and aircraft performance and operation drive the use of short inlet duct designs, such as the overall airframe length reduction enabled by a shorter duct and reduction of frontal planform by incorporating the engine into the airframe. These factors lead to reduction in weight and fuel consumption and allow for innovative external and integrated aerodynamics, such as Blended Wing Bodies1 . Other factors that must be considered are stability margins for operation of a jet engine following the duct, where uneven pressure distribution and secondary flow structures can lead to engine stall at the compressor (surge stall)2, 3 . A considerable body of work is available in the literature concerning the analysis of the flowfield in S-ducts4-12 . This previous research have shed light on the main features of the flowfield existing in aggressively curved ducts, where the rapid curvature in the duct results in cross stream pressure gradients in the direction normal to the turn, leading to the onset of a secondary flow structure composed of two counter rotating vortices. Other structures also co- exist with these counter-rotating vortices, such as cross stream flow at the internal surfaces which invade the local boundary layer leading to further flow detachment7, 8, 11-13 disrupting the flow and creating recirculation zones in the duct. The symmetric counter-rotating vortices can be described by the inviscid flow equations, caused solely by the turning of the flow. These pressure driven counter rotating vortices convect the low momentum fluid of the boundary layer towards the center of the duct impacting flow uniformity and pressure recovery at the face of the engine located downstream, at the aerodynamics interface plane. Implementation of passive and active flow control techniques in inlet S-ducts has been an active field of research2, 11-19 . The predominant forms of actuation are vortex generators, steady and unsteady jet blowing tangent to the surface, synthetic jet actuators, and many more. Recent work have studied multiple actuation devices14, 17 including combination of flow control techniques. Although most of the previous work was focused on circular cross section ducts7-10, 17, 18 , emphasis was also given to rectangular cross section S-ducts5, 11-16 . All of the work performed with flow control had the objective of improving the pressure recovery and pressure distribution at the exit of the duct. As noted by Chen13 the secondary flow phenomena (i.e., a flow with mean streamwise vorticity) is attributed to two mechanisms: i) the skew-induced, inviscid process, which is caused by any bend in the flow path of ducts with any cross sectional shape, and ii) a stress-induced mechanism occurring in any non-circular ducts, straight or not, due to anisotropy of the Reynolds stresses. Also noted is that further complexity in the flow structure is added by swirl development in the second bend of the s-duct. This reverse in the curvature is accredited with the crossover of the transverse velocity component near the side walls, an essentially inviscid process. Another feature of S-ducts is the reversed pressure gradient caused by the opposite curvature of the second bend. Therefore, the secondary flow generated by the first bend is attenuated, being reversed depending on the aggressiveness of the turn (i.e. aspect ratio L/D, the offset and area ratio between the inlet and the exit sections). A compact inlet with a high subsonic flow was studied at the Center for Flow, Physics and Control (CeFPaC) at Rensselaer Polytechnic Institute, with the goal of increasing the pressure recovery and reducing the flow distortion by using passive and active flow control methods. Due to the complexity of the interaction between the flow field mechanisms (secondary structures and recirculating flow) and the actuators, a new experimental setup was designed and built to decouple the secondary flow structures and the separated flow. Therefore, a deeper understanding of the interaction between the actuators and the flow field will enable to improve the actuators efficiency in compact inlet ducts. DownloadedbyMichaelAmitayonJuly7,2015|http://arc.aiaa.org|DOI:10.2514/6.2015-2484
  • 3.
    American Institute ofAeronautics and Astronautics 3 The objective of the current work is to decouple the flow mechanisms in a simplified diffuser in order to create a canonical flow, and to test different active flow control actuators with the goal of improving the pressure recovery. 2. Experimental Setup 2.1. Wind Tunnel Facility The high subsonic facility at the Center for Flow Physics and Control (CeFPaC) at Rensselaer Polytechnic Institute was utilized in the current experiments. The high subsonic facility is a blow down, open return wind tunnel. The inlet duct geometry allowed for Mach numbers up to 0.83 (a mass flow rate up to 2.57 kg/s) although most data presented here was acquired at a Mach number of 0.7. Figure 1 shows the flow path of the facility and labels each component. The air through the blower passes a diffuser and the settling chamber. Next, it enters the contraction followed by the inlet duct (test section), and finally exits the facility through a diffuser. The blower is a Cincinnati Fan model HP -12G29 run by a 100 HP motor controlled by a variable frequency drive. The blower produces a volumetric flow rate up to 170 m3 /min. The air exits the blower and enters the diffuser section that transitions the circular cross-section of the blower to the square cross-section of the settling chamber. The air is slowed as it enters the settling chamber where the fluid is conditioned through a set of screens and a honeycomb. In addition, a thermocouple as well as a static pressure ring were used to monitored the experiments. The air then enters the contraction section with a contraction ratio of 146:1 and a conventional 5th order polynomial curvature. The air then enters the inlet duct, which has a constant rectangular cross-section with a length of 300mm for boundary layer growth as well as to measure the inlet Mach number. Another static pressure ring and a thermocouple were incorporated in this section. Utilizing a one- dimensional isentropic flow assumption, the inlet Mach number was found from the static pressure rings at the inlet and the settling chamber. From the total quantities measured in the settling chamber and the static pressure measured in the inlet, the Mach number from the isentropic flow assumption is: Figure 1. Experimental Facility. DownloadedbyMichaelAmitayonJuly7,2015|http://arc.aiaa.org|DOI:10.2514/6.2015-2484
  • 4.
    American Institute ofAeronautics and Astronautics 4 𝑀!"#$% = !! !!"#$% !!! ! − 1 ∗ ! !!! (1) Following the constant area section of the inlet is the test section, which will be discussed in detail in a later section. Then, the air exits through a diffuser, which has a diffusion angle of 3o to slow down the flow and to reduce the total pressure head as the air exits into the open room. 2.2. Test Section The test section has a length-to-diameter ratio of 1.43 with an initial rectangular cross-section area of 66.7 mm tall by 152.4 mm wide, which transitions to a square cross-section 145.5 mm by 152.4 mm resulting in an area ratio of Aexit/Ainlet of 2.18. The design allows for easy removal and exchange of parts. For example, different flow control actuators can be inserted and the windows can be changed to apply bleed on the walls to make the flow more spatially uniform. The floor is made from aluminium and incorporated 74 pressure taps to measure the distribution of the static pressure on the floor. The diffuser ramp has a length of 217.3 mm and its shape was designed to enable a constant pressure gradient along the ramp. The diffuser ramp and the floor were instrumented with steady pressure taps (measured using four Scanivalve DSA3217, 16 channels each, with a full range of ±5 psid) and high frequency pressure transducers (Kulite models XTL-140 & XCQ-06268 and Endevco model 8510B-5) as shown in Figure 2. The diffuser ramp was instrumented with 68 steady pressure ports and seven Endevco dynamic pressure transducers. The floor was instrumented with 74 steady pressure taps and seven Kulite transducers. At the end of the diffuser ramp (named here “the AIP”), total pressure measurements were acquired using steady and high frequency transducers, which were mounted on six specially designed rakes. Each rake contained both the steady and the high frequency total pressure transducers at five discrete locations (a total of 30 total pressure ports). Figure 2. Test Section of the Diffuser ramp. DownloadedbyMichaelAmitayonJuly7,2015|http://arc.aiaa.org|DOI:10.2514/6.2015-2484
  • 5.
    American Institute ofAeronautics and Astronautics 5 The static pressures measured from these taps was used to calculate the pressure coefficient 𝐶! at each location. The definition of 𝐶! used here is: 𝐶! = ! !!!"#$% ! ! !!"#$% − 1 (2) 2.3. Suction/Blowing System As explained previously, one of the goals of this study is to decouple the two flow mechanisms (i.e., separation and secondary structures) and study the effect of different flow control actuators on a canonical flow. In order to achieve that, bleed plates were inserted into the side walls near to the upper and lower corners as shown in Figure 3. These strategic locations were chosen with the help of CFD simulations. The suction was aspirated normal to the side walls, through a system of pipes that were connected to a suction pump (see Figure 1 above). The flowrate through the pipes was monitored using a flowmeter (Dwyer 2000-20VF4), and controlled with a vacuum pump (PneuPak 13-30-A) through a Variational Frequency Driver (VFD) to ensure the repeatability of the experiments. Figure 3. Bleeding Plates incorporated in the side windows. 2.4. Actuation Air Supply System Flow control actuation was achieved through compressed air injected upstream of the point of separation. A pressure tank was connected to the building’s compressor, enabling a high volume of air to be contained at high pressures (up to 110 psig) and released when required. Before entering the inlet, the air was conditioned and quantified. A filter (5 micron) and a water separator were installed to clean the air. The air line was equipped with pressure regulators used to regulate the mass flow, a flow meter (Omega FLMG series, 150 sCFM), a pressure transducer and a thermocouple (to correct the flow meter reading). These measurements allowed for the quantification of injected mass flows to the system. Plastic tubing (1/2” in diameter) was then employed to connect the supply air to the actuators. DownloadedbyMichaelAmitayonJuly7,2015|http://arc.aiaa.org|DOI:10.2514/6.2015-2484
  • 6.
    American Institute ofAeronautics and Astronautics 6 2.5. Flow Control Actuators Different flow control actuators were used in order to mitigate the flow separation on the diffuser ramp and thus increase the pressure recovery at the AIP. The actuators presented here are a pulsed jets array, a sweeping jets array, a steady and an unsteady two-dimensional jet actuator. 2.5.1. Pulsed Jets Array and Sweeping Jets Array Actuators The pulsed jets array and sweeping jets array actuators (designed and fabricated by Advanced Fluidic LLC) provided unsteady jets (see Figure 4). There are 11 inlets through which the flow enters into cavities with a bi-stable configuration which causes the air to periodically switch from the left orifice to the right one and vice versa (see Figure 5). The frequency of the switching is a function of the inlet pressure and the geometry of the actuator. Figure 4. (a) Pulsed Jets Array; (b) Sweeping Jets Array. Figure 5. Pulsed Jet Actuator. 2.5.2. A Rotary Valve Based Steady/Unsteady Jet Actuator In order to obtained either steady or unsteady control jets, a rotary valve actuator was designed and fabricated (Figure 6). Compressed air was introduced through one side of the rotary valve body. This body encases a cylindrical rotor, which was driven by an electric DC- Micromotor (Series 3863 from Faulhaber). The rotor is hollow so that compressed air can flow through the interior of the rotor and to pass through 10 slots that were machined on the rotor DownloadedbyMichaelAmitayonJuly7,2015|http://arc.aiaa.org|DOI:10.2514/6.2015-2484
  • 7.
    American Institute ofAeronautics and Astronautics 7 circomference. As the rotor spins in the valve body, the rotor slots align periodically with a slot machined in the rotor housing, which connects the exit of the rotor housing to an actuator. The rotor was machined from titanium and has a diametral clearance of 0.254 mm to minimize air leakage and to enable a smooth rotation of the rotor. The DC-Micromotor was coupled to an encoder which connected to a computer and enabled to adjust the frequency of the unsteady jet. When steady blowing was desired, the rotor was removed. The rotary valve can generate unsteady jets with a frequency from 0 to 900 Hz. The air from the cavity enters the injector block (actuator), whose role is to reduce the flow path area to increase the jet velocity and to redirect the flow so that it is exits tangential to the inlet wall trough a rectangular slit (Figure 7), creating a two-dimensional jet. The rectangular slit is located just upstream of the beginning of the diffuser ramp and it is 152.4 mm in length. In the present work, an orifice width of 1mm was studied. Figure 6. Rotor and cavity of the rotary valve. Figure 7. Cross-Section of the tunnel with the rotary valve and the 2-D Jet. 3. Results The results presented here are for the baseline and the actuated cases, when the flow control actuators used were the unsteady and steady two-dimensional jet, the pulsed jets array and the sweeping jets array. Note that the baseline flow is where no flow control was applied but with side wall suction (through the bleed plates) at a volumetric flow rate of 100CFM. As discussed previously, the main objective of this study is to explore the effectiveness of active flow control DownloadedbyMichaelAmitayonJuly7,2015|http://arc.aiaa.org|DOI:10.2514/6.2015-2484
  • 8.
    American Institute ofAeronautics and Astronautics 8 actuators to modify a canonical flow, without the presence of secondary flow structures. Bleed plates where inserted at the four corners where the secondary structures are the most susceptible to form and suction through these bleed plates was applied via a vacuum pump. The steady and unsteady 2D jet actuators were activated at normalized mass flow rate going from 𝑚 = 0.85% up to 𝑚 = 1.50% , where the mass flow rate of the actuator is defined as: 𝑚 = !!"#$!#%& !!"##$% ∙ 100% (3) The best pressure recovery performance was found to be with the unsteady 2D Jet pulsing at a frequency of 300Hz and with a mass flow ratio of 𝑚 = 1.50%. Therefore, the following results will present this case. Figure 8a and b show contour maps of the pressure coefficient on the diffuser ramp for the baseline and flow control case, respectively, where the flow is from the bottom to the top. The white dots indicate the pressure ports location, and the rectangle around the contour map represents the perimeter of the ramp. The normalized streamwise and spanwise directions are indicated by 𝑥/𝐿 and 𝑧/𝐿, respectively, and the active flow control actuators were located at the beginning of the ramp, which is defined as the origin, i.e. 𝑥/𝐿 =  0. For both cases, there is a region , at the beginning of the ramp, of negative pressure coefficient indicating an acceleration of the flow due to the curvature of the ramp. Farther downstream, there is a region of quasi-constant pressure coefficient, suggesting flow separation. Actuating the 2-D Jet added momentum to the flow, which yielded in an increase in the pressure coefficient. In order to quantify the previous results, Cp lines are plotted in Figure 9, where the lines represent the streamwise distribution of the pressure coefficient at a different spanwise locations. Each sub-plot shows the distribution of Cp along the centerline and two additional lines at an equal distance from the centerline. Moreover, each sub-plot contains data of both the baseline and flow control cases where the baseline is represented with solid lines and solid symbols, while the flow control case is with dotted lines and open symbols. It can be seen from these plots that for the baseline case separation occurates at about 𝑥/𝐿 ≈ 0.4, which means that the flow control actuators are relatively far away upstream to the separation point. However, using flow control case delayed the separation to 𝑥/𝐿 ≈ 0.54 and also increased the separation. Figure 10 shows the pressure coefficient distribution along the ramp for the steady two- dimensional jet at different mass flow ratios and for the baseline. The suction peak for the flow control cases is lower than for the baseline showing a larger acceleration due to the injected flow. In addition, a constant increase of the pressure coefficient value can be seen in the separation region as the mass flow ration is increased. This linear relationship is quantified in Figure 11. DownloadedbyMichaelAmitayonJuly7,2015|http://arc.aiaa.org|DOI:10.2514/6.2015-2484
  • 9.
    American Institute ofAeronautics and Astronautics 9 Figure 8. Contour map of the pressure coefficient on the ramp. (a) Baseline, and (b) Unsteady 2D Jet with 𝒎=1.50% and 300 Hz. Figure 9. Cp distributions along the diffuser ramp with and without flow control, along various spanwise locations: (a) z/D = 0 and ±0.134, (b) z/D = 0 and ±0.257, (c) z/D = 0 and ±0.4, and (d) z/D = 0 and ±0.467. DownloadedbyMichaelAmitayonJuly7,2015|http://arc.aiaa.org|DOI:10.2514/6.2015-2484
  • 10.
    American Institute ofAeronautics and Astronautics 10 Figure 10. Cp distribution along the diffuser ramp for different mass flow ratios with the steady 2D Jet. Figure 11. Cp value as a function of the mass flow ratio in the separation region. The distribution of the pressure coefficient on the straight floor was also calculated and is presented in Figure 12, which shows contour maps of the pressure coefficient, where the flow direction is from the bottom to the top. As previously, the white dots represent the locations of the pressure ports, and the rectangle dash-line represents the perimeter of the ramp. The pressure measurements on the floor start upstream of the ramp. As can be seen, on the floor there is no separation but the pressure increases as the area cross-section becomes larger. Moreover, the flow is quasi-two-dimensional. When the unsteady two-dimensional jet is activated, there is an increase in the pressure coefficient (compared to the baseline), as was seen on the ramp. Figure 13 shows line plots of the distribution of the pressure coefficients on the floor, where each line represents the distribution along a constant spanwise location. Each sub-plot shows the DownloadedbyMichaelAmitayonJuly7,2015|http://arc.aiaa.org|DOI:10.2514/6.2015-2484
  • 11.
    American Institute ofAeronautics and Astronautics 11 distribution along the centerline and two additional lines at an equal distance from the centerline. Furthermore, data for both the baseline case and the actuated cases are presented in each plot. As can be seen, there is a small suction peak located at 𝑥/𝐿 =  −0.2, which is upstream of the beginning of the ramp. Moreover, the pressure coefficient increases at a faster rate in the streamwise direction when the flow control actuators are activated (compared to the baseline case), as was also seen in the contour maps (Figure 8 above). Figure 12. Contour map of the pressure coefficient on the floor. (a) Baseline, and (b) Unsteady 2D Jet with 𝒎=1.50% and 300 Hz. DownloadedbyMichaelAmitayonJuly7,2015|http://arc.aiaa.org|DOI:10.2514/6.2015-2484
  • 12.
    American Institute ofAeronautics and Astronautics 12 (a) Figure 13. Cp distributions along the floor with and without flow control, along various spanwise locations: (a) z/D = 0 and ±0.23, and (b) z/D = 0 and ±0.46. As was mentioned in the introduction, the ultimate goal is to increase the pressure recovery at the end of the ramp. The Pressure Recovery, PR, was calculated and averaged separately for the top and the bottom of the AIP (i.e., the streamwise cross-section plane at the end of the ramp). For each of these regions, three rakes with five total pressure transducer on each of them were located at three spanwise locations . The three spanwise locations are at the centerline 𝑧 𝐷 = 0,   and 𝑧 𝐷 = ±1/3. The PR is defined as the total pressure at the AIP normalized by the total pressure at the inlet. Also, the average PR, 𝑃𝑅!"#, is calculated as 𝑃𝑅!"# =   ( !!,!  !"#)/!"!" ! !!!"#$% (4) Figure 14 shows the distribution of PR with the wall-normal distance. Here, y/H = 1 is at the upper wall and y/H = 0 is at the floor. On the top half and for the baseline, the flow is quasi-two- dimensional and the pressure recovery is 0.786. As the distance from the upper wall increases (i.e., towards the core of the flow) the pressure recovery increases and the distribution becomes slightly asymmetric. By looking at the pressure recovery distribution of the baseline on the bottom half of the AIP, a PR of 1 can be seen in the freestream region, but it decreases near the wall which is most likely due to the boundary layer. When the unsteady two-dimensional jet is activated, there is an increase in the pressure recovery for all measured locations, which is due to the increase in the pressure coefficient on the diffuser ramp (as was shown in Figure 9). Moreover, the average PR of the baseline is 𝑃𝑅!!"!"#$%&'$ = 0.786, whereas when the unsteady two-dimensional jet is used the averaged pressure recovery increases to 𝑃𝑅!!"!!"#$%&'  !!  !"# = 0.861. Note that due to the location of the two-dimensional jet, which is far upstream to the separation by 40% from the total length of the ramp, the momentum added by the jet is not high enough to reattach the flow; however, it does improve the PR by 9.7% compared to the baseline case. It can be also noticed that the PR of the bottom half is lower than for the baseline by 1.9% (𝑃𝑅!!"!"#$%&'(  !!  !"# = 0.959 and 𝑃𝑅!!"!"#$%&'$ = 0.978), which is due to the reattachment on DownloadedbyMichaelAmitayonJuly7,2015|http://arc.aiaa.org|DOI:10.2514/6.2015-2484
  • 13.
    American Institute ofAeronautics and Astronautics 13 the ramp which “pulls” the flow upward and therefore decreases the energy near the floor. Despite this negative effect on the flow, the overall balance on the pressure recovery is still higher than for the baseline. Figure 14. Pressure Recovery distribution at the AIP for the baseline and unsteady 2D jet with 𝒎=1.50% and fact = 300 Hz. The pressure recovery increased linearly with the mass flow ratio for the steady two-dimensional jet actuator as shown in Figure 15. According to this equation, a mass flow ratio of 3.1% would eventually be needed in order to obtain a Pressure Recovery of 1, meaning that there would be a full reattachment in the diffuser ramp. This mass flow ratio can be used in the equation from Figure 11, leading to the result that a pressure coefficient of 1 would be obtained at the AIP. The meaning is that enough energy would be invested to entirely reattach the flow, but that due to the diffuser the flow would slow down to a velocity of zero at the end of the diffuser which would therefore be a stagnation point. Figure 15. Pressure Recovery average on the top half as a function of the steady 2D Jet mass flow ratio. DownloadedbyMichaelAmitayonJuly7,2015|http://arc.aiaa.org|DOI:10.2514/6.2015-2484
  • 14.
    American Institute ofAeronautics and Astronautics 14 A comparison between the different actuators performances is presented in Figure 16. The frequency actuation of the unsteady two-dimensional jet actuator is not significant compared to the steady two-dimensional jet. It is assumed that it is due to the long distance between the jet slit and the separation point. The cross flow of the wind tunnel interacting with this unsteady flow leads to a decay of the unsteady component by the time that the actuator flow reaches the separation point. A new actuator bringing the two-dimensional jet slit closer to the separation point is currently built in order to use to to our advantage the shedding frequency of the flow. The “sweeping jets array” and “pulsed jets array” actuators showed similar performance. A mass flow ratio of 0.65% led to a higher pressure recovery than the two-dimensional jet with a mass flow ratio of 1%, showing a high potential if a higher mass flow ratio was possible. However, the flow was chocked, meaning that a higher mass mass flow ratio cannot be obtained without changing the geometry of these actuators. Figure 16. Pressure Recovery comparison for the different flow control actuators. 4. Conclusion A new diffuser apparatus was designed and built where a Mach number up to M = 0.83 can be achieved. The apparatus was instrumented with multiple steady and unsteady pressure transducers on the diffuser ramp, on the floor and at the AIP. The symmetry of the baseline flow was achieved by applying suction at the corners of the rectangular diffuser. Different actuators were tested, and all of them showed a mitigation of the separation and a higher pressure recovery than for the baseline. The actuators were sweeping jet array, pulsed jets array, steady and unsteady two-dimensional jet. The flow conditions for all the experiments were M = 0.7 in the tunnel, and a suction was applied at the corners. The two-dimensional jet actuator was evaluated for different mass flow ratios, as well as at steady and unsteady conditions. The steady two- dimensional jet was tested at 𝑚 = 0.85%, 1%, 1.15%, 1.25% and 1.35%, and the unsteady two-dimensional jet was tested at 𝑚 = 1%, 1.25% and 1.50% at the frequencies 100Hz, 300Hz, 600Hz and 900Hz. The results showed that the steady and unsteady affected the flow very DownloadedbyMichaelAmitayonJuly7,2015|http://arc.aiaa.org|DOI:10.2514/6.2015-2484
  • 15.
    American Institute ofAeronautics and Astronautics 15 similarly (at the same mass flow rate), where the improvement in pressure recovery (compared to the baseline) increased with increasing the mass flow rate. It is assumed that the small difference in pressure recovery between the steady and unsteady case, is due to the long distance between the location of the two-dimensional jet and the separation point 𝑥 𝐿 = 0  𝑣𝑠   𝑥 𝐿 ≈ 0.4, respectively . The largest performance enhancement was obtained by the unsteady two-dimensional jet actuator with a mass flow rate ratio of 1.50% and a frequency of 300Hz, which improved the pressure recovery by 9.7%. The performance enhancement obtained by either the sweeping jet array or the pulsed jets array were also tested. It was found that with the current actuators design there is a limit on the maximum achievable mass flow rate ratio 𝑚 = 0.65% due to the fact that the flow was chocked at the actuator’s outlet. Still, under this limitation, these actuators yielded a larger increase in the pressure recovery compared to the two dimensional jet that was activated at a mass flow ratio of 𝑚 = 1%. Acknowledgments The authors would like to thank Anthony Mickalauskas, David Digiulio, Matthew Jadusingh and Tanzim Imam for their crucial contribution throughout the project. We also would like to thank the financial support from Northrop Grumman Corporation monitored by Ms. Florine (Cannelle) Valerie and Peter Sudak. References 1 Dagget, D. L., Kawai, R., Friedman, D., “Blended Wing Body Systems Studies: Boundary Layer Ingestion Inlets With Active Flow Control,” Technical Report NASA/CR-2003-212670. Hampton, VA, 2003. 2 Scribben, A. C., Ng, W., Burdisso, R. “Effectiveness of a Serpentine Inlet Duct Flow Control Technique at Design and Off-design Simulated Flight Conditions,” Journal of Turbomachinery, Vol. 128, April 2006, pp. 332-339. 3 Mattingly, J. D., Heiser, W. H., Preatt, D. T., Aircraft Engine Design, AIAA Educational Series, 2002. 4 Bansod, P., and Bradshaw, P., “The Flow in S-Shaped Ducts,” Aeronautical Quarterly., vol. 23, pp. 131–140, 1972. 5 Launder, B. E., Ying, W. M., “Secondary flows in ducts of square cross-section.” Journal of Fluid Mechanics, vol. 54, part 2, pp. 289-295, 1972. 6 Enayet, M. M., Gibson, M. M., Taylor A. P., Yianneskis, M., "Laser-Doppler measurements of laminar and turbulent flow in a pipe bend." International Journal of Heat and Fluid Flow, Volume 3, Issue 4, pp. 213-219, 1982. 7 Wellborn, S., B. Reichert., T. Okiishi, “An experimental investigation on the flow in a diffusing s-duct” NASA Technical Memorandum 105809, 1992. 8 Wellborn, S., T. Okiishi, B. Reichert. “A study of the compressible flow through a diffusing S-Duct.” NASA Technical Memorandum 106411, 1993. 9 Whitelaw, J. H., and S. C. M. Yu. "Velocity measurements in an S-shaped diffusing duct." Experiments in Fluids, Volume 15, Issue 4-5, pp. 364-367, 1993 10 Whitelaw, J. H., and S. C. M. Yu. "Turbulent flow characteristics in an S-shaped diffusing duct." Flow Measurement and Instrumentation, vol. 4, no. 3. pp 171-179, 1993 DownloadedbyMichaelAmitayonJuly7,2015|http://arc.aiaa.org|DOI:10.2514/6.2015-2484
  • 16.
    American Institute ofAeronautics and Astronautics 16 11 Ng, Y. T., Luo, S. C., Lim, T. T., Ho Q. W., “On the relation between centrifugal force and radial pressure gradient in flow inside curved and S-shaped ducts.” Physics of Fluids, Volume 20, Issue 5, pp. 055109-055109-15, 2008. 12 Ng, Y. T., S. C. Luo, T. T. Lim, and Q. W. Ho. "On swirl development in a square cross- sectioned, S-shaped duct." Experiments in Fluids, Volume 6, Issue 41, pp. 975-989, 2006. 13 Chen, Y. “Subsonic Flows through S-Ducts with Flow Control,” PhD Thesis, Department of Mechanical, Aerospace & Nuclear Engineering, Rensselaer Polytechnic Institute, Troy, NY, July 2012. 14 Vaccaro, J. C., “Flow Control in a Compact Inlet,” PhD Thesis, Department of Mechanical, Aerospace & Nuclear Engineering, Rensselaer Polytechnic Institute, Troy, NY, April 2011. 15 Debronski, B., “Experimental Investigation of Flow Control Techniques in a Compact Inlet Duct,” MSc. Dissertation, Department of Mechanical, Aerospace & Nuclear Engineering, Rensselaer Polytechnic Institute, Troy, NY, December 2012. 16 Amitay, M., Pitt, D., Glezer, A. “Separation Control in Duct Flows.” Journal of Aircraft, Vol. 39, No. 4, pp. 616-620, 2002 17Gissen, A. N., Vukasinovic, B., McMillan, M. L., Glezer, A., “Dynamics of Hybrid Flow Control in a Boundary-Layer-Ingesting Offset Diffuser,” AIAA Paper 2011-3096, 41st AIAA Fluid Dynamics Conference and Exhibit, Honolulu, HI, 2011. 18 Jirasek, A., “Design of Vortex Generator Flow Control in Inlets.” Journal of Aircraft, Vol. 43, No. 6, pp. 1886-1892, 2006 DownloadedbyMichaelAmitayonJuly7,2015|http://arc.aiaa.org|DOI:10.2514/6.2015-2484