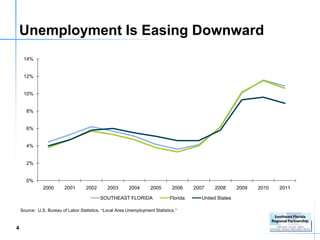
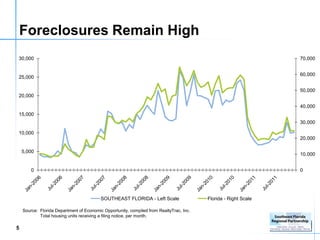
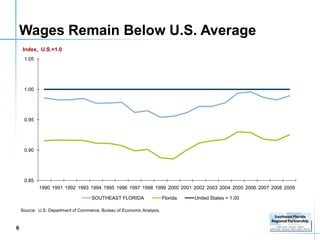
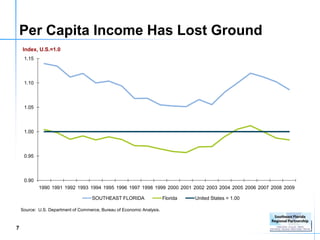
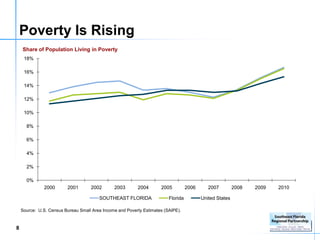
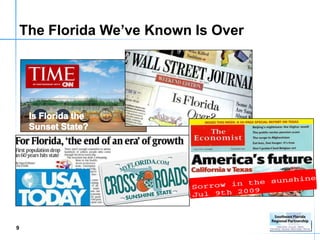
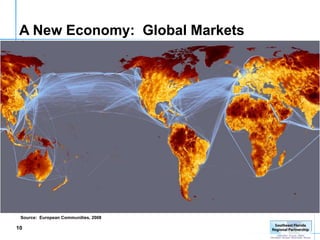
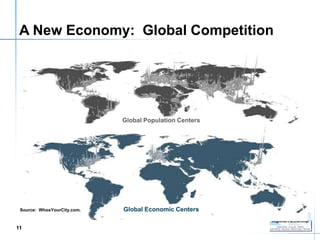
Southeast Florida Regional Vision &
Blueprint for Economic Prosperity
Economic Development Briefing


John Kaliski
Cambridge Systematics, Inc.


February 15, 2012
Presentation Outline

     Current realities

     Global trends

     Opportunities and
     challenges for
     Southeast Florida

     How do we get started?


Source: Florida Trend.


1
Employment Growth Has Resumed
     Year-Over-Year Percent Change
       8%


       6%


       4%


       2%


       0%
            2002       2003         2004         2005         2006         2007            2008       2009   2010   2011

      -2%


      -4%


      -6%


      -8%

                                           SOUTHEAST FLORIDA                Florida         United States

    Source: U.S. Bureau of Labor Statistics, “Quarterly Census of Employment and Wages.”


2
Recent Growth Led by Services
     Annual Change in Jobs, 2010-2011 (Thousands)

       Leisure and Hospitality

Healthcare and Education

        Professional Services

                           Retail

    Logistics and Distribution

                         Finance

                     Information

                 Manufacturing

                   Government

                   Construction

                                    -6         -4   -2   0   2   4   6   8   10   12


    Source: U.S. Bureau of Labor Statistics.


3
Unemployment Is Easing Downward
     14%


     12%


     10%


       8%


       6%


       4%


       2%


       0%
               2000      2001       2002       2003       2004      2005       2006     2007    2008       2009   2010   2011

                                           SOUTHEAST FLORIDA                  Florida      United States

    Source: U.S. Bureau of Labor Statistics, “Local Area Unemployment Statistics.”


4
Foreclosures Remain High
30,000                                                                                                           70,000


                                                                                                                 60,000
25,000

                                                                                                                 50,000
20,000

                                                                                                                 40,000
15,000
                                                                                                                 30,000

10,000
                                                                                                                 20,000

    5,000
                                                                                                                 10,000


        0                                                                                                        0


                                          SOUTHEAST FLORIDA - Left Scale                 Florida - Right Scale

    Source: Florida Department of Economic Opportunity, compiled from RealtyTrac, Inc.
            Total housing units receiving a filing notice, per month.

5
Wages Remain Below U.S. Average
    Index, U.S.=1.0
     1.05


     1.00


     0.95


     0.90


     0.85
            1990 1991 1992 1993 1994 1995 1996 1997 1998 1999 2000 2001 2002 2003 2004 2005 2006 2007 2008 2009

                                     SOUTHEAST FLORIDA                  Florida   United States = 1.00

    Source: U.S. Department of Commerce, Bureau of Economic Analysis.


6
Per Capita Income Has Lost Ground
    Index, U.S.=1.0
     1.15


     1.10


     1.05


     1.00


     0.95


     0.90
            1990 1991 1992 1993 1994 1995 1996 1997 1998 1999 2000 2001 2002 2003 2004 2005 2006 2007 2008 2009

                                     SOUTHEAST FLORIDA                  Florida   United States = 1.00

    Source: U.S. Department of Commerce, Bureau of Economic Analysis.


7
Poverty Is Rising
    Share of Population Living in Poverty
     18%

     16%

     14%

     12%

     10%

      8%

      6%

      4%

      2%

      0%
              2000       2001       2002       2003       2004       2005          2006      2007         2008   2009   2010

                                        SOUTHEAST FLORIDA                Florida          United States

    Source: U.S. Census Bureau Small Area Income and Poverty Estimates (SAIPE).


8
The Florida We’ve Known Is Over


9
A New Economy: Global Markets


 Source: European Communities, 2008

10
A New Economy: Global Competition


                             Global Population Centers


 Source: WhosYourCity.com.   Global Economic Centers

11
A New Economy: Regions, Megaregions


     Source: America 2050.
12                                     12
                             12
How Do We Compete?
 Florida then…          Florida now…

 • Low-cost labor       • World-class talent

 • Production           • Innovation

 • Location             • Global
   and land               connections

 • Low cost of living   • Quality places

 • Natural              • Sustainable
   resources              environment

 • Individual           • Integrated
   communities            regions
13                                         13
Changing Industry Mix


                                                 Innovation
                                                & Technology


      Tourism     Construction          Business &
                                                      Community
                                         Personal
                                                      Development
                                          Travel


            Agriculture          Global Trade                  Financial and
                                      &         Agriculture    Professional
                                  Logistics                       Services

     Past
                                                 Future?
14
Opportunity: Global Trade
     Value of Exports and Imports (In Billions)
     $120


     $100


      $80


      $60


      $40


      $20


       $0
             2000     2001      2002       2003      2004      2005       2006      2007       2008      2009       2010   2011

                                                            Exports    Imports

 Source: WISERTrade based on U.S. Census Bureau foreign trade data; Value of trade through the Miami Customs District.


15
Opportunity: Tourism & Travel
     Annual Overseas Visitors to Miami (In Millions)
      3.5


      3.0


      2.5


      2.0


      1.5


      1.0


      0.5


      0.0
             2000      2001        2002       2003       2004        2005   2006   2007   2008   2009   2010


 Source: U.S. Department of Commerce, International Trade Administration.


16
Global Connectivity Is Critical


17
Opportunity: Innovation


18
Challenge: Talent Supply

     10…                                6…               3…                   2…


…students in a                    …graduate from   …continue to college …earn college credit
9th grade class                    high school      within two years     within two years
        2002                                2005           2007                 2009

 Source: Florida Board of Education 2011.


19
Challenge: Workforce Skills
 Educational Attainment 2006-2010
                                                   Population over 25...
      …with less than a                    …with HS, Associate’s degree,                      …with a Bachelor’s degree,
     High School degree                          or some college                                      or higher


                   17%                                                                  55%                          28%

                                                    Southeast Florida Region


                 15%                                                                      59%                        26%

                                                              Florida


                 15%                                                                    57%                          28%

                                                          United States


 Source: U.S. Census Bureau, American Community Survey 2006-2010 five-year estimates.


20
Opportunity: Community of Choice
                  2009
                  2000
                  1990
                  1980
                  1970
                  1960


21
Challenge: Mobility


     Source: Florida Department of Transportation.


22
How Do We Get Started?

     Align state, regional, and local plans around a common
     framework

     Create 5 year action plan pointing toward a 50-year vision

     Integrate with other regions to build Florida’s megaregion

     Measure and report progress


23
25
Six Pillars Communities


26
Florida’s New Statewide Economic
 Development Structure


27
Alignment of State, Regional, Local Plans

     Statewide Strategic Plan for
     Economic Development
     » Coordinated with 2030 Six Pillars
       Plan and 2060 Statewide Vision

     Regional Comprehensive Economic
     Development Strategy
     » Joint effort of
       South Florida and
       Treasure Coast RPCs
     » Input into Regional Vision
       and Blueprint for Economic
       Prosperity

28

Florida Economic Development Briefing

  • 1.
    Southeast Florida RegionalVision & Blueprint for Economic Prosperity Economic Development Briefing John Kaliski Cambridge Systematics, Inc. February 15, 2012
  • 2.
    Presentation Outline Current realities Global trends Opportunities and challenges for Southeast Florida How do we get started? Source: Florida Trend. 1
  • 3.
    Employment Growth HasResumed Year-Over-Year Percent Change 8% 6% 4% 2% 0% 2002 2003 2004 2005 2006 2007 2008 2009 2010 2011 -2% -4% -6% -8% SOUTHEAST FLORIDA Florida United States Source: U.S. Bureau of Labor Statistics, “Quarterly Census of Employment and Wages.” 2
  • 4.
    Recent Growth Ledby Services Annual Change in Jobs, 2010-2011 (Thousands) Leisure and Hospitality Healthcare and Education Professional Services Retail Logistics and Distribution Finance Information Manufacturing Government Construction -6 -4 -2 0 2 4 6 8 10 12 Source: U.S. Bureau of Labor Statistics. 3
  • 5.
    Unemployment Is EasingDownward 14% 12% 10% 8% 6% 4% 2% 0% 2000 2001 2002 2003 2004 2005 2006 2007 2008 2009 2010 2011 SOUTHEAST FLORIDA Florida United States Source: U.S. Bureau of Labor Statistics, “Local Area Unemployment Statistics.” 4
  • 6.
    Foreclosures Remain High 30,000 70,000 60,000 25,000 50,000 20,000 40,000 15,000 30,000 10,000 20,000 5,000 10,000 0 0 SOUTHEAST FLORIDA - Left Scale Florida - Right Scale Source: Florida Department of Economic Opportunity, compiled from RealtyTrac, Inc. Total housing units receiving a filing notice, per month. 5
  • 7.
    Wages Remain BelowU.S. Average Index, U.S.=1.0 1.05 1.00 0.95 0.90 0.85 1990 1991 1992 1993 1994 1995 1996 1997 1998 1999 2000 2001 2002 2003 2004 2005 2006 2007 2008 2009 SOUTHEAST FLORIDA Florida United States = 1.00 Source: U.S. Department of Commerce, Bureau of Economic Analysis. 6
  • 8.
    Per Capita IncomeHas Lost Ground Index, U.S.=1.0 1.15 1.10 1.05 1.00 0.95 0.90 1990 1991 1992 1993 1994 1995 1996 1997 1998 1999 2000 2001 2002 2003 2004 2005 2006 2007 2008 2009 SOUTHEAST FLORIDA Florida United States = 1.00 Source: U.S. Department of Commerce, Bureau of Economic Analysis. 7
  • 9.
    Poverty Is Rising Share of Population Living in Poverty 18% 16% 14% 12% 10% 8% 6% 4% 2% 0% 2000 2001 2002 2003 2004 2005 2006 2007 2008 2009 2010 SOUTHEAST FLORIDA Florida United States Source: U.S. Census Bureau Small Area Income and Poverty Estimates (SAIPE). 8
  • 10.
    The Florida We’veKnown Is Over 9
  • 11.
    A New Economy:Global Markets Source: European Communities, 2008 10
  • 12.
    A New Economy:Global Competition Global Population Centers Source: WhosYourCity.com. Global Economic Centers 11
  • 13.
    A New Economy:Regions, Megaregions Source: America 2050. 12 12 12
  • 14.
    How Do WeCompete? Florida then… Florida now… • Low-cost labor • World-class talent • Production • Innovation • Location • Global and land connections • Low cost of living • Quality places • Natural • Sustainable resources environment • Individual • Integrated communities regions 13 13
  • 15.
    Changing Industry Mix Innovation & Technology Tourism Construction Business & Community Personal Development Travel Agriculture Global Trade Financial and & Agriculture Professional Logistics Services Past Future? 14
  • 16.
    Opportunity: Global Trade Value of Exports and Imports (In Billions) $120 $100 $80 $60 $40 $20 $0 2000 2001 2002 2003 2004 2005 2006 2007 2008 2009 2010 2011 Exports Imports Source: WISERTrade based on U.S. Census Bureau foreign trade data; Value of trade through the Miami Customs District. 15
  • 17.
    Opportunity: Tourism &Travel Annual Overseas Visitors to Miami (In Millions) 3.5 3.0 2.5 2.0 1.5 1.0 0.5 0.0 2000 2001 2002 2003 2004 2005 2006 2007 2008 2009 2010 Source: U.S. Department of Commerce, International Trade Administration. 16
  • 18.
  • 19.
  • 20.
    Challenge: Talent Supply 10… 6… 3… 2… …students in a …graduate from …continue to college …earn college credit 9th grade class high school within two years within two years 2002 2005 2007 2009 Source: Florida Board of Education 2011. 19
  • 21.
    Challenge: Workforce Skills Educational Attainment 2006-2010 Population over 25... …with less than a …with HS, Associate’s degree, …with a Bachelor’s degree, High School degree or some college or higher 17% 55% 28% Southeast Florida Region 15% 59% 26% Florida 15% 57% 28% United States Source: U.S. Census Bureau, American Community Survey 2006-2010 five-year estimates. 20
  • 22.
    Opportunity: Community ofChoice 2009 2000 1990 1980 1970 1960 21
  • 23.
    Challenge: Mobility Source: Florida Department of Transportation. 22
  • 24.
    How Do WeGet Started? Align state, regional, and local plans around a common framework Create 5 year action plan pointing toward a 50-year vision Integrate with other regions to build Florida’s megaregion Measure and report progress 23
  • 26.
  • 27.
  • 28.
    Florida’s New StatewideEconomic Development Structure 27
  • 29.
    Alignment of State,Regional, Local Plans Statewide Strategic Plan for Economic Development » Coordinated with 2030 Six Pillars Plan and 2060 Statewide Vision Regional Comprehensive Economic Development Strategy » Joint effort of South Florida and Treasure Coast RPCs » Input into Regional Vision and Blueprint for Economic Prosperity 28

Editor's Notes

  • #10 So it is no wonder we hear the question…Is Florida over? Obvious answer is no, Florida with its many assets and opportunities is far from over. BUT…the Florida that we’ve known IS over.In the 1970’s, we were the 5th cheapest state. Economic Development mantra was “we’re cheap, got lots of land, beaches and sun. Come on down!” This strategy managed to drive us to point where 1,100 people a day were moving in. Perhaps even some of you.Today our costs place us at 19th most expensive. Florida is no longer a “low-cost” state. We’ve still got land, beach and sun but we have a different fundamental economic base…with its incumbent consequences.This very point was emphasized in recent Wall Street Journal, New York Times, the Economist and Time Magazine articles which asked the very pointed question “Is Florida Over?” They formed their arguments around our states’ changing migration pattern and overall costs.We’ve seen significant changes in wages, housing costs, property taxes, and other costs of living and costs of doing business. So we need to re-examine how we compete as a higher cost state. The easy approach would be to find a “fix” for today that reignites the old “cheap growth” fire, but what we really need is positioning with a long-term, global perspective.
  • #11 Second, trade routes are changing and these changes favor Florida. Graphic highlights major trade routes – over the past few decades, two major sea trade routes serving the U.S. :Between Europe and Eastern US across the Atlantic OceanBetween East Asia (Japan, S. Korea, and increasingly, China) and Western US across the Pacific OceanMajor changes anticipated over the next few decadesPanama Canal widening in 2014 – greater use of Panama Canal to bring Asian trade to Eastern US – estimates suggest 25% or more of Asian trade may be diverted from Western US ports to Eastern US through CanalAs Asian production centers shift to South Asia (India, etc) – Suez Canal more direct route to Eastern USNorth/south trade between Latin America and Caribbean and Eastern US will grow as Brazil and other nations experience strong economic growth (wild card: reopening of Cuba)Africa may become more significant as well - -Florida is closest US state to Africa All of these trends taken together place Florida in a very strategic position at intersection of multiple trade lanes
  • #20 Assistance defined as food stamps or cash payments1 in 5 homes in default or foreclosure. The Mortgage Bankers Association says 22% of all Florida homes are in default on their mortgages or in the foreclosure process. Florida has the 7th highest rate in the nation with 1 in every 343 housing units getting a foreclosure filing,25,641 Florida properties received foreclosure filings in December2010. Florida foreclosures are up by 208 percent since the low point in December 2006. Cape Coral metro area is the second highest rate in the nation, after Las Vegas, Miami and Orlando are also in the top 10.
  • #27 Caucus System is the product of many years of research by the Foundation to identify the critical factors determining Florida’s future. A Caucus per Pillar was created to construct a strategic plan for the year 2030 focusing on high-wage jobs, global competitiveness and vibrant communities and to also establish a continuous source for insight and feedback