Download to read offline
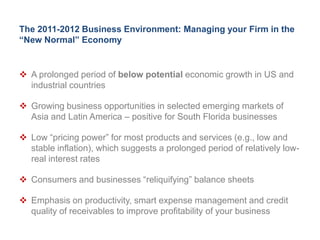
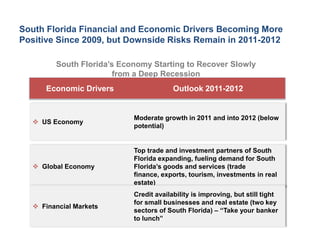
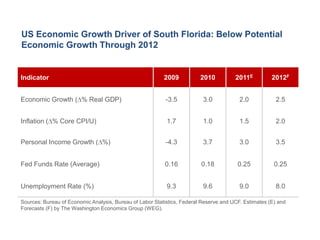
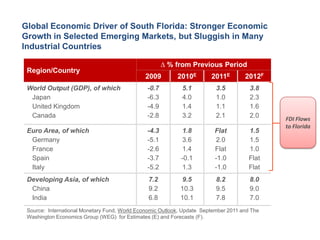
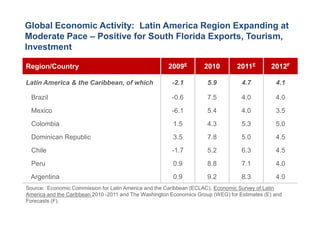
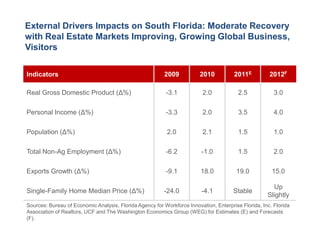
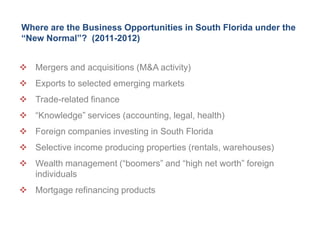
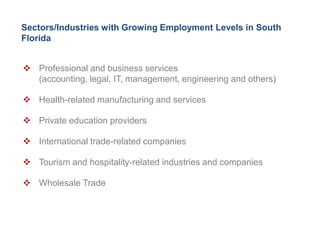
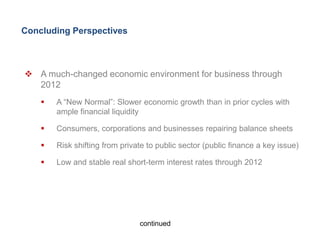


The document discusses the economic outlook for South Florida and the implications for local businesses from 2011-2012. It notes that while the US and global economies are expected to see moderate growth, the recovery will be slow and below potential levels. The document identifies several industries and business opportunities in South Florida that may see growth during this "new normal" period of slower economic activity, such as exports, trade financing, and professional services.


