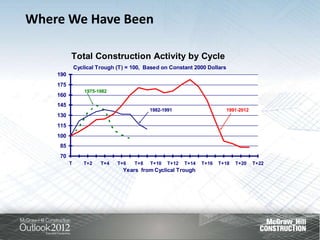
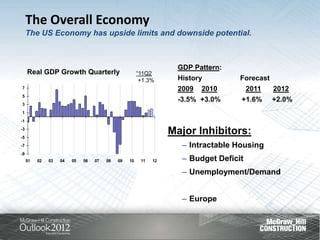
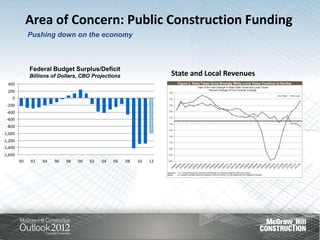
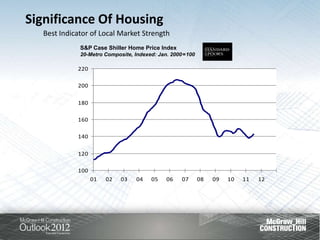
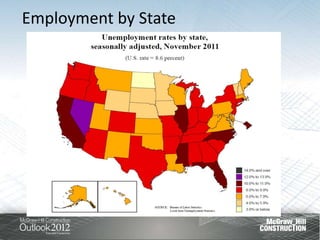
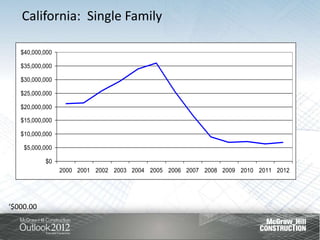
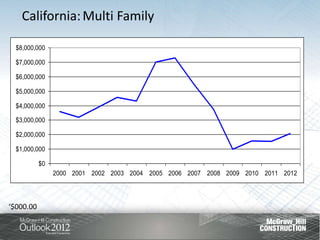
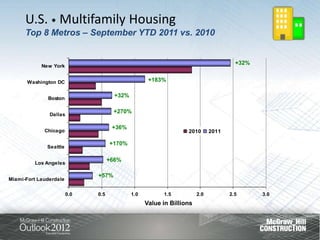
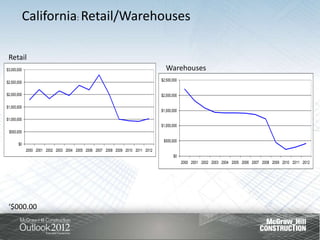
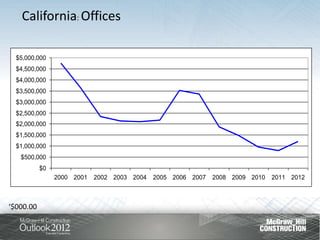
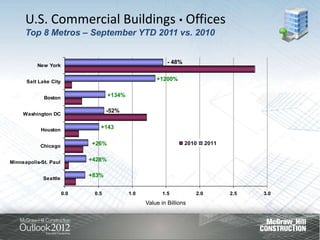
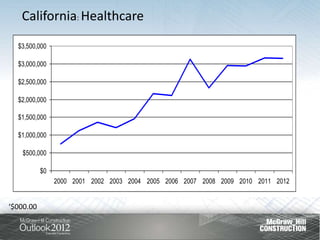
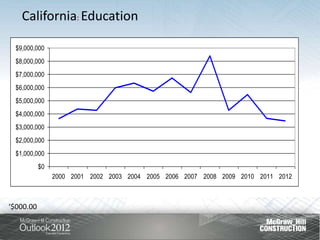
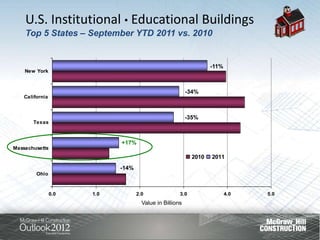
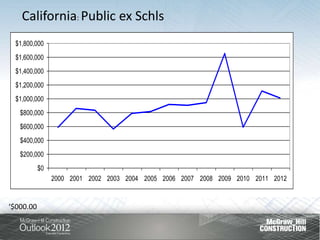
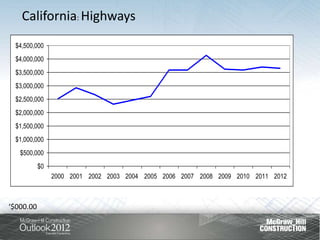
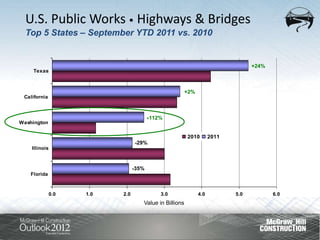
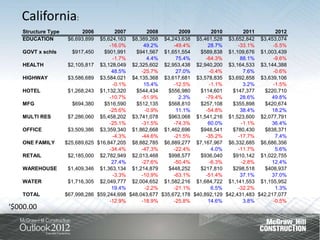
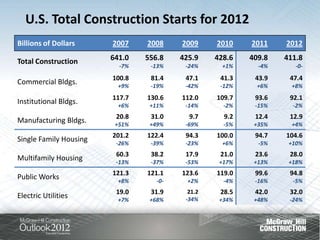
Cliff Brewis
Senior Director, Operations
McGraw-Hill Construction
Where We Have Been

          Total Construction Activity by Cycle
              Cyclical Trough (T) = 100, Based on Constant 2000 Dollars
    190
    175
                  1975-1982
    160
    145
                                          1982-1991                       1991-2012
    130
    115
    100
    85
    70                                                                                       1991- 2005
          T      T+2    T+4   T+6   T+8   T+10   T+12   T+14   T+16   T+18   T+20     T+22
                                Years from Cyclical Trough
The Overall Economy
     The US Economy has upside limits and downside potential.


                                                                    GDP Pattern:
     Real GDP Growth Quarterly                         “11Q2
                                                        +1.3%       History         Forecast
7                                                                   2009   2010         2011   2012
5
                                                                    -3.5% +3.0%     +1.6%      +2.0%
3
1
-1
-3
-5
                                                                  Major Inhibitors:
-7                                                                   – Intractable Housing
-9
     01   02   03   04   05   06   07   08   09   10    11   12      – Budget Deficit
                                                                     – Unemployment/Demand


                                                                     – Europe
Area of Concern: Public Construction Funding
              Pushing down on the economy


              Federal Budget Surplus/Deficit
              Billions of Dollars, CBO Projections                   State and Local Revenues
  400
  200
    0
 -200
 -400
 -600
 -800
-1,000
-1,200
-1,400
-1,600
         90   92   94   96   98   00   02   04   06   08   10   12
Significance Of Housing
  Best Indicator of Local Market Strength
             S&P Case Shiller Home Price Index
             20-Metro Composite, Indexed: Jan. 2000=100

            220

            200

            180

            160

            140

            120

            100
                  01   02   03   04    05   06    07      08   09   10   11   12
Employment by State
California: Single Family

   $40,000,000

   $35,000,000

   $30,000,000

   $25,000,000

   $20,000,000

   $15,000,000

   $10,000,000

    $5,000,000

           $0
                 2000 2001 2002 2003 2004 2005 2006 2007 2008 2009 2010 2011 2012


‘$000.00
California: Multi Family

  $8,000,000

  $7,000,000

  $6,000,000

  $5,000,000

  $4,000,000

  $3,000,000

  $2,000,000

  $1,000,000

           $0
                2000 2001 2002 2003 2004 2005 2006 2007 2008 2009 2010 2011 2012


‘$000.00
U.S. • Multifamily Housing
      Top 8 Metros – September YTD 2011 vs. 2010


            New York
                                                                                      +32%


       Washington DC                                +183%


              Boston
                                      +32%


               Dallas
                                     +270%

                                     +36%
             Chicago                                              2010       2011

                                    +170%
              Seattle

                                    +66%
         Los Angeles

                              +57%
Miami-Fort Lauderdale


                        0.0   0.5            1.0         1.5           2.0          2.5      3.0
                                                   Value in Billions
California: Retail/Warehouses

 Retail
$3,000,000                                                                        Warehouses
$2,500,000
                                                                                $2,500,000


$2,000,000                                                                      $2,000,000

$1,500,000
                                                                                $1,500,000
$1,000,000
                                                                                $1,000,000
 $500,000

                                                                                 $500,000
       $0
             2000 2001 2002 2003 2004 2005 2006 2007 2008 2009 2010 2011 2012
                                                                                       $0
                                                                                             2000 2001 2002 2003 2004 2005 2006 2007 2008 2009 2010 2011 2012


 ‘$000.00
California: Offices

  $5,000,000
  $4,500,000
  $4,000,000
  $3,500,000
  $3,000,000
  $2,500,000
  $2,000,000
  $1,500,000
  $1,000,000
   $500,000
           $0
                2000 2001   2002 2003 2004   2005 2006 2007   2008 2009 2010   2011 2012


‘$000.00
U.S. Commercial Buildings • Offices
      Top 8 Metros – September YTD 2011 vs. 2010


                                                            - 48%
          New York


      Salt Lake City                                   +1200%


             Boston                  +134%

                                    -52%
     Washington DC


            Houston
                                +143


            Chicago          +26%                                   2010     2011


Minneapolis-St. Paul         +428%


             Seattle
                             +83%


                       0.0    0.5            1.0          1.5          2.0          2.5   3.0
                                                   Value in Billions
California: Healthcare
  $3,500,000

  $3,000,000

  $2,500,000

  $2,000,000

  $1,500,000

  $1,000,000

    $500,000

           $0
                2000 2001 2002 2003 2004 2005 2006 2007 2008 2009 2010 2011 2012


‘$000.00
California: Education

 $9,000,000
 $8,000,000
 $7,000,000
 $6,000,000
 $5,000,000
 $4,000,000
 $3,000,000
 $2,000,000
 $1,000,000
           $0
                2000 2001 2002 2003 2004 2005 2006 2007 2008 2009 2010 2011 2012


‘$000.00
U.S. Institutional • Educational Buildings
 K-12 School Construction larger than Colleges/Universities/
 Community Colleges, particularly in sq. ft. terms, less so in dollar terms.
 K-12 has typically shown steeper up-and-down swings.


        Education Buildings - Segments                                            Education Buildings - Segments
        Millions of Sq. Ft.                                                       Billions of Dollars
200                                                                       40

175                                                                       35
                  K-12 Schools                                                                               K-12 Schools
150                                                                       30

125                                                                       25

100                                                                       20
                                                                                                           Colleges/Universities/
 75                                                                       15
                                                                                                           Community Colleges
                   Colleges/Universities/
 50                                                                       10
                   Community Colleges
 25                                                                           5

    0                                                                         0
        90   92     94   96      98   00    02   04   06   08   10   12           90   92   94   96   98   00   02    04    06   08   10   12

•        In 2010, sq. ft for K-12 school construction                     •        In 2010, dollars for K-12 school construction
         was 3.6 times the size for Colleges/                                      was 2.3 times the size of Colleges/Universities/
         Universities/Community Colleges                                           Community Colleges
U.S. Institutional • Educational Buildings
    Top 5 States – September YTD 2011 vs. 2010


                                                                  -11%
    New York


                                                         -34%
   California


                                                         -35%
       Texas


                            +17%
Massachusetts
                                                           2010   2011
                            -14%
        Ohio


                0.0   1.0          2.0               3.0                 4.0   5.0
                                     Value in Billions
California: Public ex Schls
 $1,800,000
 $1,600,000
 $1,400,000
 $1,200,000
 $1,000,000
   $800,000
   $600,000
   $400,000
   $200,000
           $0
                2000 2001 2002 2003 2004 2005 2006 2007 2008 2009 2010 2011 2012


‘$000.00
California: Highways
 $4,500,000
 $4,000,000
 $3,500,000
 $3,000,000
 $2,500,000
 $2,000,000
 $1,500,000
 $1,000,000
   $500,000
           $0
                2000 2001 2002 2003 2004 2005 2006 2007 2008 2009 2010 2011 2012


‘$000.00
U.S. Public Works • Highways & Bridges
  Top 5 States – September YTD 2011 vs. 2010


                                                                                +24%
     Texas


                                                       +2%
 California


                                       +112%
Washington

                                                       2010        2011
                                -29%
    Illinois


                                -35%
    Florida


              0.0   1.0   2.0              3.0               4.0          5.0          6.0
                                   Value in Billions
California:
   Structure Type          2006          2007        2008        2009        2010        2011        2012
   EDUCATION         $6,693,899    $5,624,163 $8,389,268 $4,243,638 $5,461,528 $3,652,842 $3,453,074
                                       -16.0%       49.2%      -49.4%       28.7%      -33.1%       -5.5%
   GOVT x schls       $917,450       $901,991    $941,567 $1,651,554     $589,838 $1,109,676 $1,003,439
                                        -1.7%        4.4%       75.4%      -64.3%       88.1%       -9.6%
   HEALTH            $2,105,817    $3,128,049 $2,325,602 $2,953,438 $2,940,200 $3,164,533 $3,144,388
                                        48.5%      -25.7%       27.0%       -0.4%        7.6%       -0.6%
   HIGHWAY           $3,586,689    $3,584,021 $4,135,368 $3,617,681 $3,578,835 $3,692,858 $3,639,106
                                        -0.1%       15.4%      -12.5%       -1.1%        3.2%       -1.5%
   HOTEL             $1,268,243    $1,132,320    $544,434    $556,980    $114,601    $147,377    $220,710
                                       -10.7%      -51.9%        2.3%      -79.4%       28.6%      49.8%
   MFG                $694,380       $516,590    $512,135    $568,810    $257,108    $355,898    $420,674
                                       -25.6%       -0.9%       11.1%      -54.8%       38.4%      18.2%
   MULTI RES         $7,286,060    $5,458,202 $3,741,078     $963,068 $1,541,216 $1,523,600 $2,077,791
                                       -25.1%      -31.5%      -74.3%       60.0%       -1.1%      36.4%
   OFFICE            $3,509,386    $3,359,340 $1,862,668 $1,462,696      $948,541    $780,430    $838,371
                                        -4.3%      -44.6%      -21.5%      -35.2%      -17.7%        7.4%
   ONE FAMILY       $25,689,625   $16,847,205 $8,882,785 $6,889,277 $7,167,967 $6,332,685 $6,686,356
                                       -34.4%      -47.3%      -22.4%        4.0%      -11.7%        5.6%
   RETAIL            $2,185,000    $2,782,949 $2,013,468     $998,577    $936,040    $910,142 $1,022,755
                                        27.4%      -27.6%      -50.4%       -6.3%       -2.8%      12.4%
   WAREHOUSE         $1,409,346    $1,363,134 $1,214,879     $448,252    $217,810    $298,518    $408,937
                                        -3.3%      -10.9%      -63.1%      -51.4%       37.1%      37.0%
   WATER             $1,716,305    $2,049,777 $2,004,652 $1,582,216 $1,684,722 $1,141,553 $1,155,952
                                        19.4%       -2.2%      -21.1%        6.5%      -32.2%        1.3%
   TOTAL            $67,998,286   $59,244,698 $48,043,677 $35,672,178 $40,892,129 $42,431,483 $42,217,077
                                       -12.9%      -18.9%      -25.8%       14.6%        3.8%       -0.5%
‘$000.00
Questions?
Cliff Brewis
Senior Director Operations
McGraw-Hill Construction/Dodge
510-566-0913
cliff_brewis@mcgraw-hill.com
Appendix
National numbers
U.S. Total Construction Starts for 2012
Billions of Dollars     2007    2008     2009     2010    2011    2012

Total Construction      641.0   556.8    425.9    428.6   409.8   411.8
                          -7%    -13%     -24%      +1%     -4%      -0-
                        100.8    81.4     47.1     41.3    43.9    47.4
Commercial Bldgs.         +9%    -19%     -42%     -12%     +6%     +8%
                        117.7   130.6    112.0    109.7    93.6    92.1
Institutional Bldgs.      +6%    +11%     -14%      -2%    -15%     -2%
                         20.8    31.0      9.7      9.2    12.4    12.9
Manufacturing Bldgs.     +51%    +49%     -69%      -5%    +35%     +4%
                        201.2   122.4     94.3    100.0    94.7   104.6
Single Family Housing    -26%    -39%     -23%      +6%     -5%    +10%
                         60.3    38.2     17.9     21.0    23.6    28.0
Multifamily Housing      -13%    -37%     -53%     +17%    +13%    +18%
                        121.3   121.1    123.6    119.0    99.6    94.8
Public Works              +8%      -0-     +2%      -4%    -16%     -5%
                         19.0    31.9      21.2    28.5    42.0    32.0
Electric Utilities        +7%    +68%     -34%     +34%    +48%    -24%
Risks to the Forecast
                        Baseline Forecast   Recession Forecast
                        2011       2012      2011       2012
Total Construction      -4%         -0-      -5%        -7%

Commercial Bldgs.       +6%         +8%      +5%         -6%

Institutional Bldgs.    -15%        -2%      -15%        -3%

Manufacturing Bldgs.    +35%        +4%      +30%        -5%

Single Family Housing    -5%       +10%      -6%         -2%

Multifamily Housing     +13%       +18%      +12%        -5%

Public Works            -16%        -5%      -17%        -7%

Electric Utilities      +48%        -24%     +45%       -35%

Cliff Brewis Outlook 2012

  • 1.
    Cliff Brewis Senior Director,Operations McGraw-Hill Construction
  • 2.
    Where We HaveBeen Total Construction Activity by Cycle Cyclical Trough (T) = 100, Based on Constant 2000 Dollars 190 175 1975-1982 160 145 1982-1991 1991-2012 130 115 100 85 70 1991- 2005 T T+2 T+4 T+6 T+8 T+10 T+12 T+14 T+16 T+18 T+20 T+22 Years from Cyclical Trough
  • 3.
    The Overall Economy The US Economy has upside limits and downside potential. GDP Pattern: Real GDP Growth Quarterly “11Q2 +1.3% History Forecast 7 2009 2010 2011 2012 5 -3.5% +3.0% +1.6% +2.0% 3 1 -1 -3 -5 Major Inhibitors: -7 – Intractable Housing -9 01 02 03 04 05 06 07 08 09 10 11 12 – Budget Deficit – Unemployment/Demand – Europe
  • 4.
    Area of Concern:Public Construction Funding Pushing down on the economy Federal Budget Surplus/Deficit Billions of Dollars, CBO Projections State and Local Revenues 400 200 0 -200 -400 -600 -800 -1,000 -1,200 -1,400 -1,600 90 92 94 96 98 00 02 04 06 08 10 12
  • 5.
    Significance Of Housing Best Indicator of Local Market Strength S&P Case Shiller Home Price Index 20-Metro Composite, Indexed: Jan. 2000=100 220 200 180 160 140 120 100 01 02 03 04 05 06 07 08 09 10 11 12
  • 6.
  • 7.
    California: Single Family $40,000,000 $35,000,000 $30,000,000 $25,000,000 $20,000,000 $15,000,000 $10,000,000 $5,000,000 $0 2000 2001 2002 2003 2004 2005 2006 2007 2008 2009 2010 2011 2012 ‘$000.00
  • 8.
    California: Multi Family $8,000,000 $7,000,000 $6,000,000 $5,000,000 $4,000,000 $3,000,000 $2,000,000 $1,000,000 $0 2000 2001 2002 2003 2004 2005 2006 2007 2008 2009 2010 2011 2012 ‘$000.00
  • 9.
    U.S. • MultifamilyHousing Top 8 Metros – September YTD 2011 vs. 2010 New York +32% Washington DC +183% Boston +32% Dallas +270% +36% Chicago 2010 2011 +170% Seattle +66% Los Angeles +57% Miami-Fort Lauderdale 0.0 0.5 1.0 1.5 2.0 2.5 3.0 Value in Billions
  • 10.
    California: Retail/Warehouses Retail $3,000,000 Warehouses $2,500,000 $2,500,000 $2,000,000 $2,000,000 $1,500,000 $1,500,000 $1,000,000 $1,000,000 $500,000 $500,000 $0 2000 2001 2002 2003 2004 2005 2006 2007 2008 2009 2010 2011 2012 $0 2000 2001 2002 2003 2004 2005 2006 2007 2008 2009 2010 2011 2012 ‘$000.00
  • 11.
    California: Offices $5,000,000 $4,500,000 $4,000,000 $3,500,000 $3,000,000 $2,500,000 $2,000,000 $1,500,000 $1,000,000 $500,000 $0 2000 2001 2002 2003 2004 2005 2006 2007 2008 2009 2010 2011 2012 ‘$000.00
  • 12.
    U.S. Commercial Buildings• Offices Top 8 Metros – September YTD 2011 vs. 2010 - 48% New York Salt Lake City +1200% Boston +134% -52% Washington DC Houston +143 Chicago +26% 2010 2011 Minneapolis-St. Paul +428% Seattle +83% 0.0 0.5 1.0 1.5 2.0 2.5 3.0 Value in Billions
  • 13.
    California: Healthcare $3,500,000 $3,000,000 $2,500,000 $2,000,000 $1,500,000 $1,000,000 $500,000 $0 2000 2001 2002 2003 2004 2005 2006 2007 2008 2009 2010 2011 2012 ‘$000.00
  • 14.
    California: Education $9,000,000 $8,000,000 $7,000,000 $6,000,000 $5,000,000 $4,000,000 $3,000,000 $2,000,000 $1,000,000 $0 2000 2001 2002 2003 2004 2005 2006 2007 2008 2009 2010 2011 2012 ‘$000.00
  • 15.
    U.S. Institutional •Educational Buildings K-12 School Construction larger than Colleges/Universities/ Community Colleges, particularly in sq. ft. terms, less so in dollar terms. K-12 has typically shown steeper up-and-down swings. Education Buildings - Segments Education Buildings - Segments Millions of Sq. Ft. Billions of Dollars 200 40 175 35 K-12 Schools K-12 Schools 150 30 125 25 100 20 Colleges/Universities/ 75 15 Community Colleges Colleges/Universities/ 50 10 Community Colleges 25 5 0 0 90 92 94 96 98 00 02 04 06 08 10 12 90 92 94 96 98 00 02 04 06 08 10 12 • In 2010, sq. ft for K-12 school construction • In 2010, dollars for K-12 school construction was 3.6 times the size for Colleges/ was 2.3 times the size of Colleges/Universities/ Universities/Community Colleges Community Colleges
  • 16.
    U.S. Institutional •Educational Buildings Top 5 States – September YTD 2011 vs. 2010 -11% New York -34% California -35% Texas +17% Massachusetts 2010 2011 -14% Ohio 0.0 1.0 2.0 3.0 4.0 5.0 Value in Billions
  • 17.
    California: Public exSchls $1,800,000 $1,600,000 $1,400,000 $1,200,000 $1,000,000 $800,000 $600,000 $400,000 $200,000 $0 2000 2001 2002 2003 2004 2005 2006 2007 2008 2009 2010 2011 2012 ‘$000.00
  • 18.
    California: Highways $4,500,000 $4,000,000 $3,500,000 $3,000,000 $2,500,000 $2,000,000 $1,500,000 $1,000,000 $500,000 $0 2000 2001 2002 2003 2004 2005 2006 2007 2008 2009 2010 2011 2012 ‘$000.00
  • 19.
    U.S. Public Works• Highways & Bridges Top 5 States – September YTD 2011 vs. 2010 +24% Texas +2% California +112% Washington 2010 2011 -29% Illinois -35% Florida 0.0 1.0 2.0 3.0 4.0 5.0 6.0 Value in Billions
  • 20.
    California: Structure Type 2006 2007 2008 2009 2010 2011 2012 EDUCATION $6,693,899 $5,624,163 $8,389,268 $4,243,638 $5,461,528 $3,652,842 $3,453,074 -16.0% 49.2% -49.4% 28.7% -33.1% -5.5% GOVT x schls $917,450 $901,991 $941,567 $1,651,554 $589,838 $1,109,676 $1,003,439 -1.7% 4.4% 75.4% -64.3% 88.1% -9.6% HEALTH $2,105,817 $3,128,049 $2,325,602 $2,953,438 $2,940,200 $3,164,533 $3,144,388 48.5% -25.7% 27.0% -0.4% 7.6% -0.6% HIGHWAY $3,586,689 $3,584,021 $4,135,368 $3,617,681 $3,578,835 $3,692,858 $3,639,106 -0.1% 15.4% -12.5% -1.1% 3.2% -1.5% HOTEL $1,268,243 $1,132,320 $544,434 $556,980 $114,601 $147,377 $220,710 -10.7% -51.9% 2.3% -79.4% 28.6% 49.8% MFG $694,380 $516,590 $512,135 $568,810 $257,108 $355,898 $420,674 -25.6% -0.9% 11.1% -54.8% 38.4% 18.2% MULTI RES $7,286,060 $5,458,202 $3,741,078 $963,068 $1,541,216 $1,523,600 $2,077,791 -25.1% -31.5% -74.3% 60.0% -1.1% 36.4% OFFICE $3,509,386 $3,359,340 $1,862,668 $1,462,696 $948,541 $780,430 $838,371 -4.3% -44.6% -21.5% -35.2% -17.7% 7.4% ONE FAMILY $25,689,625 $16,847,205 $8,882,785 $6,889,277 $7,167,967 $6,332,685 $6,686,356 -34.4% -47.3% -22.4% 4.0% -11.7% 5.6% RETAIL $2,185,000 $2,782,949 $2,013,468 $998,577 $936,040 $910,142 $1,022,755 27.4% -27.6% -50.4% -6.3% -2.8% 12.4% WAREHOUSE $1,409,346 $1,363,134 $1,214,879 $448,252 $217,810 $298,518 $408,937 -3.3% -10.9% -63.1% -51.4% 37.1% 37.0% WATER $1,716,305 $2,049,777 $2,004,652 $1,582,216 $1,684,722 $1,141,553 $1,155,952 19.4% -2.2% -21.1% 6.5% -32.2% 1.3% TOTAL $67,998,286 $59,244,698 $48,043,677 $35,672,178 $40,892,129 $42,431,483 $42,217,077 -12.9% -18.9% -25.8% 14.6% 3.8% -0.5% ‘$000.00
  • 21.
    Questions? Cliff Brewis Senior DirectorOperations McGraw-Hill Construction/Dodge 510-566-0913 cliff_brewis@mcgraw-hill.com
  • 22.
  • 23.
    U.S. Total ConstructionStarts for 2012 Billions of Dollars 2007 2008 2009 2010 2011 2012 Total Construction 641.0 556.8 425.9 428.6 409.8 411.8 -7% -13% -24% +1% -4% -0- 100.8 81.4 47.1 41.3 43.9 47.4 Commercial Bldgs. +9% -19% -42% -12% +6% +8% 117.7 130.6 112.0 109.7 93.6 92.1 Institutional Bldgs. +6% +11% -14% -2% -15% -2% 20.8 31.0 9.7 9.2 12.4 12.9 Manufacturing Bldgs. +51% +49% -69% -5% +35% +4% 201.2 122.4 94.3 100.0 94.7 104.6 Single Family Housing -26% -39% -23% +6% -5% +10% 60.3 38.2 17.9 21.0 23.6 28.0 Multifamily Housing -13% -37% -53% +17% +13% +18% 121.3 121.1 123.6 119.0 99.6 94.8 Public Works +8% -0- +2% -4% -16% -5% 19.0 31.9 21.2 28.5 42.0 32.0 Electric Utilities +7% +68% -34% +34% +48% -24%
  • 24.
    Risks to theForecast Baseline Forecast Recession Forecast 2011 2012 2011 2012 Total Construction -4% -0- -5% -7% Commercial Bldgs. +6% +8% +5% -6% Institutional Bldgs. -15% -2% -15% -3% Manufacturing Bldgs. +35% +4% +30% -5% Single Family Housing -5% +10% -6% -2% Multifamily Housing +13% +18% +12% -5% Public Works -16% -5% -17% -7% Electric Utilities +48% -24% +45% -35%