Download to read offline
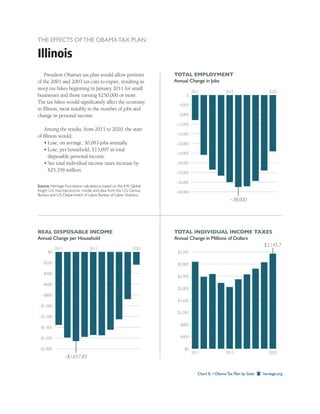
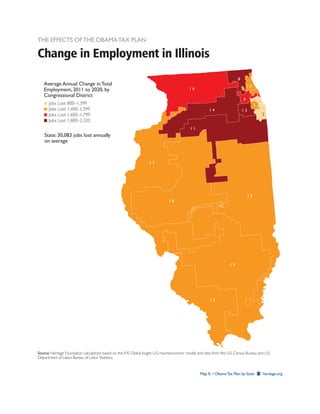

President Obama's tax plan is projected to lead to significant job losses in Illinois, averaging 30,083 jobs annually from 2011 to 2020 due to the expiration of certain tax cuts. Additionally, households could see a reduction in disposable income by $13,097, while total individual income taxes might increase by $25,356 million. These effects underline the potential economic challenges for small businesses and high earners in the state.


