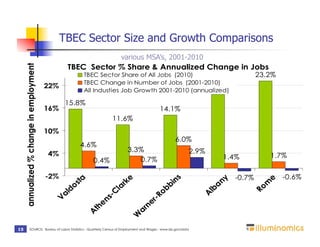
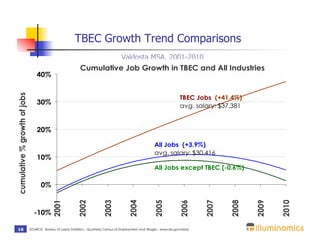
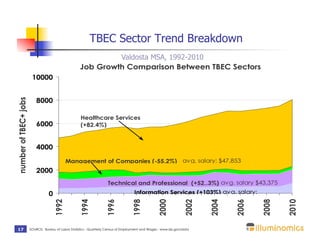
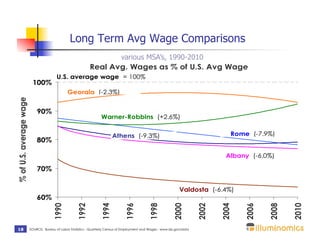
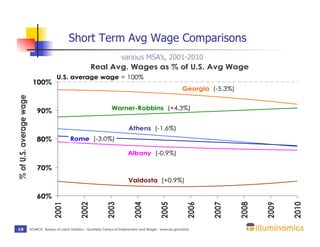
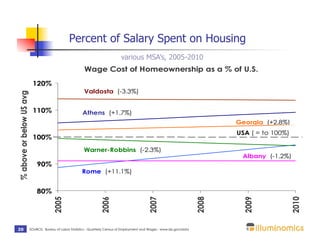
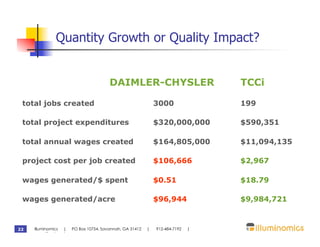
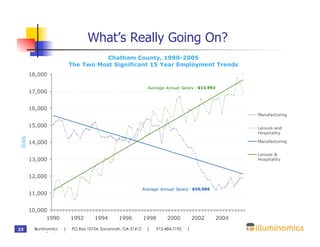
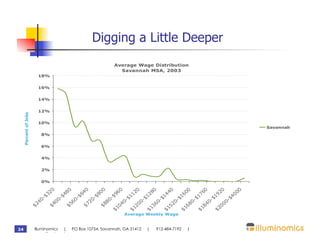
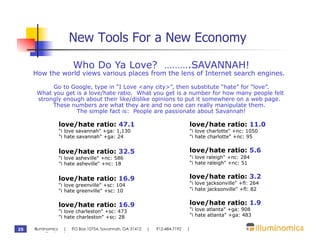
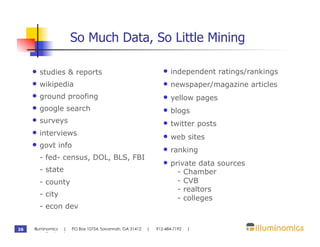
This document summarizes an economic development initiative in Valdosta, Georgia aimed at increasing average wages. It discusses how the city targeted growth in higher-paying knowledge-based and creative jobs through programs led by the local Chamber of Commerce. Data shows that this effort has reversed Valdosta's decades-long decline in average wages, with the city now outperforming peers on key economic metrics. The success story demonstrates how communities can take control of their economic fate through focused programs to attract high-wage workers and industries.
The document provides a market summary and analysis of the single family real estate market in Lafayette, Louisiana. It includes the following information:
1) There are currently 936 properties actively listed for sale, with a median list price of $253,542. The median days on the market for active listings is 90 days.
2) There are 421 pending sales contracts, giving a pending ratio of 31.0%. This indicates that listings are in demand and selling quickly.
3) In the last 6 months there were 3314 closed sales with a median sold price of $189,000, and 958 listings that failed to sell within that period.
The Sources and Uses of Survey Data on ArmeniaCRRC-Armenia
1. The document discusses several data sources on Armenia including the Business Environment and Enterprise Performance Survey (BEEPS), Life in Transition Survey (LiTS), population census, and household surveys.
2. BEEPS examines the business environment in Armenia by surveying firms. LiTS provides individual-level data by surveying households to assess how transition has affected lives.
3. Examples are given of how the data from these sources has been used such as analyzing how tax evasion varies with bribery using BEEPS data, and studying income mobility and the impact of remittances on education spending using LiTS data.
The document summarizes economic data for Decatur, TX showing the local economy has recovered from the recession. Key points include:
- Decatur has experienced growth in population, businesses, employment and taxable property values since 2000.
- The economy has diversified away from basic services with growth in healthcare, manufacturing and wholesale trade.
- Partnerships between education, workforce programs and local industry are emphasized as important to support continued economic development.
The document provides an analysis of the single family real estate market in Lafayette, Louisiana, including statistics on current listings, pending sales, recently sold and off-market properties for the last 6 months. Key metrics examined include median prices, days on market, pending sale ratio, and months of inventory. The data is presented in tables and charts to give an overview of market conditions and trends in different price ranges.
The Ann Arbor District Library in Michigan has successfully adopted Library 2.0 practices like blogging, tagging content, and encouraging user participation and feedback. This has led to over 80,000 registered users who have contributed over 2,000 reviews, 8,000 ratings, and 17,000 blog comments. The library also engages users through social media like Facebook, 16 RSS feeds that disseminate content, and gaming for teens. Staff also utilize collaborative tools like wikis and Google platforms. This case study shows how embracing new technologies has boosted user engagement and demonstrated the value of the library to the community.
The Ann Arbor District Library in Michigan has successfully adopted Library 2.0 practices like blogging, tagging content, and encouraging user participation and feedback. This has led to over 80,000 registered users who have contributed over 2,000 reviews, 8,000 ratings, and 17,000 blog comments. The library also engages users through social media like Facebook, utilizes content management platforms like Drupal, and provides access to information through multiple blogs and RSS feeds. Adopting these Library 2.0 practices has helped the Ann Arbor District Library better serve its patrons and community.
The Ann Arbor District Library in Michigan has successfully adopted Library 2.0 practices like blogging, tagging content, and encouraging user participation and feedback. This has led to over 80,000 registered users who have contributed over 2,000 reviews, 8,000 ratings, and 17,000 blog comments. The library also engages users through social media like Facebook, 16 RSS feeds that disseminate content, and gaming for teens. Staff also utilize collaborative tools like wikis and Google platforms. This case study shows how embracing new technologies has boosted user engagement and demonstrated the value of the library to the community.
Ad exchanges targeting & optimization april 2011Linda Gridley
The document provides an overview of the transformation occurring in online advertising, with new technologies like ad exchanges and data platforms changing how ads are targeted and optimized. It discusses the many players that have emerged on both the demand and supply sides and how their roles and capabilities are still evolving. While new platforms aim to bring more transparency and efficiency, the ecosystem remains complex with ongoing consolidation expected.
5 Trends in Economic Development You Can't IgnoreGIS Planning
Economic development is changing rapidly and dramatically. It's reshaping our work, how we work with our customers, and even who our customers are. If it feels like you're operating under new rules, it's because you are - and you might not even know what they are. Learn 5 ways our profession is changing and how you can come out on top. For more information visit http://www.gisplanning.com
Retail apocolypse and pension fund culpabilitythomas paulson
1) The retail apocalypse was caused by a combination of factors including adverse demographics, income bifurcation, student loan debt, supply-demand imbalance from overexpansion by retailers, more efficient business models like Amazon, and changes in consumer behavior toward e-commerce and mobile shopping.
2) E-commerce growth was significantly underappreciated as statistics undercounted sales on marketplaces and overcounted the retail sector by including categories like auto sales. This led to retailers being unprepared for the large shift to online shopping.
3) Private equity ownership of retailers exacerbated problems as high debt levels limited their ability to adapt to changes and led to market share losses and bankruptcies for some retailers.
A presentation to local business groups demonstrating how they can use .id's publicly available toolkit to understand the local demographic and economic profile.
A Echeverria Channel Focus Segmentation And Coverage Models 4 SlideshareAndré Echeverria
Here are the top 3 accounts based on the weighted parameters:
1. PETROBRAS - Highest loyalty level and largest contract values and historical spending. Clear top priority account.
2. EMBRATEL - Second highest loyalty level and above average contract values and historical spending. A core priority account.
3. GRUPO TELEFONICA - Second highest contract values and spending but lower loyalty level than top two. Still a priority account but perhaps slightly lower focus than the top two.
According to a new survey of more than 115 eCommerce & multi-channel executives from major global retail brands, European retailers see mobile as not only the biggest growth opportunity, but also the area that will change the most in the next one to two years.
There have been a few times in history which have ushered in a period of great change. We are in the midst of one of them, in which communications and the network has become cheap or free and is influencing changes for the foreseeable future. Some of the changes we are witnessing are the mobilization of the public, a shift in how marketing is performed and the importance of information.
The purpose of this writing is to discuss how information is weaved into this age of disruption and discuss what can be done to thrive in an economy fraught with change for the foreseeable future.
How to Engage Customers and Manage Perceptions Using a Clear Brand Voice Siegel+Gale
Siegel+Gale Managing Director Jason Cieslak co-presented the session: Doing Digital the Right Way – How to Engage Customers and Manage Perceptions Using a Clear Brand Voice. Joined by Patricia Reupke, Director of Consumer Relationship Marketing at Baylor Health Care System, Jason discussed how to create a successful digital strategy that reflects an organization’s brand promise and engages multiple audiences through various platforms.
The document discusses the findings of the 2019 Retail Technology Study, which surveyed over 80 senior retail executives responsible for IT decision making. Most respondents held C-level or VP positions and represented a variety of retail segments. The majority of respondents' companies had over 100 stores and annual revenues over $1 billion.
The document provides an overview of the state of the online marketing industry in 2011. It notes that while traditional advertising is starting to recover from declines in 2009, the industry is shifting toward digital and data-driven solutions. Online marketing continues to grow, led by search and display advertising. The summary identifies opportunities across various online marketing sectors such as ad networks, web analytics, social media marketing, and others. It highlights trends toward performance-based networks and data insights.
With respect to global digitization benchmarks, APAC is showing the way in many areas, ahead of Europe and just behind North America in digital transformation, for example.
This Hot Topic flashlight report shows the position of home based businesses in the South East business population. It explores some of the issues facing home based businesses in particular, and their attitudes to general economic conditions. The research was carried out in July 2009. More detail will be available in the full Hot Topic Spotlight report on home based businesses,
which will be published in October 2009.
A talk provoking forward thinking with regards to social media, mobile, and mobile payments. What are the opportunities for tapping into networks and advancing marketing & PR alongside the rise of mobile payments?
Global Finance magazine in association with Merrill DataSite® presents the video webcast on Trends in Mergers and Acquisitions, which took place the Thursday, June 3rd at 11:00 a.m
"Ready or Not, Here Comes 2015: Marketing Trends to Master" TrendLab WebinarBluespire Marketing
During this BlueSpire TrendLab Webinar, our senior living, healthcare and financial services experts dive into the most relevant marketing trends and analyze what to look for in 2015.
Main themes of the webinar included:
•What global trends will have the most impact next year and how those trends will affect brand building and the overall customer experience.
•Changes in marketing staffing and spending, what should be on your radar regarding big data and analytics, and the importance of Web personalization.
• Effectiveness of branded videos, the accelerating trend of sharable and snackable content, and mapping content appropriately to your consumer’s journey.
Enterprise Digital Transformation Survey report 2015Copperberg
The survey report provides insights into perceptions of digital transformation among leaders in Europe's private and public sectors. Some key findings:
- Most organizations have started their digital transformation journey, with 44% applying new technologies and 20% moving to data-driven decisions.
- 15% see themselves as fully digital, while only 6% consider themselves non-digital. Maturity varies by sector and business model.
- Over 85% see opportunities to positively impact customer experience, operations, and business models through digital transformation.
- Common capabilities being used or planned include digital marketing, mobility, analytics, customer intelligence, and collaborative tools.
Presentation given by Douglas Smith of HolyTornado! at the Marketing Innovations Summit in Genk, Belgium on the need for innovation in retail. http://www.marketinginnovation.eu/
Insights from the World Economic Forum in Davos, where world leaders discussed the importance of emerging markets and how technology is changing the way we connect with each other.
growth of service sector in india after post independence era...DIPANJAN ROY
This document discusses the growth of India's services sector since liberalization. It notes that the services sector share of GDP has grown significantly, reaching over 50% in recent years, though employment share has remained relatively stable. Within services, IT and ITES have experienced the most rapid growth at over 25% annually. However, development has been uneven across sectors and regions. While India has emerged as a major exporter, especially in IT, imports have also increased substantially.
The document discusses the key findings of the 2010 Lead Generation Optimization study conducted by CSO Insights. Over 635 firms participated in the study, focusing on their lead generation objectives, investments, and processes for 2010. The top three strategic marketing objectives for 2010 were increasing customer acquisition, increasing brand awareness, and optimizing cross-selling and up-selling.
I canada nov 17 2011 session data - graphical reporticanadanetwork
In under an hour at the i-Canada Conference, 70 people used Powernoodle to brainstorm 35 ideas across six categories, vote and rate the ideas, and assign 12 action items to the top 4 ideas with no paper waste. The tool captured all the data graphically, showing the number of ideas and votes by category, as well as actions assigned.
The document discusses creating a millionaire ecosystem in Atlantic Canada. It focuses on building an environment where more people can become millionaires through entrepreneurship and business success. The author, Gary Stairs, is the director of i-CANADA Atlantic and president of Red Hot Learning, and likely provides strategies for cultivating business and wealth in the region.
Broadband access is becoming a fundamental right and essential utility. A forum of global leaders advocated that broadband infrastructure and services are now as important as roads or electricity for modern societies. Broadband can help achieve UN Millennium Development Goals through e-services for health, education, and government. Finland recognized broadband as a basic service and aims to provide nationwide access of at least 1 Mbps by 2010 and 100 Mbps by 2015 through public-private partnerships to connect both urban and rural areas.
The document discusses Vancouver and collaboration on digital infrastructure projects. It summarizes the City of Coquitlam's municipal fiber optic network, QNet, which leases dark fiber to telecom companies. QNet has generated cost savings and improved connectivity for the city. The document outlines how Coquitlam is working with other municipalities in the Vancouver area to foster broadband access and economic development through shared infrastructure projects.
This document discusses the need for smart communities in the 21st century. It notes that the world is becoming increasingly urbanized and populations are aging. Smart communities can help address these challenges by using technology to improve quality of life, economic development, and public services. The document advocates for open broadband networks to connect citizens, businesses, and government agencies. This will allow communities to benefit from e-commerce, e-education, e-health, and other applications to enrich daily life. Smart communities are driven by innovation and public-private partnerships to tackle issues like mobility, the environment, and a sustainable economy.
James van Leeuwen, Director of i-CANADA West, gave a presentation on building community broadband networks in Canada. He discussed how smaller communities in the US are building their own fiber networks out of necessity, since private telecom companies do not find it profitable to service rural areas. For smaller Canadian communities to thrive in the digital economy, they will need to take initiative like these US communities. Mr. van Leeuwen advocated for building a nationwide fellowship to include First Nations communities and ensure all Canadians have access to world-class broadband infrastructure.
The panel discussion focused on i-Waterfront's plan to provide a billion bits per second broadband network along Toronto's waterfront. The panel included representatives from Windsor and Essex County Smart Community, the University of Windsor, i-CANADA West, Alcatel-Lucent, and Rhyzome Networks. They discussed creating an ultra-fast fibre-optic network that would lead the city into the 21st century and provide ultra-high-speed broadband access for waterfront communities at an affordable price. Newspapers articles were cited that praised the plan to wire the waterfront with a smart, ultra-broadband communications infrastructure that would serve as the foundation for innovation in the region.
This document discusses how cities can become smarter through the use of data and analytics. It provides examples of how predictive analytics have helped reduce crime rates and optimize maintenance schedules. It also discusses the value of integrating data across organizations to coordinate emergency response efforts and engage citizens on important issues like water conservation. Overall, the document advocates for cities to capture more data, anticipate problems, and coordinate resources to increase the value provided to residents.
The document describes an assessment tool called the Windsor-Essex Application. It was created by Kristina Verner, a Research & Development Officer at the University of Windsor's CSCI department. The tool allows users to evaluate applications for the Windsor-Essex region.
The document describes an assessment tool called Mapping for Success that can be used to evaluate communities and help them progress towards becoming more intelligent communities. It provides an overview of the i-Canada program and its goals of using technology and collaboration to help Canadian communities thrive economically and socially. The tool works by assessing communities across various domains and indicators to understand their strengths, weaknesses and potential for improvement. It is intended to help communities develop strategies, measure their performance over time, and benchmark themselves against other communities.
This document discusses how wireless technology will change how industry, academia, and governments interact. It notes that wireless solutions can help address challenges like an aging population, the need for companies to get direct customer feedback, and the demand for location-independent services. The document outlines how innovations like mobile devices, video on demand, mobile content, wireless education, remote healthcare, integrated government services, mobile social networking, and wireless payments can transform experiences in areas like training, healthcare, education, and commerce. Organizations that can anticipate these trends and quickly implement mobile solutions may gain competitive advantages around cost reduction and enhanced flexibility, as well as new revenue opportunities.
The panel discusses the benefits of an intelligent community network, including:
1) Lower construction costs from multiple building systems sharing the same infrastructure.
2) Proper infrastructure enables utility-based internet delivery.
3) Scalability since internet protocol is the emerging standard.
4) Interoperability and a community portal allow different systems to communicate with each other.
The document discusses intelligent communities and focuses on the Waterloo region as an example. It provides an overview of an panel on intelligent communities featuring representatives from various organizations. It then discusses some of the characteristics that make Waterloo an intelligent community, including collaboration, leadership, innovation at universities, and an entrepreneurial spirit. The document also briefly discusses examples of volunteerism and culture in Waterloo. Finally, it covers some of the challenges in healthcare globally and in Canada, as well as key trends in health including electronic records, mobile health, and emphasis on community care.
The panel discussed different types of audience participation in intelligent communities, including asynchronous participation where the audience engages independently of others, synchronous participation where the audience engages together in real-time, and pervasive participation where engagement is integrated into daily life. The panel also explored moving towards "sublime participation" that provides a highly engaged experience through authored interaction, closing the immersion loop, and value innovation.
The document summarizes a panel discussion on the intelligent community and the economic and social impact of 21st century smart networks. The panelists discussed ideas around building sustainable cities with low-carbon energy and new transportation systems to create new economic models. Specifically, they discussed concepts like "mesh cities" that are mobile, efficient, subtle, and heuristic. One case study highlighted how crowd-sourced innovation was used to redesign the TTC website in just 14 days.
This document discusses a roundtable on intelligent communities that took place in Glasgow, Scotland and Guadalajara, Mexico. It was led by Ronnie Melrose from IBM UK and John Longbottom, the Smart Cities Leader from IBM Canada. The roundtable focused on getting started on the path to developing intelligent communities.
This document discusses the challenges facing cities and populations due to globalization and climate change. It notes that cities must provide sustainable resources like food, water, energy to growing populations in the face of more extreme weather. The author proposes that next generation communities should be regenerative, producing more energy than used and minimizing their environmental footprint while enhancing social support networks to be more resilient.
The document discusses knowledge mapping a community. It focuses on attracting, transacting, and reacting to customers through CRM systems as well as content intelligence. Collaboration and measuring and comparing performance are also mentioned as important aspects of knowledge mapping a community.
In the rapidly evolving landscape of technologies, XML continues to play a vital role in structuring, storing, and transporting data across diverse systems. The recent advancements in artificial intelligence (AI) present new methodologies for enhancing XML development workflows, introducing efficiency, automation, and intelligent capabilities. This presentation will outline the scope and perspective of utilizing AI in XML development. The potential benefits and the possible pitfalls will be highlighted, providing a balanced view of the subject.
We will explore the capabilities of AI in understanding XML markup languages and autonomously creating structured XML content. Additionally, we will examine the capacity of AI to enrich plain text with appropriate XML markup. Practical examples and methodological guidelines will be provided to elucidate how AI can be effectively prompted to interpret and generate accurate XML markup.
Further emphasis will be placed on the role of AI in developing XSLT, or schemas such as XSD and Schematron. We will address the techniques and strategies adopted to create prompts for generating code, explaining code, or refactoring the code, and the results achieved.
The discussion will extend to how AI can be used to transform XML content. In particular, the focus will be on the use of AI XPath extension functions in XSLT, Schematron, Schematron Quick Fixes, or for XML content refactoring.
The presentation aims to deliver a comprehensive overview of AI usage in XML development, providing attendees with the necessary knowledge to make informed decisions. Whether you’re at the early stages of adopting AI or considering integrating it in advanced XML development, this presentation will cover all levels of expertise.
By highlighting the potential advantages and challenges of integrating AI with XML development tools and languages, the presentation seeks to inspire thoughtful conversation around the future of XML development. We’ll not only delve into the technical aspects of AI-powered XML development but also discuss practical implications and possible future directions.
Webinar: Designing a schema for a Data WarehouseFederico Razzoli
Are you new to data warehouses (DWH)? Do you need to check whether your data warehouse follows the best practices for a good design? In both cases, this webinar is for you.
A data warehouse is a central relational database that contains all measurements about a business or an organisation. This data comes from a variety of heterogeneous data sources, which includes databases of any type that back the applications used by the company, data files exported by some applications, or APIs provided by internal or external services.
But designing a data warehouse correctly is a hard task, which requires gathering information about the business processes that need to be analysed in the first place. These processes must be translated into so-called star schemas, which means, denormalised databases where each table represents a dimension or facts.
We will discuss these topics:
- How to gather information about a business;
- Understanding dictionaries and how to identify business entities;
- Dimensions and facts;
- Setting a table granularity;
- Types of facts;
- Types of dimensions;
- Snowflakes and how to avoid them;
- Expanding existing dimensions and facts.
Introduction of Cybersecurity with OSS at Code Europe 2024Hiroshi SHIBATA
I develop the Ruby programming language, RubyGems, and Bundler, which are package managers for Ruby. Today, I will introduce how to enhance the security of your application using open-source software (OSS) examples from Ruby and RubyGems.
The first topic is CVE (Common Vulnerabilities and Exposures). I have published CVEs many times. But what exactly is a CVE? I'll provide a basic understanding of CVEs and explain how to detect and handle vulnerabilities in OSS.
Next, let's discuss package managers. Package managers play a critical role in the OSS ecosystem. I'll explain how to manage library dependencies in your application.
I'll share insights into how the Ruby and RubyGems core team works to keep our ecosystem safe. By the end of this talk, you'll have a better understanding of how to safeguard your code.
How to Interpret Trends in the Kalyan Rajdhani Mix Chart.pdfChart Kalyan
A Mix Chart displays historical data of numbers in a graphical or tabular form. The Kalyan Rajdhani Mix Chart specifically shows the results of a sequence of numbers over different periods.
Taking AI to the Next Level in Manufacturing.pdfssuserfac0301
Read Taking AI to the Next Level in Manufacturing to gain insights on AI adoption in the manufacturing industry, such as:
1. How quickly AI is being implemented in manufacturing.
2. Which barriers stand in the way of AI adoption.
3. How data quality and governance form the backbone of AI.
4. Organizational processes and structures that may inhibit effective AI adoption.
6. Ideas and approaches to help build your organization's AI strategy.
OpenID AuthZEN Interop Read Out - AuthorizationDavid Brossard
During Identiverse 2024 and EIC 2024, members of the OpenID AuthZEN WG got together and demoed their authorization endpoints conforming to the AuthZEN API
HCL Notes and Domino License Cost Reduction in the World of DLAUpanagenda
Webinar Recording: https://www.panagenda.com/webinars/hcl-notes-and-domino-license-cost-reduction-in-the-world-of-dlau/
The introduction of DLAU and the CCB & CCX licensing model caused quite a stir in the HCL community. As a Notes and Domino customer, you may have faced challenges with unexpected user counts and license costs. You probably have questions on how this new licensing approach works and how to benefit from it. Most importantly, you likely have budget constraints and want to save money where possible. Don’t worry, we can help with all of this!
We’ll show you how to fix common misconfigurations that cause higher-than-expected user counts, and how to identify accounts which you can deactivate to save money. There are also frequent patterns that can cause unnecessary cost, like using a person document instead of a mail-in for shared mailboxes. We’ll provide examples and solutions for those as well. And naturally we’ll explain the new licensing model.
Join HCL Ambassador Marc Thomas in this webinar with a special guest appearance from Franz Walder. It will give you the tools and know-how to stay on top of what is going on with Domino licensing. You will be able lower your cost through an optimized configuration and keep it low going forward.
These topics will be covered
- Reducing license cost by finding and fixing misconfigurations and superfluous accounts
- How do CCB and CCX licenses really work?
- Understanding the DLAU tool and how to best utilize it
- Tips for common problem areas, like team mailboxes, functional/test users, etc
- Practical examples and best practices to implement right away
Your One-Stop Shop for Python Success: Top 10 US Python Development Providersakankshawande
Simplify your search for a reliable Python development partner! This list presents the top 10 trusted US providers offering comprehensive Python development services, ensuring your project's success from conception to completion.
GraphRAG for Life Science to increase LLM accuracyTomaz Bratanic
GraphRAG for life science domain, where you retriever information from biomedical knowledge graphs using LLMs to increase the accuracy and performance of generated answers
Programming Foundation Models with DSPy - Meetup SlidesZilliz
Prompting language models is hard, while programming language models is easy. In this talk, I will discuss the state-of-the-art framework DSPy for programming foundation models with its powerful optimizers and runtime constraint system.
Project Management Semester Long Project - Acuityjpupo2018
Acuity is an innovative learning app designed to transform the way you engage with knowledge. Powered by AI technology, Acuity takes complex topics and distills them into concise, interactive summaries that are easy to read & understand. Whether you're exploring the depths of quantum mechanics or seeking insight into historical events, Acuity provides the key information you need without the burden of lengthy texts.
5th LF Energy Power Grid Model Meet-up SlidesDanBrown980551
5th Power Grid Model Meet-up
It is with great pleasure that we extend to you an invitation to the 5th Power Grid Model Meet-up, scheduled for 6th June 2024. This event will adopt a hybrid format, allowing participants to join us either through an online Mircosoft Teams session or in person at TU/e located at Den Dolech 2, Eindhoven, Netherlands. The meet-up will be hosted by Eindhoven University of Technology (TU/e), a research university specializing in engineering science & technology.
Power Grid Model
The global energy transition is placing new and unprecedented demands on Distribution System Operators (DSOs). Alongside upgrades to grid capacity, processes such as digitization, capacity optimization, and congestion management are becoming vital for delivering reliable services.
Power Grid Model is an open source project from Linux Foundation Energy and provides a calculation engine that is increasingly essential for DSOs. It offers a standards-based foundation enabling real-time power systems analysis, simulations of electrical power grids, and sophisticated what-if analysis. In addition, it enables in-depth studies and analysis of the electrical power grid’s behavior and performance. This comprehensive model incorporates essential factors such as power generation capacity, electrical losses, voltage levels, power flows, and system stability.
Power Grid Model is currently being applied in a wide variety of use cases, including grid planning, expansion, reliability, and congestion studies. It can also help in analyzing the impact of renewable energy integration, assessing the effects of disturbances or faults, and developing strategies for grid control and optimization.
What to expect
For the upcoming meetup we are organizing, we have an exciting lineup of activities planned:
-Insightful presentations covering two practical applications of the Power Grid Model.
-An update on the latest advancements in Power Grid -Model technology during the first and second quarters of 2024.
-An interactive brainstorming session to discuss and propose new feature requests.
-An opportunity to connect with fellow Power Grid Model enthusiasts and users.
TrustArc Webinar - 2024 Global Privacy SurveyTrustArc
How does your privacy program stack up against your peers? What challenges are privacy teams tackling and prioritizing in 2024?
In the fifth annual Global Privacy Benchmarks Survey, we asked over 1,800 global privacy professionals and business executives to share their perspectives on the current state of privacy inside and outside of their organizations. This year’s report focused on emerging areas of importance for privacy and compliance professionals, including considerations and implications of Artificial Intelligence (AI) technologies, building brand trust, and different approaches for achieving higher privacy competence scores.
See how organizational priorities and strategic approaches to data security and privacy are evolving around the globe.
This webinar will review:
- The top 10 privacy insights from the fifth annual Global Privacy Benchmarks Survey
- The top challenges for privacy leaders, practitioners, and organizations in 2024
- Key themes to consider in developing and maintaining your privacy program
Main news related to the CCS TSI 2023 (2023/1695)Jakub Marek
An English 🇬🇧 translation of a presentation to the speech I gave about the main changes brought by CCS TSI 2023 at the biggest Czech conference on Communications and signalling systems on Railways, which was held in Clarion Hotel Olomouc from 7th to 9th November 2023 (konferenceszt.cz). Attended by around 500 participants and 200 on-line followers.
The original Czech 🇨🇿 version of the presentation can be found here: https://www.slideshare.net/slideshow/hlavni-novinky-souvisejici-s-ccs-tsi-2023-2023-1695/269688092 .
The videorecording (in Czech) from the presentation is available here: https://youtu.be/WzjJWm4IyPk?si=SImb06tuXGb30BEH .
2. iCanada Conference
Building an Intelligent Nation
Assessing Intelligent Communities
New Weighs of Seeing
Chris Miller
CEO Illuminomics
Nov 16th 2011
2 Illuminomics | PO Box 10754, Savannah, GA 31412 | 912-484-7192 |
www.illuminomics.com
3. A Move Beyond the Basics
• Measuring the new economy with old tools?
• New sources and lots of them
• Moving beyond quantity and measuring quality
• Taking a holistic approach - its not just about jobs
• Keepin’ it real - what counts, what doesn’t
• Digging deep
• Ways to measure
• Innovative approaches
• Anecdotal measures
• What does success look like?
3 Illuminomics | PO Box 10754, Savannah, GA 31412 | 912-484-7192 |
www.illuminomics.com
4. The Valdosta Story
Context
The city of Valdosta is located in south-central Georgia and because of
regional and historic factors, has seen relatively low average wages and
slow economic growth.
As with many rural areas and major parts of the U.S., they have seen a
once strong manufacturing base steadily erode over time, dramatically
altering the regional economy and putting downward pressure on overall
average wages.
These job losses were somewhat offset by rapid growth in the retail sector
as Valdosta became a major shopping destination for traffic on the I-85
corridor as well as the region. However, because of the historically low
wages paid by the retail sector, it did little to staunch the continued decline
of overall average wages within the community.
4
5. The Valdosta Story
Targeting Smart Sectors
In 2004 Valdosta-Lowndes Chamber of Commerce, headed by Myrna
Ballard, engaged illuminomics to help craft an innovative, strategic
framework that would increase average wages in the region by the targeted
growth and creation of higher-wage, knowledge-based and creative jobs.
Now, after 5 years of steady progress in creating and enhancing the
economic, social and urban environmental factors that can accelerate the
growth and creation of “smart jobs”, Valdosta has arrived at point where the
direct impact of these programs can be easily seen and measured by solid,
authoritative and quantifiable data.
This data, from the U.S. Bureau of Labor Statistics and the U.S.
Department of Labor, shows that not only has this targeted strategic effort
slowed down the decades long decline of the regional average wage, it has
quite literally, turned it around.
5
6. The Valdosta Story
The Results
As you will see in the next few slides, during the period that the Chamber has run
its TBEC program (Targeted Business Expansion Council) Valdosta has gone from
a declining economic position, relative to the U.S., Georgia and its peer group of
similar cities, to a complete reversal with Valdosta now outperforming the U.S., the
state of Georgia, and 5 of its 6 peer group cities in “TBEC-sector” job growth,
average wage growth, as well as wage cost of housing declines (% of monthly
salary devoted to housing).
The purpose of this brief summary and the attached graphs is to show that by
enhancing the economic, social, urban and environmental factors attractive to high-
wage job workers, with a clear focus, innovative programs, a high degree of
collaboration and a steady effort, that a community can take control of its own
economic fate and turn-around even the toughest case of historic declines into
becoming an “intelligent city” capable of competing in the modern global economy.
This is a “proof-of-the-pudding” success story. It isn’t quick, it isn’t easy, but in a
day and age of very tough economic head-winds and significant national job
losses, it should be encouraging to know that the path to becoming an intelligent
city works; and in doing so, it is possible to turn around the economy of a city and
improve the quality of life for its residents.
6
7. Valdosta-Lowndes 2011 Economic Survey
prepared by Illuminomics for Valdosta-Lowndes Chamber of Commerce
Regional Wage and Employment Trends
A Comparative Analysis 1990-2010
The following analysis was performed by Illuminomics with the support of the
Valdosta-Lowndes Chamber of Commerce.
All data contained in this analysis is taken directly from the most authoritative local,
state and nationally recognized sources, using the most currently available data sets.
To ensure data accuracy and integrity, no multipliers were used in any calculations
and all non-confidential data can be independently verified from public sources.
Chris Miller
CEO Illuminomics
Myrna Ballard
President Chamber of Commerce
Tara Nichols
Vice President Chamber of Commerce
Nov 11th 2011 v4.5
7 Illuminomics | PO Box 10754, Savannah, GA 31412 | 912-484-7192 |
www.illuminomics.com
8. Targeted Business Expansion Sectors
NAICS TBEC Sector Description
Information Technology
511-- Publishing industries (including software)
512-- Motion picture and sound recording industries
515-- Broadcasting, except Internet
516-- Internet publishing and broadcasting
517-- Telecommunications
518-- Data processing, hosting and related services
519-- Other information services
Environmental Technology
541-- Professional, technical & design services
551-- Management of companies and enterprises
Medical Services & Support (listed separately as “Health Care”)
621-- Ambulatory health care services (physicians, dentists, labs, etc)
622-- Hospitals
** North American Industrial Classification System (NAICS) codes provide a 1 to 5 digit classification number to
8 describe various types of economic activity. TBEC and TBEC+ are composites of the above 3 digit NAICS codes.
9. Economic Sector Size by Jobs
Valdosta MSA, 2010
Sector Size by Percent of Total Jobs
35%
31.1%
30%
25%
% of total jobs
20%
15.8%
14.6%14.2%
15% 12.8%
11.3%
10% 7.5%
5.0% 4.1% 4.1%
5% 3.0% 2.8% 2.2% 2.1%
1.4% 0.4%
0%
& e
A 'ho vt
Es r.
dm ac re
le or g
H eG .
Tr Fe ru s
lG n
nc Tr y
C er g
n
& de
Re T t
isu il T C
t
uc te
at sp
ov
M al ov
st ce
e ad
na le tr
tio
al su
s. era tio
ho F in
S in
Le ta BE
o
uf Ca
Ed ta
Fi sa es
re ra
St Ho
W g & us
in tur
lG
Re In
on vi
an d c
a
an th
ca
W
Lo
e
&
A
9 SOURCE: Bureau of Labor Statistics - Quarterly Census of Employment and Wages - www.bls.gov/data
10. Economic Sector Size by Wages
Valdosta MSA, 2010
Sector Size by Percent of Total Wages
40%
34.5%
% of total wages
30%
19.4%
20%
15.4%
13.7%
10.9%
9.7%
10%
5.7% 5.6% 5.2% 5.1%
4.1%
2.9% 2.8% 2.0%
1.4%
0.3%
0%
Fo e
& ruc t
A le ur.
an il T e
na Se ing
Tr C ral p.
ou n
le & I s
uc te
es y
Fe & ng
n
isu ct e
t
at EC
lth ovt
s. st ov
ov
e
& rad
al str
tio
A W' tio
M ta ar
Le ufa ad
s
Ed ta
W nc rvic
sa ns
re uri
St TB
de Ho
an on G
s
lG
H eG
Re C
Re r e
a
r
T
ca
dm h
ho e
ea
Lo
Fi in
10 g
SOURCE: Bureau of Labor Statistics - Quarterly Census of Employment and Wages - www.bls.gov/data
11. Economic Sector Size by Wages vs. Jobs
Valdosta MSA, 2010
Sector Size by Percent of Wages vs. Jobs
34.5%
31.1%
% of total jobs vs. total wages
25%
19.4%
20% 15.8%
15.4%
13.7% 14.6%
15% 14.2%
Total Wages
12.8%
11.3%
10.9%
9.7% Total Jobs
10%
7.5%
5.7% 5.6% 5.2%
5.1% 5.0%
5% 4.1% 4.1%
3.0%
4.1%
2.9% 2.8% 2.8% 1.4%
2.1% 2.2%
2.0%
1.4% 0.4%
0.3%
0%
Fo e
& uc t
A le ur.
an il T e
na Se ing
.
ou n
& es
uc te
es y
Fe & H g
n
isu ct e
t
at EC
lth ovt
s. str ov
sp
ov
& rad
al str
tio
A W' tio
M ta ar
Le ufa ad
n
Ed ta
W nce rvic
sa Ins
re uri
St TB
de o
an n G
s
lG
H eG
Re C
Re r e
a
r
T
Tr Co ral
ca
dm h
ea
Lo
Fi in
le
g
ho
11 SOURCE: Bureau of Labor Statistics - Quarterly Census of Employment and Wages - www.bls.gov/data
12. 12
average annual salary
Tr
an
s.
& Ut
$20,000
$40,000
$60,000
$80,000
$0
W ilit
Fe 'ho ies 70
Fi de us ,6
na r in 29
nc al g 51
M e Go ,5
a 67
W nu & In vt 41
ho fa s ,9
80
le ct ur. 41
sa ur ,8
80
C le ing 39
on Tr ,4
st ad 48
ru e 38
ct ,2
io 95
H 37
ea TB n ,9
lth EC 10
37
St C ,3
$42,859
at a 81
r 37
Lo e G e ,1
SOURCE: Bureau of Labor Statistics - Quarterly Census of Employment and Wages - www.bls.gov/data
15
Georgia avg wage
ca o
v
Valdosta MSA, 2010
36
A Re l G t ,4
dm a o 74
l v 33
in Est t ,7
Se at 24
Re rv e 29
,4
Average Wages by Sector
A tai ice 86
g lt s 25
Average Annual Salary by Sector
& ra ,2
Fo de 64
22
Le Ed res ,7
isu uc try 30
22
re at ,3
& ion 48
H 20
,9
os
$30,416
88
p. 12
,1
97
Valdosta avg wage
13. Short Term Economic Change
Valdosta MSA, 2001-2010
15.5% Average Annual Percent Job Growth by Sector
annual % change in number of jobs
15%
10.5%
10%
Valdosta 9 year annualized
6.4%
5.7% 5.3% job growth +0.4%
5.2% 5.1%
4.6%
5%
2.9%
-0.5%
0.7% 0.2% -0.9%
0% -3.3%
e
ovt
.
ng
es
tion
ng
sp.
stry
ovt
C
de
tion
re
ovt
tate
sur
rad
TBE
Ca
vic
turi
usi
Tra
Ho
lG
al G
te G
& In
ore
ruc
ca
-3.0%
l Es
-5% eT
Ser
'ho
alth
ac
era
e&
ail
-4.5%
Edu
&F
nst
Rea
Loc
sal
Sta
ce
&W
nuf
Ret
min
Fed
He
sur
Co
ole
Ag
an
Ma
Lei
Ad
ns.
Fin
Wh
Tra
13 SOURCE: Bureau of Labor Statistics - Quarterly Census of Employment and Wages - www.bls.gov/data
14. Short vs. Long Term Economic Change
Valdosta MSA, 2001-2010
Average Annual Percent Job Growth by Sector
annual % change in number of jobs
16% 15.5% 1992-2010 vs. 2001-2010
overall average annual growth
12.5% 1992-2010 2001-2010
12% 11.0% 10.5%
8.7%
8%
6.4% 6.3%
5.4% 5.7% 5.6% 5.8%
5.3% 5.2%
4.1% 4.6%
4.3%
3.9%
4% 2.9%
2.1% 1.4%
1.3%
5.1% 0.6% 1.1%
0.7%
0.2% 0.2% 0.4%
0%
-0.5% -0.9%
Education
W'housing
Construction
Manufacturing
TBEC
Services
Leisure &
Finance &
Ag & Forestry
State Govt
Local Govt
Federal Govt
Wholesale
Health Care
Real Estate
Retail Trade
Admin
-2.4%
Trans. &
Hosp.
-4% -3.0%
Insur.
Trade
-3.3%
-4.5%
14 SOURCE: Bureau of Labor Statistics - Quarterly Census of Employment and Wages - www.bls.gov/data
15. TBEC Sector Size and Growth Comparisons
various MSA’s, 2001-2010
TBEC Sector % Share & Annualized Change in Jobs
annualized % change in employment
TBEC Sector Share of All Jobs (2010) 23.2%
TBEC Change in Number of Jobs (2001-2010)
22% 19.6%
All Industies Job Growth 2001-2010 (annualized)
15.8%
16% 14.1%
11.6%
10%
6.0%
4.6%
3.3% 2.9%
4% 1.4% 1.7%
0.4% 0.7%
-2% ns
-0.7% -0.6%
e
e
ny
a
rk
m
st
bi
a
do
la
Ro
lb
b
C
Ro
al
A
s-
V
r-
en
ne
th
ar
A
W
15 SOURCE: Bureau of Labor Statistics - Quarterly Census of Employment and Wages - www.bls.gov/data
16. TBEC Growth Trend Comparisons ST
Valdosta MSA, 2001-2010
Cumulative Job Growth in TBEC and All Industries
40%
cumulative % growth of jobs
TBEC Jobs (+41.4%)
30%
avg. salary: $37,381
20%
All Jobs (+3.9%)
avg. salary: $30,416
10%
All Jobs except TBEC (-0.6%)
0%
2001
2002
2003
2004
2005
2006
2007
2008
2009
2010
-10%
16 SOURCE: Bureau of Labor Statistics - Quarterly Census of Employment and Wages - www.bls.gov/data
17. TBEC Sector Trend Breakdown
Valdosta MSA, 1992-2010
Job Growth Comparison Between TBEC Sectors
10000
8000
number of TBEC+ jobs
Healthcare Services
6000 (+82.4%)
4000
Management of Companies (-55.2%) avg. salary: $47,853
2000
Technical and Professional (+52..3%) avg. salary $43,375
0 Information Services (+103%) avg. salary:
1992
1994
1996
1998
2000
2002
2004
2006
2008
2010
17 SOURCE: Bureau of Labor Statistics - Quarterly Census of Employment and Wages - www.bls.gov/data
18. Long Term Avg Wage Comparisons US
various MSA’s, 1990-2010
Real Avg. Wages as % of U.S. Avg Wage
U.S. average wage = 100%
100%
Georgia (-2.3%)
% of U.S. average wage
90%
Warner-Robbins (+2.6%)
Athens (-9.3%) Rome (-7.9%)
80%
Albany (-6.0%)
70%
Valdosta (-6.4%)
60%
1990
1992
1994
1996
1998
2000
2002
2004
2006
2008
2010
18 SOURCE: Bureau of Labor Statistics - Quarterly Census of Employment and Wages - www.bls.gov/data
19. Short Term Avg Wage Comparisons US
various MSA’s, 2001-2010
Real Avg. Wages as % of U.S. Avg Wage
U.S. average wage = 100%
100%
Georgia (-5.3%)
% of U.S. average wage
90% Warner-Robbins (+4.3%)
Athens (-1.6%)
80% Rome (-3.0%)
Albany (-0.9%)
70%
Valdosta (+0.9%)
60%
2001
2002
2003
2004
2005
2006
2007
2008
2009
2010
19 SOURCE: Bureau of Labor Statistics - Quarterly Census of Employment and Wages - www.bls.gov/data
20. Percent of Salary Spent on Housing US
various MSA’s, 2005-2010
Wage Cost of Homeownership as a % of U.S.
120%
Valdosta (-3.3%)
% above or below US avg
110% Athens (+1.7%)
Georgia (+2.8%)
USA ( = to 100%)
100%
Warner-Robbins (-2.3%)
Albany (-1.2%)
90%
Rome (+11.1%)
80%
2005
2006
2007
2008
2009
2010
20 SOURCE: Bureau of Labor Statistics - Quarterly Census of Employment and Wages - www.bls.gov/data
21. A Final Word
About the Data In This Analysis
Illuminomics used data for its analysis from the most authoritative sources: The Georgia
Department of Labor, U.S. Bureau of Labor Statistics, the U.S. Department of Labor and the
U.S. Census Bureau. To obtain private disaggregate wage and employment data,
Illuminomics and the Valdosta-Lowndes Chamber signed a confidentiality agreement with the
Georgia Department of Labor to protect individual company data concerning employment
and wages, especially in circumstances when only a few companies reside in a specific
sector. Therefore, there are times when the public data and the privately aggregated data
differ. In those circumstances, the privately aggregated data contained in this report is the
more accurate.
Moreover, the Georgia Department of Labor constantly revises its historical data sets. Those
revisions are not always released to the public. Illuminomics, however, has access to those
revisions and has incorporated them into this analysis. In some cases that may cause public
and privately aggregated data to differ ever so slightly, with this analysis often more
accurate than what would be available to the general public.
Finally, care should be taken when comparing two data sets representing the same
information. Those data sets may differ in locality (MSA vs. County), time period (month vs.
quarter); interval time-length and industry control (private vs. public sector).
Chris Miller
cmiller@illuminomics.com
21 Illuminomics | PO Box 10754, Savannah, GA 31412 | 912-484-7192 |
www.illuminomics.com
22. Quantity Growth or Quality Impact?
DAIMLER-CHYSLER TCCi
total jobs created 3000 199
total project expenditures $320,000,000 $590,351
total annual wages created $164,805,000 $11,094,135
project cost per job created $106,666 $2,967
wages generated/$ spent $0.51 $18.79
wages generated/acre $96,944 $9,984,721
22 Illuminomics | PO Box 10754, Savannah, GA 31412 | 912-484-7192 |
www.illuminomics.com
23. What’s Really Going On?
Chatham County, 1990-2005
The Two Most Significant 15 Year Employment Trends
18,000
Average Annual Salary : $13,993
17,000
16,000
Manufacturing
15,000 Leisure and
Hospitality
Jobs
14,000 Manufacturing
Leisure &
13,000 Hospitality
12,000
Average Annual Salary : $55,986
11,000
10,000
1990 1992 1994 1996 1998 2000 2002 2004
23 Illuminomics | PO Box 10754, Savannah, GA 31412 | 912-484-7192 |
www.illuminomics.com
25. New Tools For a New Economy
Who Do Ya Love? ……….SAVANNAH!
How the world views various places from the lens of Internet search engines.
Go to Google, type in “I Love <any city>”, then substitute “hate” for “love”.
What you get is a love/hate ratio. What you get is a number for how many people felt
strongly enough about their like/dislike opinions to put it somewhere on a web page.
These numbers are what they are and no one can really manipulate them.
The simple fact is: People are passionate about Savannah!
love/hate ratio: 47.1 love/hate ratio: 11.0
"i love savannah" +ga: 1,130 "i love charlotte" +nc: 1050
"i hate savannah" +ga: 24 "i hate charlotte" +nc: 95
love/hate ratio: 32.5 love/hate ratio: 5.6
"i love asheville" +nc: 586 "i love raleigh" +nc: 284
"i hate asheville" +nc: 18 "i hate raleigh" +nc: 51
love/hate ratio: 16.9 love/hate ratio: 3.2
"i love greenville" +sc: 104 "i love jacksonville" +fl: 264
"i hate greenville" +sc: 10 "i hate jacksonville" +fl: 82
love/hate ratio: 16.9 love/hate ratio: 1.9
"i love charleston" +sc: 473 "i love atlanta" +ga: 908
"i hate charleston" +sc: 28 "i hate atlanta" +ga: 483
25 Illuminomics | PO Box 10754, Savannah, GA 31412 | 912-484-7192 |
www.illuminomics.com
26. So Much Data, So Little Mining
• studies & reports • independent ratings/rankings
• wikipedia • newspaper/magazine articles
• ground proofing • yellow pages
• google search • blogs
• surveys • twitter posts
• interviews • web sites
• govt info • ranking
- fed- census, DOL, BLS, FBI
• private data sources
- state - Chamber
- county - CVB
- realtors
- city
- colleges
- econ dev
26 Illuminomics | PO Box 10754, Savannah, GA 31412 | 912-484-7192 |
www.illuminomics.com
27. How Cool is Cool
Surveying the Urban Landscape
inviting sidewalks visible transition between size of historic area
urban/suburb/rural auto orientation
outside tables
street activity Way-finding
pedestrians
density mixed use
tree canopy
distance to water mixed income
meeting places
tree canopy parks
public space
park benches good lighting
interesting architecture
public restrooms utility placement
wifi networks
"cool spots" architecture
bicycles charm
coffee shops
cleanliness critical mass
live music venues
dominant features cleanliness / litter
interesting layout
smell
27 Illuminomics | PO Box 10754, Savannah, GA 31412 | 912-484-7192 |
www.illuminomics.com
28. Summing It All Up
Intelligent cities need to be measured in intelligent ways
There is a wealth of new data out there
Look and think beyond the obvious
Focus on quality, not just quantity
Take a holistic perspective
Benchmark against others
Consider the trends
Think long-term
Keep it real
Thank you!
Chris Miller
Illuminomics
28 Illuminomics | PO Box 10754, Savannah, GA 31412 | 912-484-7192 |
www.illuminomics.com