Download to read offline
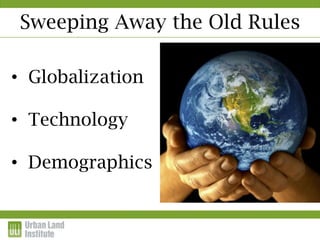

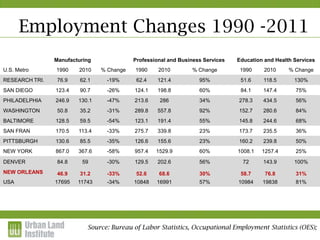
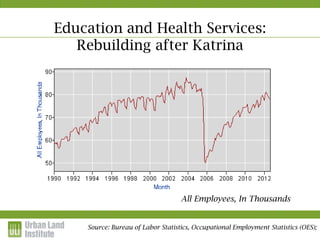


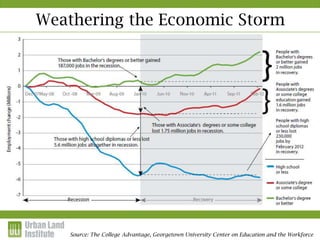
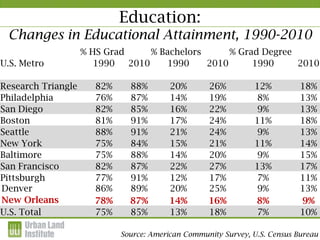
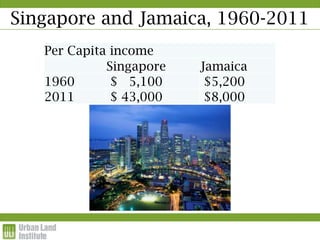


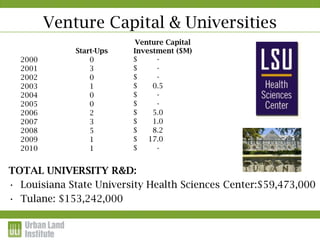


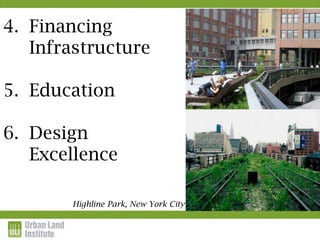


The document discusses factors driving changes in the US economy including globalization, technology, and demographics. It presents data showing declines in manufacturing employment but growth in professional services and education/health services across various metro areas from 1990-2010. The trends suggest an ongoing shift toward a knowledge-based economy. Key strategies discussed for cities include investing in infrastructure, education, research institutions, and fostering entrepreneurship through partnerships between universities and industry. Overall the document advocates that cities build on innovation and human capital to compete successfully in the 21st century global economy.


