Download to read offline
![Project management Office – setting up the ‘Measuring’-serviceProject management Office – setting up the ‘Measuring’-service July 2014 page 6 • BSC
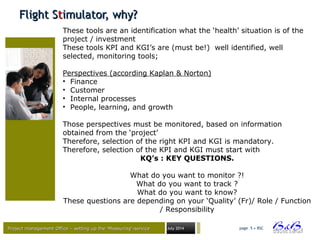
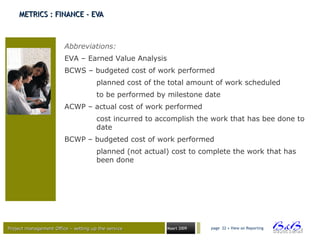
Flight SFlight Sttimulator, how?imulator, how?
Measure is to know
Control and improve your project , programme , portfolio
Identify the elements that have an impact on the outcome:
First,
you design the ‘service’:
Define the most correct questions.
And,
get answers on KEY QUESTIONS ! [ KPQ and KPQ ]
How to perform?
What are the metrics to identify the performance ‘grade’
What Goals ?
What achievements ?
Secondly,
Where can I find the information , or data to measure the
specific metric](https://image.slidesharecdn.com/flightstimulator1-150203055156-conversion-gate01/85/Project-Management-Flight-stimulator-1-0-6-320.jpg)
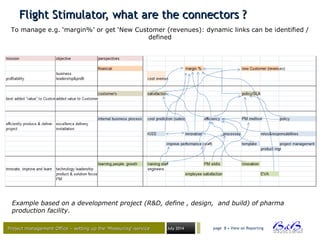


![Project management Office – setting up the ‘Measuring’-serviceProject management Office – setting up the ‘Measuring’-service July 2014 page 15 • View on Reporting
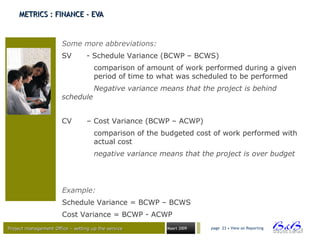
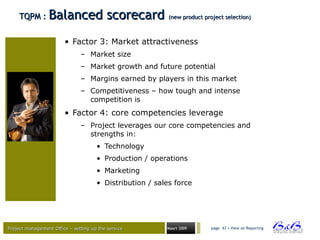
some interesting PM criteriasome interesting PM criteria
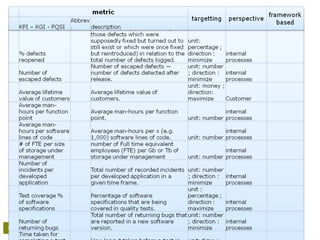
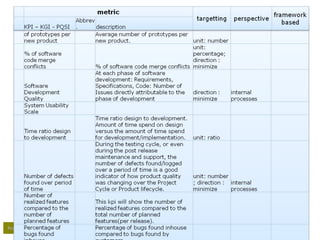
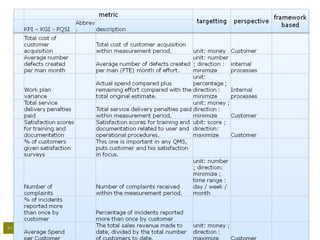
• There is a lot of –valuable - information available when executing
a project, but some interesting data has to be excavated, you
have to know where to find it, and what to do with;
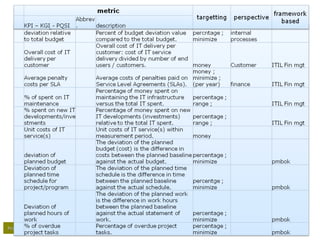
– Time:
• Schedule (overall, per phase;)
• Schedule performance index [SPI]
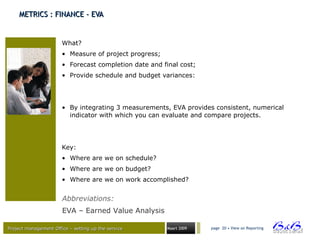
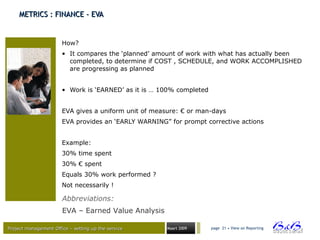
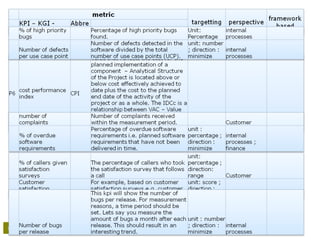
– Finance
• How are we going against budget;
• Cost performance index [CPI];
• Earned value analysis [EVA/-M];
• Return on investment [ROI];
• Net present value [NPV];
• Expected commercial value [ECV];
criteria that constantly emerge (1/2) :
Abbreviations:
SPI - schedule performance index
CPI - cost performance index](https://image.slidesharecdn.com/flightstimulator1-150203055156-conversion-gate01/85/Project-Management-Flight-stimulator-1-0-15-320.jpg)
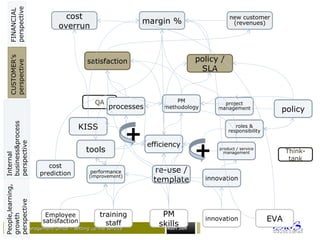
![Project management Office – setting up the ‘Measuring’-serviceProject management Office – setting up the ‘Measuring’-service July 2014 page 16 • View on Reporting
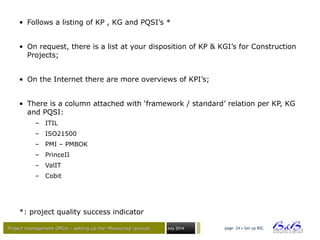
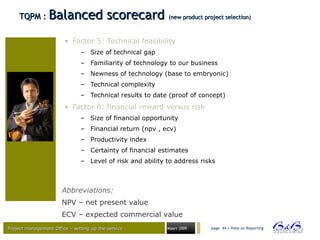
some interesting PM criteriasome interesting PM criteria
• There is a lot of –valuable - information available when executing
a project, but some interesting data has to be excavated, and you
have to know where to find it;
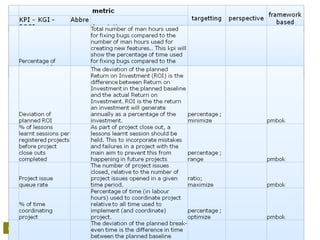
– Resources
• How much time are we spending on the project,
• How many resources we need (globally, per IT department,
roles);
• Do we use the available resources;
– Scope: Is the scope [creep] in line with expectations (?)/ (!);
– Quality (total quality project management – TQPM)
• Is the plan realistically built-up;
• Number of issues reported;
• Are we reviewing and fixing quality problems;
criteria that constantly emerge (2/2) :
note:
An organisation with project tradition, has advantages when building
up a project minded attitude and a benchmark data-warehouse to
assess the projects and improve the project’s success rate, thus
organisation’s strategy outcome.](https://image.slidesharecdn.com/flightstimulator1-150203055156-conversion-gate01/85/Project-Management-Flight-stimulator-1-0-16-320.jpg)


![Jan Biets [jan_biets@hotmail.com], profile picture](https://cdn.slidesharecdn.com/profile-photo-Jan_Biets-48x48.jpg?cb=1762352165)
The document discusses the establishment of a Project Management Office (PMO) focused on performance tracking within project, program, and portfolio management through the use of Key Performance Indicators (KPIs) and Key Goal Indicators (KGIs). It emphasizes the importance of defined metrics, effective communication, and suitable tools for enhancing decision-making and project success rates. The presentation aims to provide a structured approach to measure and report project status, quality, and financial performance, facilitating better alignment with organizational strategy.


