Downloaded 54 times
![Cyril Simonnet [email_address] +971 50 220 9963 / +33 6 08 36 45 97 Contact Details](https://image.slidesharecdn.com/no-subject-4186/85/Ikon-Managed-Services-43-320.jpg)

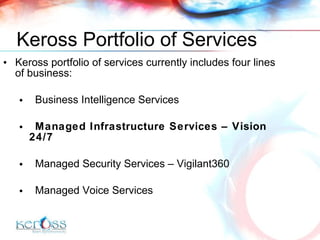
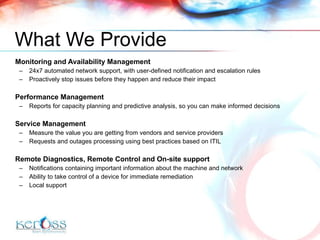
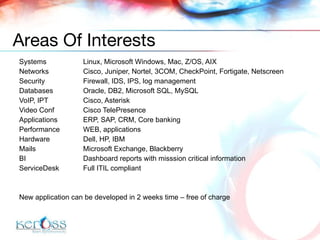
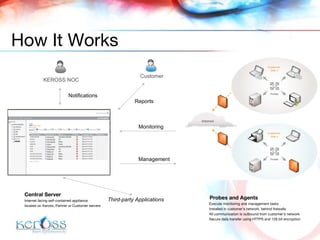
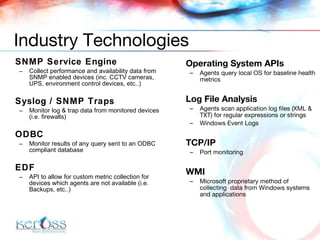
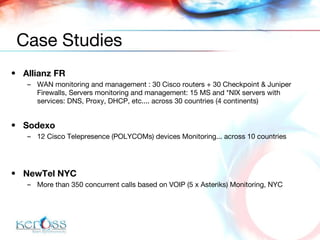
Keross provides managed IT services including business intelligence, managed infrastructure, security, and voice services. Their philosophy is that business success comes from understanding connections between unrelated events, which is why they created their managed services platform to provide technical harmony. Their services monitor and manage operating systems, networks, databases, applications and other systems and devices from various vendors across multiple industries.


