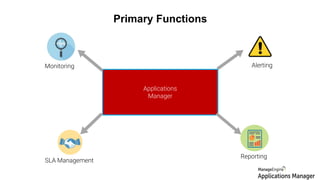
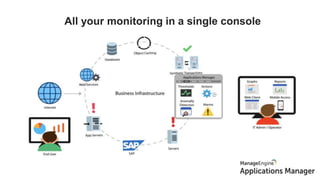
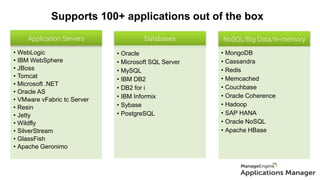
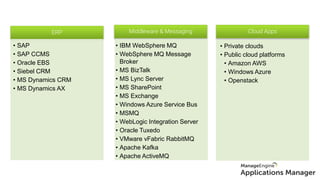
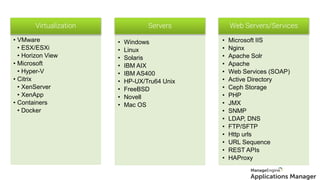
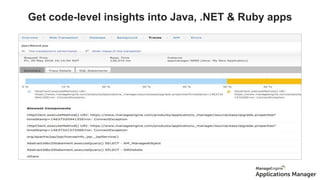
Application performance monitoring software
Applications
Manager
Monitoring
Primary Functions
Alerting
SLA Management
Reporting
Monitor your heterogeneous
IT environment
All your monitoring in a single console
Supports 100+ applications out of the box
• WebLogic
• IBM WebSphere
• JBoss
• Tomcat
• Microsoft .NET
• Oracle AS
• VMware vFabric tc Server
• Resin
• Jetty
• Wildfly
• SilverStream
• GlassFish
• Apache Geronimo
Application Servers Databases
• Oracle
• Microsoft SQL Server
• MySQL
• IBM DB2
• DB2 for i
• IBM Informix
• Sybase
• PostgreSQL
NoSQL/Big Data/In-memory
• MongoDB
• Cassandra
• Redis
• Memcached
• Couchbase
• Oracle Coherence
• Hadoop
• SAP HANA
• Oracle NoSQL
• Apache HBase
ERP Middleware & Messaging Cloud Apps
• SAP
• SAP CCMS
• Oracle EBS
• Siebel CRM
• MS Dynamics CRM
• MS Dynamics AX
• IBM WebSphere MQ
• WebSphere MQ Message
Broker
• MS BizTalk
• MS Lync Server
• MS SharePoint
• MS Exchange
• Windows Azure Service Bus
• MSMQ
• WebLogic Integration Server
• Oracle Tuxedo
• VMware vFabric RabbitMQ
• Apache Kafka
• Apache ActiveMQ
• Private clouds
• Public cloud platforms
• Amazon AWS
• Windows Azure
• Openstack
• VMware
• ESX/ESXi
• Horizon View
• Microsoft
• Hyper-V
• Citrix
• XenServer
• XenApp
• Containers
• Docker
Virtualization Servers
• Windows
• Linux
• Solaris
• IBM AIX
• IBM AS400
• HP-UX/Tru64 Unix
• FreeBSD
• Novell
• Mac OS
Web Servers/Services
• Microsoft IIS
• Nginx
• Apache Solr
• Apache
• Web Services (SOAP)
• Active Directory
• Ceph Storage
• PHP
• JMX
• SNMP
• LDAP, DNS
• FTP/SFTP
• Http urls
• URL Sequence
• REST APIs
• HAProxy
ADDM
Automated discovery and dependency mappingAutomated discovery and dependency
mapping
Discover apps & servers with IP address/CIDR/VMware
Discovery
Visualize dependencies between application components
ADDM
Business service management
View performance stats of the business service
Track resources that support a business service
Monitor groups
Track business service details across geographies from
your admin console
Become aware of performance trends
Supported for:
Transaction level monitoring with APM Insight feature
Server side analytics
• Server side problems need server side monitoring.
• Deep dive metrics – from URL to SQL.
• Transaction profiling.
• Track database operations.
Transaction level metrics
Identify slow queries with transaction traces
Transaction profiling
Database operations
Database
• Apdex scores
• Open standard
• Scale of 0 to 1
• Satisfied, tolerating
and frustrated users
Synthetic monitoring with End User Monitor
Track background transactions
JVM metrics
JVM usage, garbage
collector, and thread
details.
Pinpoint application errors
Synthetic monitoring with a real browser
Monitor from different locations
Helps you record and playback
Record user interactions
with your website and play
them back from a real
browser.
Monitor from different locations
Multi location monitoring
Monitor user interactions with your website
Track page load times
Screen capture and resource split up of your webpage
Analyze performance of each web page component
Capture errors
Screenshot taken upon
error or when the script
changes
Screenshots
Web user experience monitoring
Understand end-user
experience from different
geographical locations.
Version 13.0
Cloud monitoring
Cloud monitoring
Amazon AWS
Monitor Amazon EC2
instances, RDS instances,
EBS volumes and S3
buckets.
Amazon AWS
Windows Azure
Alarms
Azure Storage Account
storage account
Azure Virtual Machines
Openstack deployments
Find and fix issues faster
Get instant alerts when there are errors
Quickly analyze root cause of issues
RCA
Proactively detect errors with dynamic baselines
Anomaly detection
Get code-level insights into Java, .NET & Ruby apps
Transaction profiling
Automation
Automate corrective actions
Supported actions upon failure
• Email/SMS alerts
• Execute corrective scripts
• Execute MBean operations
• Send SNMP traps to third-party
consoles
• Log a ticket to an IT help desk
(ServiceDesk Plus, ServiceNow)
• Trigger Java heap/thread dump or
garbage collection
• Start/Stop/Restart Windows services
• Start/Stop/Restart virtual machines
• Start/stop/restart Amazon EC2
instances
• Start/stop/restart Containers
Create thresholds for various apps/servers
Set up threshold profiles
for key application
attributes and get
notified about important
events.
Set up threshold profiles
for key application
attributes and get notified
about important events.
Automate VM actions
Built in template library or create your own
Automate cloud resource provisioning
Reports
250+ pre-built reports
Reports for every attribute
Reports
Reports that help to plan capacity
Reports
Analyze performance trends
Reports
Forecast reports
Reports
Historical and real time reports
Reports
Raw data reports
Reports
Customizable, interactive dashboards
Embed charts or graphs in
dashboards using dozens
of widgets.
Distributed monitoring for scalability
Enterprise Edition
Hear it from our customers!
Customer stories
“We're very happy with Applications Manager. The level of detail is so critical.
Because most of the times, the simplest of things can have the greatest
impact.“- Carnival Cruise
Challenges:
Ensuring business uptime
and maintaining
communication between data
centers on multiple cruise
ships.
Solution:
Applications Manager records
on-board performance stats so
IT teams can stay in the know
about what happened during the
outage
"We decided to go with Applications Manager because of the simplicity of
its installation, ease of configuration and appealing UI.“- Go Global
Challenge:
Employing an integrated
monitoring tool capable of
providing visibility into the
health of the infrastructure and
apps running across platforms,
both physical and virtual
Solution :
Applications Manager provides
full availability, health and
performance statistics reports
of all the resources.
"We needed something convenient to manage and understand, and the first
hit was Applications Manager. We tried it in the demo mode and immediately
wanted to buy it.”-UniCredit Leasing
Challenge:
Proactively monitor core
businesses like investor
and analytics services as
well as their internal IT.
Solution:
Applications Manager
provides a single
monitoring console for
their critical business
applications and IT
infrastructure elements.
Over 75 educational institutions
Over 100 government organizations
Leading brands across banking, finance, energy, airline, automobile,
software, healthcare, hospitality and tourism industries
trust Applications Manager!
Summary
• End-to-end visibility with an integrated monitoring approach.
• Visualize application dependencies with dynamic dependency mapping.
• Detect issues faster with advanced troubleshooting techniques.
• Easy to deploy. No training or consultation required.
• Flexible and extensible.
THANK YOU!
Download a 30-day free trial at
www.manageengine.com/apm
For personalized demo visit:
demo.appmanager.com

Applications Manager Technical Overview