Domino Fitness. Time for a Health CheckJared Roberts
Here we explore your Domino ’fitness’ - that is - how well your Domino environment is performing, and show you how to execute a comprehensive health check including performance, security, database health, new features, and much more. Are you Domino fit?
Cloud Migration Paths: Kubernetes, IaaS, or DBaaSEDB
Moving to the cloud is hard, and moving Postgres databases to the cloud is even harder. Public cloud or private cloud? Infrastructure as a Service (IaaS), or Platform as a Service (PaaS)? Kubernetes for the application, or for the database and the application? This talk will juxtapose self-managed Kubernetes and container-based database solutions, Postgres deployments on IaaS, and Postgres DBaaS solutions of which EDB’s DBaaS BigAnimal is the latest example.
This presentation is from the Integration Day event, a TechMeet360 Community Initiative, held on September 10, 2016 at Microsoft GSTC in Bangalore. In this slide, Microsoft's Escalation Engineers Tulika Chaudharie and Harikharan Krishnaraju gives an introduction on Workflow Automation with Logic Apps. The session covers some of the common workflow techniques used across the industry and how to automate the process using Logic Apps. Also, it demonstrates the ways to create nested workflows. Also, there will be demos showcasing the seamless integration.
Alles was Sie über HCL Notes 14 wissen müssenpanagenda
Webinar Recording: https://www.panagenda.com/webinars/alles-was-sie-uber-hcl-notes-14-wissen-mussen/
Die Release von HCL Notes 14 ist immer noch in aller Munde. Wenn Sie an diesem Webinar teilnehmen, könnte die Version sogar schon verfügbar sein. Aufregend! Es gibt viel zu bestaunen: neue Version der JVM, neue Eclipse-Version, und der Client ist nur noch als 64-Bit-Version verfügbar – um nur einige Highlights zu nennen. Ein guter Zeitpunkt, um darüber nachzudenken, ob, wie und wann der Umstieg auf Notes 14 sinnvoll sein könnte. Seien Sie versichert, dass alle Antworten, die Sie brauchen, in diesem Webinar bekommen werden.
Nehmen Sie an unserem Webinar mit dem HCL-Botschafter und führenden Experten Marc Thomas teil. Sie erhalten einen umfassenden Überblick und können den geschäftlichen Nutzen, aber auch die Kosten einer Umstellung besser einschätzen. Alles, was Sie wissen müssen und tun sollten, egal ob Sie bereits mitten im Upgrade sind oder noch die Vor- und Nachteile abwägen.
Was Sie lernen werden
- Was ist neu in HCL Notes 14?
- Ist HCL Notes 14 die richtige Wahl für Sie oder ist Notes 12 besser?
- Was ist vor einem Upgrade zu beachten?
- Welche Herausforderungen bringen 64-bit Notes Clients mit sich?
- Welche Probleme sind bekannt und welche Lösungen gibt es?
- Tipps und Tricks, um das Meiste aus Notes 14 herauszuholen
In this short presentation, you'll be able to learn the essentials in selling 3CX Phone System and 3CX Web Meeting.
The presentation is divided in two separate sections.
First section presents the company profile and it's position on IT&C market, the product line and their features.
The second section is dedicated for 3CX Partners with specific data about partner program and advanced pre-sales information.
Thank you for watching and have a wonderful 3CX!
This slide deck provides the basics of how to build an Azure Logic App. This presentation was presented by Kuppurasu Nagaraj, a Microsoft MVP during the TechMeet360 event organized by BizTalk360, held on December 17, 2016 at Coimbatore.
Finance Analytics solution based on open source including KPIs, reports, OLAP Analysis, Dashboards, Scorecards, Big Data and Machine Learning with 'predefined templates, dashboards and KPIs/ratios' and fully customizable environment
Two of the tech industry’s essential front runners providing business intelligence solutions are Microsoft’s Power BI and Tableau. These leaders of data visualization help businesses narrow down and analyze their data with powerful built-in tools and clear visualizations. Each platform has distinctive strengths and weaknesses that should be considered before deciding on a business intelligence software.
Affirma is a top Business Intelligence Consultant:
http://www.affirmaconsulting.com/our-services/business-intelligence-consulting/
Two of the tech industry’s essential front runners providing business intelligence solutions are Microsoft’s Power BI and Tableau. These leaders of data visualization help businesses narrow down and analyze their data with powerful built-in tools and clear visualizations. Each platform has distinctive strengths and weaknesses that should be considered before deciding on a business intelligence software.
Retail Analytics solution based on open source including KPIs, reports, OLAP Analysis, Dashboards, Scorecards, Big Data and Machine Learning with 'predefined templates, dashboards and KPIs/ratios' and fully customizable environment
Business intelligence - benefits of using an online analytical solutionHeadChannel
Have you ever considered using business intelligence solutions in your company? You can find here several important benefits of Business Intelligence. Data analysis can be: faster, more efficient, more accurate. Reports can be: more detailed, wider ranging, more useful. Costs savings from: greater efficiency, more accurately predict future trends.
Telco and IT Analytics solution based on open source including KPIs, reports, OLAP Analysis, Dashboards, Scorecards, Big Data and Machine Learning with 'predefined templates, dashboards and KPIs/ratios' and fully customizable environment
Microsoft PowerPivot & Power View in Excel 2013Mark Ginnebaugh
PowerPivot is an add-in for Excel that empowers business users to create their own tabular data models. Power View is also available in the Excel 2013 client. It was first released as a server-based report authoring tool with SQL Server 2012 and is available in SharePoint Server 2010 Enterprise.
You'll learn:
* How to work with the add-in in the Excel 2013 client
* How compelling interactive reports can be created quickly and easily
* The new PowerPivot features - including pie charts, maps, KPIs, hierarchies, drill down/drill up, and report styles
Peter Myers specializes in Microsoft Business Intelligence, and provides mentoring, technical training and course content authoring for SQL Server and Office. Peter has current SQL Server and MCT certifications, and has been a Microsoft MVP (Most Valued Professional) since 2007.
Human Resources Analytics solution based on open source including KPIs, reports, OLAP Analysis, Dashboards, Scorecards, Big Data and Machine Learning with 'predefined templates, dashboards and KPIs/ratios' and fully customizable environment
Public Administration Analytics solution based on open source including KPIs, reports, OLAP Analysis, Dashboards, Scorecards, Big Data and Machine Learning with 'predefined templates, dashboards and KPIs/ratios' and fully customizable environment
Education Analytics solution based on open source including KPIs, reports, OLAP Analysis, Dashboards, Scorecards, Big Data and Machine Learning with 'predefined templates, dashboards and KPIs/ratios' and fully customizable environment
Business Intelligence Software from PT Maestro Global Informatika. FREE Subscription Available. Contact us at info@maestroglobal.co.id to find out more details.
Pharma Analytics solution based on open source including KPIs, reports, OLAP Analysis, Dashboards, Scorecards, Big Data and Machine Learning with 'predefined templates, dashboards and KPIs/ratios' and fully customizable environment
ReportPlus: Create Dashboards with your iPadSouthLabs
ReportPlus is an application for the iPad that allows you to create business intelligence dashboards connecting directly to enterprise data sources such as: SharePoint, SQL Server, Reporting Services, Analysis Services, Excel & OData.
Great introduction to Microsoft Power BI- using data for Insights and decision making. Easy, no code solution for business stakeholders to own their reports and dashboards. As long as you have access to your data, you can do anything! Contact us for more info: info@marque360.com
Leveraging Microsoft BI Toolset to Monitor PerformanceDan English
There are many different pieces in the Microsoft BI toolset. In this session, we will take a look at all of the different pieces and utilize each of them to create a unified dashboard, where each component is being leveraged. The tools that will be utilized during this session will include SQL Server 2008, SSRS 2008, SSAS 2008, Excel 2007, Excel Services, PPS 2007, Dashboard Designer, SharePoint Server 2007 and possibly more. Goals - (1) Understanding all of the Microsoft BI components (2) Learn how all of the Microsoft components can work together (3) Provide insight and tips/tricks on leveraging the Microsoft tools
Utilities Analytics solution based on open source including KPIs, reports, OLAP Analysis, Dashboards, Scorecards, Big Data and Machine Learning with 'predefined templates, dashboards and KPIs/ratios' and fully customizable environment
COMPANY PROFILE PT KOTA CERDAS INDONESIA, PERUSAHAAN FOKUS KE SMART CITY, INTERNET OF THINGS, ROBOTICS. MENGELOLA MAJALAH ONLINE DAN CETAK BISKOM.WEB.ID. MENGELOLA SMARTCITY PORTAL SMARTCITYINDO.COM. MENGELOLA SEMINAR DAN WORKSHOP. MENGELOLA ROBOT SERVICE DAN ROBOT INDUSTRI
Securing your Kubernetes cluster_ a step-by-step guide to success !KatiaHIMEUR1
Today, after several years of existence, an extremely active community and an ultra-dynamic ecosystem, Kubernetes has established itself as the de facto standard in container orchestration. Thanks to a wide range of managed services, it has never been so easy to set up a ready-to-use Kubernetes cluster.
However, this ease of use means that the subject of security in Kubernetes is often left for later, or even neglected. This exposes companies to significant risks.
In this talk, I'll show you step-by-step how to secure your Kubernetes cluster for greater peace of mind and reliability.
The Art of the Pitch: WordPress Relationships and SalesLaura Byrne
Clients don’t know what they don’t know. What web solutions are right for them? How does WordPress come into the picture? How do you make sure you understand scope and timeline? What do you do if sometime changes?
All these questions and more will be explored as we talk about matching clients’ needs with what your agency offers without pulling teeth or pulling your hair out. Practical tips, and strategies for successful relationship building that leads to closing the deal.
Elevating Tactical DDD Patterns Through Object CalisthenicsDorra BARTAGUIZ
After immersing yourself in the blue book and its red counterpart, attending DDD-focused conferences, and applying tactical patterns, you're left with a crucial question: How do I ensure my design is effective? Tactical patterns within Domain-Driven Design (DDD) serve as guiding principles for creating clear and manageable domain models. However, achieving success with these patterns requires additional guidance. Interestingly, we've observed that a set of constraints initially designed for training purposes remarkably aligns with effective pattern implementation, offering a more ‘mechanical’ approach. Let's explore together how Object Calisthenics can elevate the design of your tactical DDD patterns, offering concrete help for those venturing into DDD for the first time!
JMeter webinar - integration with InfluxDB and GrafanaRTTS
Watch this recorded webinar about real-time monitoring of application performance. See how to integrate Apache JMeter, the open-source leader in performance testing, with InfluxDB, the open-source time-series database, and Grafana, the open-source analytics and visualization application.
In this webinar, we will review the benefits of leveraging InfluxDB and Grafana when executing load tests and demonstrate how these tools are used to visualize performance metrics.
Length: 30 minutes
Session Overview
-------------------------------------------
During this webinar, we will cover the following topics while demonstrating the integrations of JMeter, InfluxDB and Grafana:
- What out-of-the-box solutions are available for real-time monitoring JMeter tests?
- What are the benefits of integrating InfluxDB and Grafana into the load testing stack?
- Which features are provided by Grafana?
- Demonstration of InfluxDB and Grafana using a practice web application
To view the webinar recording, go to:
https://www.rttsweb.com/jmeter-integration-webinar
Generating a custom Ruby SDK for your web service or Rails API using Smithyg2nightmarescribd
Have you ever wanted a Ruby client API to communicate with your web service? Smithy is a protocol-agnostic language for defining services and SDKs. Smithy Ruby is an implementation of Smithy that generates a Ruby SDK using a Smithy model. In this talk, we will explore Smithy and Smithy Ruby to learn how to generate custom feature-rich SDKs that can communicate with any web service, such as a Rails JSON API.
Accelerate your Kubernetes clusters with Varnish CachingThijs Feryn
A presentation about the usage and availability of Varnish on Kubernetes. This talk explores the capabilities of Varnish caching and shows how to use the Varnish Helm chart to deploy it to Kubernetes.
This presentation was delivered at K8SUG Singapore. See https://feryn.eu/presentations/accelerate-your-kubernetes-clusters-with-varnish-caching-k8sug-singapore-28-2024 for more details.
Essentials of Automations: Optimizing FME Workflows with ParametersSafe Software
Are you looking to streamline your workflows and boost your projects’ efficiency? Do you find yourself searching for ways to add flexibility and control over your FME workflows? If so, you’re in the right place.
Join us for an insightful dive into the world of FME parameters, a critical element in optimizing workflow efficiency. This webinar marks the beginning of our three-part “Essentials of Automation” series. This first webinar is designed to equip you with the knowledge and skills to utilize parameters effectively: enhancing the flexibility, maintainability, and user control of your FME projects.
Here’s what you’ll gain:
- Essentials of FME Parameters: Understand the pivotal role of parameters, including Reader/Writer, Transformer, User, and FME Flow categories. Discover how they are the key to unlocking automation and optimization within your workflows.
- Practical Applications in FME Form: Delve into key user parameter types including choice, connections, and file URLs. Allow users to control how a workflow runs, making your workflows more reusable. Learn to import values and deliver the best user experience for your workflows while enhancing accuracy.
- Optimization Strategies in FME Flow: Explore the creation and strategic deployment of parameters in FME Flow, including the use of deployment and geometry parameters, to maximize workflow efficiency.
- Pro Tips for Success: Gain insights on parameterizing connections and leveraging new features like Conditional Visibility for clarity and simplicity.
We’ll wrap up with a glimpse into future webinars, followed by a Q&A session to address your specific questions surrounding this topic.
Don’t miss this opportunity to elevate your FME expertise and drive your projects to new heights of efficiency.
Software Delivery At the Speed of AI: Inflectra Invests In AI-Powered QualityInflectra
In this insightful webinar, Inflectra explores how artificial intelligence (AI) is transforming software development and testing. Discover how AI-powered tools are revolutionizing every stage of the software development lifecycle (SDLC), from design and prototyping to testing, deployment, and monitoring.
Learn about:
• The Future of Testing: How AI is shifting testing towards verification, analysis, and higher-level skills, while reducing repetitive tasks.
• Test Automation: How AI-powered test case generation, optimization, and self-healing tests are making testing more efficient and effective.
• Visual Testing: Explore the emerging capabilities of AI in visual testing and how it's set to revolutionize UI verification.
• Inflectra's AI Solutions: See demonstrations of Inflectra's cutting-edge AI tools like the ChatGPT plugin and Azure Open AI platform, designed to streamline your testing process.
Whether you're a developer, tester, or QA professional, this webinar will give you valuable insights into how AI is shaping the future of software delivery.
GraphRAG is All You need? LLM & Knowledge GraphGuy Korland
Guy Korland, CEO and Co-founder of FalkorDB, will review two articles on the integration of language models with knowledge graphs.
1. Unifying Large Language Models and Knowledge Graphs: A Roadmap.
https://arxiv.org/abs/2306.08302
2. Microsoft Research's GraphRAG paper and a review paper on various uses of knowledge graphs:
https://www.microsoft.com/en-us/research/blog/graphrag-unlocking-llm-discovery-on-narrative-private-data/
3. Introduction
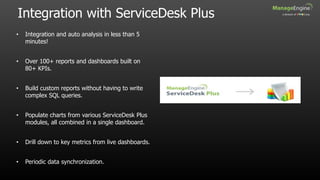
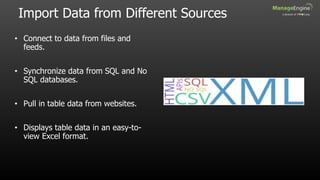
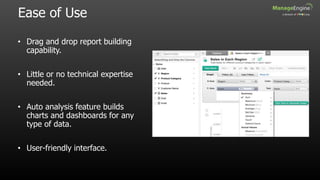
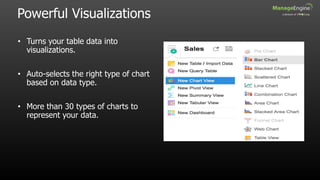
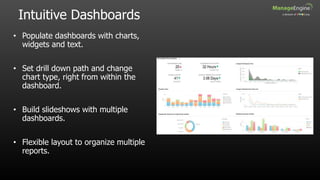
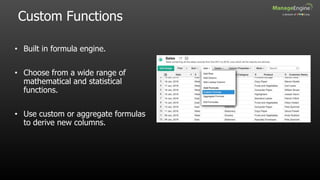
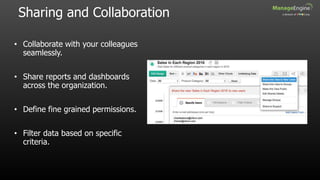
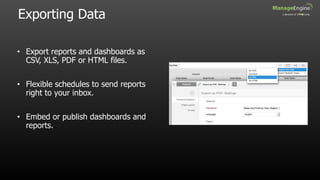
• ManageEngine Analytics Plus is a self-service business intelligence and advanced
analytics software.
• On-premise reporting solution from ManageEngine.
• Helps you analyze large volumes of data with powerful visualizations.
• Offers key insights to help make business-critical decisions.
4. Integration with ServiceDesk Plus
• Integration and auto analysis in less than 5
minutes!
• Over 100+ reports and dashboards built on
80+ KPIs.
• Build custom reports without having to write
complex SQL queries.
• Populate charts from various ServiceDesk Plus
modules, all combined in a single dashboard.
• Drill down to key metrics from live dashboards.
• Periodic data synchronization.
5. Import Data from Different Sources
• Connect to data from files and
feeds.
• Synchronize data from SQL and No
SQL databases.
• Pull in table data from websites.
• Displays table data in an easy-to-
view Excel format.
6. Ease of Use
• Drag and drop report building
capability.
• Little or no technical expertise
needed.
• Auto analysis feature builds
charts and dashboards for any
type of data.
• User-friendly interface.
7. Powerful Visualizations
• Turns your table data into
visualizations.
• Auto-selects the right type of chart
based on data type.
• More than 30 types of charts to
represent your data.
8. Intuitive Dashboards
• Populate dashboards with charts,
widgets and text.
• Set drill down path and change
chart type, right from within the
dashboard.
• Build slideshows with multiple
dashboards.
• Flexible layout to organize multiple
reports.
9. Custom Functions
• Built in formula engine.
• Choose from a wide range of
mathematical and statistical
functions.
• Use custom or aggregate formulas
to derive new columns.
10. Sharing and Collaboration
• Collaborate with your colleagues
seamlessly.
• Share reports and dashboards
across the organization.
• Define fine grained permissions.
• Filter data based on specific
criteria.
11. Exporting Data
• Export reports and dashboards as
CSV, XLS, PDF or HTML files.
• Flexible schedules to send reports
right to your inbox.
• Embed or publish dashboards and
reports.