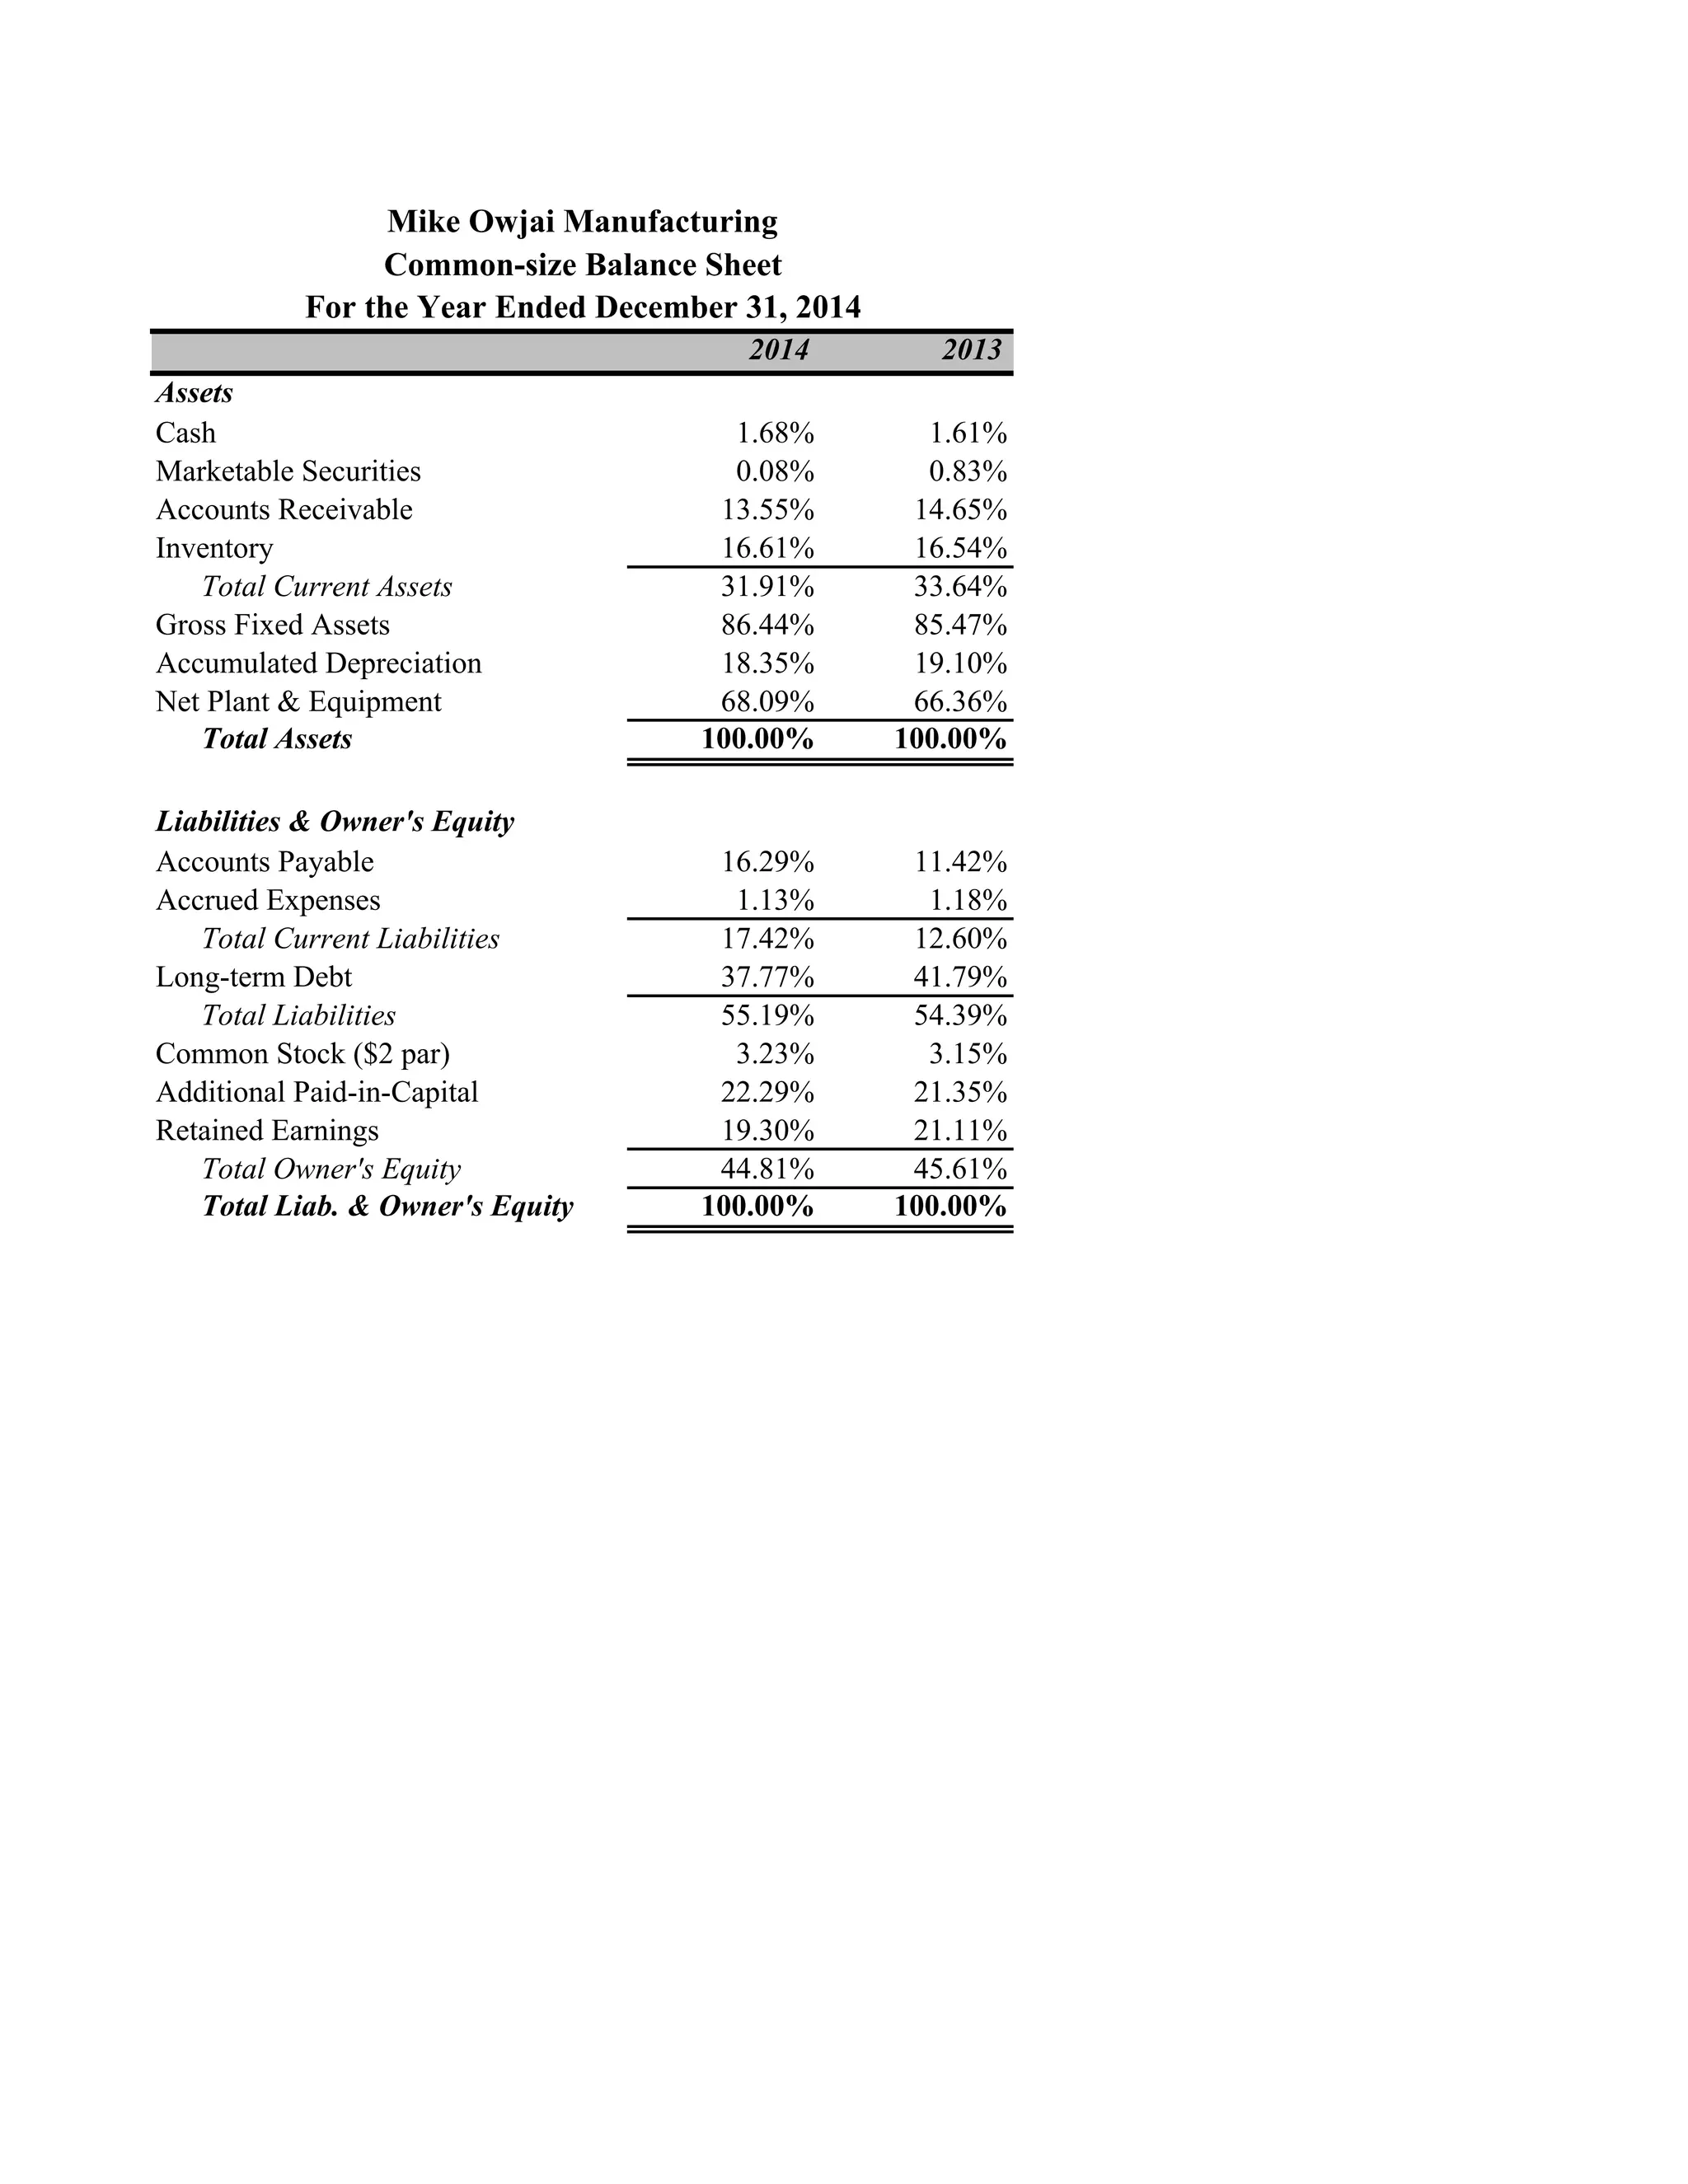
Materi kuliah penantar akuntansi 2 mengenai bonds payable atau hutang obligasi . Membahas mengenai karakteristik dan contoh perhitungan apabila di jual pada nilai par, diskon atau premium.
presentasi nya ada slide tumpuk, jadi sebaiknya di download supaya bisa di slide show untuk mudah dimengerti.
semoga bermanfaat
semoga bermanfaat
Need to present financial status of your organization then our financial analysis module PowerPoint Presentation is ideal for you. The income statement PPT slides having multiple slides such as P & L KPIs, balance sheet KPIs, financial projections, key financial ratios, liquidity ratios, cash flow statement KPIs, profitability ratios, activity ratios, solvency ratios, income statement overview and funding updates etc. Our monetary statement PPT presentation goes well with topics like profitability analysis, business impact analysis, financial health, and income statement, balance sheet, statement of cash flow, and financial heath, and financial ratio analysis. You can download this cash flow statement PowerPoint slides to perform some quick profitability analysis. Ratios provided in this presentations can demonstrate how long a company to pay off its account payable. This financial analysis module PowerPoint template is also helpful to showcase how well management is managing its company resources. Our Financial Analysis Module PowerPoint Presentation Slides are exclusively crafted. They can be alluringly awesome.
Akuntansi Manajemen Edisi 8 oleh Hansen & Mowen Bab 1Dwi Wahyu
Materi Bab 1 Introduction: The Role, History, And
Direction Of Management Accounting, Akuntansi Manajemen buku Hansen & Mowen Edisi 8. Presentasi powerpoint oleh Gail B. Wright, Professor Emeritus of Accounting, Bryant University
TechStars presentation - Financial presentations for investorsDavid Fogel
Presentation on August 7 2015 at TechStars Boston - Topic: Financial presentations to investors. Presented by David Fogel, Member of TiE Angels, Mass Medical Angels. Instructor at WPI.
Estimate future financial outcomes of your company with the help of this content ready Revenue Forecasting Powerpoint Presentation Slides. The income forecast Power complete deck contains professional looking PPT slides such as retail store revenue projections, revenue forecast model, monthly revenue projection, income statement projection, revenue projection per share, earning sales forecast product-wise, revenue projections by active users, etc. The income forecast presentation deck also includes charts and graphs. You can use these charts & graphs to present your financial data in an organized way. All templates are fully editable, you can add or change the text if you wish to. Furthermore, the annual budgeting process and planning cycles can also be shown with the help of visually appealing earning projection PPT visuals. Not just this monetary forecast PPT slideshow also goes well with topics like financial projection, income forecast, earning projection, revenue management and so on. Download yield management PowerPoint template to showcase financial reports in a visual manner. Discuss the impasse with our Revenue Forecasting Powerpoint Presentation Slides. Figure out how to get around it.
1.
Prepare and analize the common statement for Anandam Manufacturing Company. Show all
calculations.
2.
Prepare and analize the cash flow statement for Anandam Manufacturing Company. Show all
calculations.
3.
Calculate the ratios based on case Exhibit 3. Show all calculations. Based on financial analysis
of financial statements, would a loan officer grant a loan to Anandam financial company?
EXHIBIT 3: INDUSTRY AVERAGE OF KEY RATIos Sector Average Ratio 2:301 Current
ratio Acid test ratio (quick ratio) 120 Receivable tunover ratioimes turnover 52 days Receivable
days Inventory turmover ratio Inventory days Long-term detttototal debt Debt-to-equity ratio
Gross profit rato Net profit ratio Retun on equity Retum on total assets 4.85 times 75 days 24%
35% 40% 18% 22% 10% Total asset turnover ratio Ti Fixed asset turnover ratio Current asset
tunover ratio3 interest coverage ratio (tmes 10 nterest earned Warking captal smover ratio Retu
on ed sset
Solution
1….Common -size Income statement 2012-13 % to Total sales 2013-14 % to Total sales
2014-15 % to Total sales Analysis of % to Total sales proportion Sales Cash 200 10.00%
480 10.00% 800 10.00% Credit 1800 90.00% 4320 90.00% 7200 90.00% Total Sales 2000
100.00% 4800 100.00% 8000 100.00% COGS 1240 62.00% 2832 59.00% 4800 60.00%
COGS has reduced in the last 2 yrs. Gross profit 760 38.00% 1968 41.00% 3200 40.00% so,
G/P has increased Operating Expenses: Gen.adm.& sell.exp. 80 4.00% 450 9.38% 1000
12.50% % to sales has doubled in 2013-14 & increased by more than 25% in 2014-15
Depreciation 100 5.00% 400 8.33% 660 8.25% Has increased by 3% in the last 2 yrs.
Int.exp.(on borrowings) 60 3.00% 158 3.29% 340 4.25% Has slightly increased in 2014-15
Profit before tax(PBT) 520 26.00% 960 20.00% 1200 15.00% PBT% has reduced gradually in
both the yrs.due to increase in all operating expenses esp.gen admn.& sell exp. Tax at 30% 156
7.80% 288 6.00% 360 4.50% Decrease % due to decrease in profit % Profit after tax(PAT) 364
18.20% 672 14.00% 840 10.50% PAT% has reduced gradually in both the yrs.due to increase in
all operating expenses esp.gen admn.& sell exp. Common-size Balance
Sheet Assets % to Total % to Total % to Total Fixed assets(net of dep) 1900 74.22%
2500 44.64% 4700 51.33% Assets have decreased to the total Current assets Cash & Cash
equivalents 40 1.56% 100 1.79% 106 1.16% Slight variation in ratio to total Accounts
Receivables 300 11.72% 1500 26.79% 2100 22.94% Has increased in 2013-14 & again
decreased in 2014-15 Inventories 320 12.50% 1500 26.79% 2250 24.57% Has increased in
2013-14 & again decreased in 2014-15 Total 2560 100.00% 5600 100.00% 9156 100.00%
Equity & Liabilities Equity share capital($ 10) 1200 46.88% 1600 28.57% 2000 21.84%
Decreased steadily in all the 2 yrs. Reserves & surplus 364 14.22% 1036 18.50% 1876 20.49%
Increased steadily in both 2 yrs.due to increase in $ net income in those yrs. Long-term
borrowings 736 28.75% 1236 22.07% 2500 27.30% Decreased in 2013-14 & again increased i.
Have enough data to project revenue for future? Incorporate professionally designed content-ready Pay Forecast PowerPoint Presentation Slides to estimate how much a company will generate in a given specific period. With our pay forecast PowerPoint presentation templates to preview sales for the same period and get in touch with customers to ask them about their future purchasing plans. This ready-to-use pay forecast PowerPoint presentation slideshow comprises of templates such as retail store revenue projection, revenue forecast model, three-year revenue projection, monthly revenue projection, income statement projection, revenue projection per store, emerging sales forecast, revenue projection by active users, etc. Use historical data to estimate revenue for future time period. Incorporate revenue projection PowerPoint templates to keep your sales manager, marketing manager, team lead and boss on the same page to avoid any costly potential risk. These templates are completely customizable. You can change the color, text, icon and font size as per your need. Add or remove the content, if needed. Grab this ready-made pay forecast PowerPoint templates to predict company’s future growth. Your appeal is bound to generate desired funds due to our Pay Forecast Powerpoint Presentation Slides. It will fill empty coffers.
Did you know that AD can support dynamic linking of Excel tables between projects and Board Reports? If you have clients interested in this functionality, ActiveDisclosure's Document Solutions is available to demonstrate and assist.
The Roman Empire A Historical Colossus.pdfkaushalkr1407
The Roman Empire, a vast and enduring power, stands as one of history's most remarkable civilizations, leaving an indelible imprint on the world. It emerged from the Roman Republic, transitioning into an imperial powerhouse under the leadership of Augustus Caesar in 27 BCE. This transformation marked the beginning of an era defined by unprecedented territorial expansion, architectural marvels, and profound cultural influence.
The empire's roots lie in the city of Rome, founded, according to legend, by Romulus in 753 BCE. Over centuries, Rome evolved from a small settlement to a formidable republic, characterized by a complex political system with elected officials and checks on power. However, internal strife, class conflicts, and military ambitions paved the way for the end of the Republic. Julius Caesar’s dictatorship and subsequent assassination in 44 BCE created a power vacuum, leading to a civil war. Octavian, later Augustus, emerged victorious, heralding the Roman Empire’s birth.
Under Augustus, the empire experienced the Pax Romana, a 200-year period of relative peace and stability. Augustus reformed the military, established efficient administrative systems, and initiated grand construction projects. The empire's borders expanded, encompassing territories from Britain to Egypt and from Spain to the Euphrates. Roman legions, renowned for their discipline and engineering prowess, secured and maintained these vast territories, building roads, fortifications, and cities that facilitated control and integration.
The Roman Empire’s society was hierarchical, with a rigid class system. At the top were the patricians, wealthy elites who held significant political power. Below them were the plebeians, free citizens with limited political influence, and the vast numbers of slaves who formed the backbone of the economy. The family unit was central, governed by the paterfamilias, the male head who held absolute authority.
Culturally, the Romans were eclectic, absorbing and adapting elements from the civilizations they encountered, particularly the Greeks. Roman art, literature, and philosophy reflected this synthesis, creating a rich cultural tapestry. Latin, the Roman language, became the lingua franca of the Western world, influencing numerous modern languages.
Roman architecture and engineering achievements were monumental. They perfected the arch, vault, and dome, constructing enduring structures like the Colosseum, Pantheon, and aqueducts. These engineering marvels not only showcased Roman ingenuity but also served practical purposes, from public entertainment to water supply.
The Art Pastor's Guide to Sabbath | Steve ThomasonSteve Thomason
What is the purpose of the Sabbath Law in the Torah. It is interesting to compare how the context of the law shifts from Exodus to Deuteronomy. Who gets to rest, and why?
Unit 8 - Information and Communication Technology (Paper I).pdfThiyagu K
This slides describes the basic concepts of ICT, basics of Email, Emerging Technology and Digital Initiatives in Education. This presentations aligns with the UGC Paper I syllabus.
Ethnobotany and Ethnopharmacology:
Ethnobotany in herbal drug evaluation,
Impact of Ethnobotany in traditional medicine,
New development in herbals,
Bio-prospecting tools for drug discovery,
Role of Ethnopharmacology in drug evaluation,
Reverse Pharmacology.
How to Make a Field invisible in Odoo 17Celine George
It is possible to hide or invisible some fields in odoo. Commonly using “invisible” attribute in the field definition to invisible the fields. This slide will show how to make a field invisible in odoo 17.
How to Create Map Views in the Odoo 17 ERPCeline George
The map views are useful for providing a geographical representation of data. They allow users to visualize and analyze the data in a more intuitive manner.
Operation “Blue Star” is the only event in the history of Independent India where the state went into war with its own people. Even after about 40 years it is not clear if it was culmination of states anger over people of the region, a political game of power or start of dictatorial chapter in the democratic setup.
The people of Punjab felt alienated from main stream due to denial of their just demands during a long democratic struggle since independence. As it happen all over the word, it led to militant struggle with great loss of lives of military, police and civilian personnel. Killing of Indira Gandhi and massacre of innocent Sikhs in Delhi and other India cities was also associated with this movement.
Financial Analysis with Microsoft Excel 7th Edition Mayes Solutions Manual
1. Mike Owjai Manufacturing
Income Statements
For the Years 2013 and 2014 Alternative Solutions:
2014 2013
Sales $2,625,000 $2,422,500 Sales
Cost of Goods 1,704,975 1,621,875 Retained Earnings
Gross Profit 920,025 800,625
Depreciation 63,000 53,250
Selling & Admin. Expense 652,350 626,250
Lease Expense 48,750 48,750
Net Operating Income 155,925 72,375
Interest Expense 84,000 51,000
Earnings Before Taxes 71,925 21,375
Taxes 25,174 7,481
Net Income $46,751 $13,894
Notes:
Tax Rate 35.00% 35.00%
Shares 75,000 60,000
Earnings per Share $0.62 $0.23
Note: To switch between the original so
and those for parts d and e just choose t
appropriate problem from the drop
Obviously, the changes propagate to the
worksheets as well, so you can switch to
to see how they change.
Financial Analysis with Microsoft Excel 7th Edition Mayes Solutions Manual
Full Download: http://alibabadownload.com/product/financial-analysis-with-microsoft-excel-7th-edition-mayes-solutions-manual/
This sample only, Download all chapters at: alibabadownload.com
2. 1
Revenue
Original 2,625,000
Part D 2,850,000
2,625,000$ Part E 2,625,000
448,751$
switch between the original solution
e for parts d and e just choose the
ate problem from the drop-down list.
y, the changes propagate to the other
ets as well, so you can switch to them
w they change.
4. Mike Owjai Manufacturing
Balance Sheet
For the Year Ended December 31, 2014
2014 2013
Assets
Cash $39,000 $30,750
Marketable Securities 1,826 15,750
Accounts Receivable 315,000 279,000
Inventory 386,250 315,000
Total Current Assets 742,076 640,500
Gross Fixed Assets 2,010,000 1,627,500
Accumulated Depreciation 426,750 363,750
Net Plant & Equipment 1,583,250 1,263,750
Total Assets $2,325,326 $1,904,250
Liabilities & Owner's Equity
Accounts Payable 378,750 217,500
Accrued Expenses 26,250 22,500
Total Current Liabilities 405,000 240,000
Long-term Debt 878,325 795,750
Total Liabilities 1,283,325 1,035,750
Common Stock ($1.00 par) 75,000 60,000
Additional Paid-in-Capital 518,250 406,500
Retained Earnings 448,751 402,000
Total Owner's Equity 1,042,001 868,500
Total Liab. & Owner's Equity $2,325,326 $1,904,250
5. Mike Owjai Manufacturing
Common-size Income Statements
For the Years 2013 and 2014
2014 2013
Sales 100.00% 100.00%
Cost of Goods 64.95% 66.95%
Gross Profit 35.05% 33.05%
Depreciation 2.40% 2.20%
Selling & Admin. Expense 24.85% 25.85%
Lease Expense 1.86% 2.01%
Net Operating Income 5.94% 2.99%
Interest Expense 3.20% 2.11%
Earnings Before Taxes 2.74% 0.88%
Taxes 0.96% 0.31%
Net Income 1.78% 0.57%
Notes:
Tax Rate 35.00% 35.00%
Shares 75,000 60,000
6. Mike Owjai Manufacturing
Common-size Balance Sheet
For the Year Ended December 31, 2014
2014 2013
Assets
Cash 1.68% 1.61%
Marketable Securities 0.08% 0.83%
Accounts Receivable 13.55% 14.65%
Inventory 16.61% 16.54%
Total Current Assets 31.91% 33.64%
Gross Fixed Assets 86.44% 85.47%
Accumulated Depreciation 18.35% 19.10%
Net Plant & Equipment 68.09% 66.36%
Total Assets 100.00% 100.00%
Liabilities & Owner's Equity
Accounts Payable 16.29% 11.42%
Accrued Expenses 1.13% 1.18%
Total Current Liabilities 17.42% 12.60%
Long-term Debt 37.77% 41.79%
Total Liabilities 55.19% 54.39%
Common Stock ($2 par) 3.23% 3.15%
Additional Paid-in-Capital 22.29% 21.35%
Retained Earnings 19.30% 21.11%
Total Owner's Equity 44.81% 45.61%
Total Liab. & Owner's Equity 100.00% 100.00%
7. Mike Owjai Manufacturing
Statement of Cash Flows
For the Year Ended December 31, 2014
Cash Flows from Operations
Net Income 46,751$
Depreciation Expense 63,000
Change in Marketable Securities 13,924
Change in Accounts Receivable (36,000)
Change in Inventory (71,250)
Change in Accounts Payable 161,250
Change in Accrued Expenses 3,750
Total Cash Flows from Operations 181,425
Cash Flows from Investing
Change in Gross Fixed Assets (382,500)
Total Cash Flows from Investing -382,500
Cash Flows from Financing
Change in Long-term Debt 82,575
Change in Common Stock ($2 par) 15,000
Change in Additional Paid-in-Capital 111,750
Total Cash Flows from Financing 209,325
Net Change in Cash Balance 8,250$
8. Mike Owjai Manufacturing Denominator 1
Statement of Cash Flows
For the Year Ended December 31, 2014
Cash Flows from Operations % of Sales
Net Income 1.78%
Depreciation Expense 2.40%
Change in Marketable Securities 0.53%
Change in Accounts Receivable -1.37%
Change in Inventory -2.71%
Change in Accounts Payable 6.14%
Change in Accrued Expenses 0.14%
Total Cash Flows from Operations 6.91%
Cash Flows from Investing
Change in Gross Fixed Assets -14.57%
Total Cash Flows from Investing -14.57%
Cash Flows from Financing
Change in Long-term Debt 3.15%
Change in Common Stock ($2 par) 0.57%
Change in Additional Paid-in-Capital 4.26%
Total Cash Flows from Financing 7.97%
Net Change in Cash Balance 0.31%
9. Winter Park Web Design
Income Statements
For the Years 2013 and 2014
2014 2013
Sales 280,419$ 225,000$
Cost of Goods Sold 154,229 123,750
Gross Profit 126,191 101,250
Depreciation Expense 5,295 4,646
Selling & Admin Expense 825 720
Net Operating Income 120,071 95,884
Interest Expense 1,020 810
Earnings Before Taxes 119,051 95,074
Taxes 44,049 33,276
Net Income 75,002 61,798
Notes:
Tax Rate 37.0% 35.0%
Shares Outstanding 7,500 7,500
Earnings per Share $10.00 $8.24
Dividends per Share $6.00 $5.00
Addition to RE per Share $4.00 $3.24
10. Note: Cells with a green
background are the missing cells in
the problem.
11. Winter Park Web Design
Balance Sheets
For the Years 2013 and 2014
2014 2013
Cash 15,225$ 11,250$
Accounts receivable 18,756 16,500
Inventories 12,911 11,325
Total Current Assets 46,892 39,075
Gross fixed assets 43,530 13,275
Accumulated depreciation 10,845 5,550
Net Fixed Assets 32,685 7,725
Total assets 79,577 46,800
Accounts payable 12,302$ 10,277$
Notes payable 3,000 4,500
Total Current Liabilities 15,302 14,777
Long-term debt 10,673 8,423
Total Liabilities 25,974 23,199
Common stock 7,500 7,500
Additional paid in capital 750 750
Retained earnings 45,353 15,351
Total Equity 53,603 23,601
Total Liabilities & Equity 79,577 46,800
Notes:
Shares Outstanding 7,500 7,500
12.
13. Winter Park Web Design
Statement of Cash Flows
For the Year 2014
Cash Flows from Operations
Net Income 75,002$
Depreciation Expense 5,295
Change in Accounts Receivable (2,256)
Change in Inventories (1,586)
Change in Accounts Payable 2,025
Total Cash Flows from Operations 78,480$
Cash Flows from Investing
Change in fixed assets (30,255)
Total Cash Flows from Investing (30,255)$
Cash Flows from Financing
Change in Notes Payable (1,500)
Change in Long-Term Debt 2,250
Change in Common Stock -
Change in Paid-In Capital -
Cash Dividends (45,000)
Total Cash Flows from Financing (44,250)$
Net Change in Cash Balance 3,975$
Check answer against Balance Sheet
Beginning Cash From Balance Sheet 11,250
Ending Cash From Balance Sheet 15,225
Net Change in Cash Balance 3,975$
14.
15.
16.
17. Winter Park Web Design
Income Statements
For the Years 2013 and 2014
2014 2013
Sales 100.00% 100.00%
Cost of Goods Sold 55.00% 55.00%
Gross Profit 45.00% 45.00%
Depreciation Expense 1.89% 2.07%
Selling & Admin Expense 0.29% 0.32%
Net Operating Income 42.82% 42.62%
Interest Expense 0.36% 0.36%
Earnings Before Taxes 42.45% 42.26%
Taxes 15.71% 14.79%
Net Income 26.75% 27.47%
18.
19. Winter Park Web Design
Balance Sheets
For the Years 2013 and 2014
2014 2013
Cash 19.13% 24.04%
Accounts receivable 23.57% 35.26%
Inventories 16.22% 24.20%
Total Current Assets 58.93% 83.49%
Gross fixed assets 54.70% 28.37%
Accumulated depreciation 13.63% 11.86%
Net Fixed Assets 41.07% 16.51%
Total assets 100.00% 100.00%
Accounts payable 15.46% 21.96%
Notes payable 3.77% 9.62%
Total Current Liabilities 19.23% 31.57%
Long-term debt 13.41% 18.00%
Total Liabilities 32.64% 49.57%
Common stock 9.42% 16.03%
Additional paid in capital 0.94% 1.60%
Retained earnings 56.99% 32.80%
Total Equity 67.36% 50.43%
Total Liabilities & Equity 100.00% 100.00%
Notes:
Shares Outstanding 7,500 7,500
20.
21. Automatic Data Processing, Inc.
Income Statements
For the Years 2010 to 2014
USD in Million except per share data
Jun-14 Jun-13 Jun-12 Jun-11 Jun-10
Revenue 12,206 11,310 10,665 9,880 8,928
Cost of revenue 7,221 6,650 6,240 5,732 5,030
Gross profit 4,985 4,660 4,425 4,148 3,898
Total operating expenses 2,762 2,663 2,466 2,323 2,127
Operating income 2,223 1,997 1,959 1,825 1,771
Interest Expense 6 9 8 9 9
Other income (expense) 58 96 171 117 101
Income before taxes 2,275 2,084 2,122 1,933 1,863
Provision for income taxes 772 720 734 678 656
Net income from continuing operations 1,503 1,364 1,388 1,255 1,207
Net income from discontinuing ops 13 42 4
Net income 1,516 1,406 1,388 1,255 1,211
Net income available to common shareholders 1,516 1,406 1,388 1,255 1,211
Earnings per share
Basic 3.17 2.91 2.85 2.54 2.42
Diluted 3.14 2.89 2.82 2.52 2.40
Weighted average shares outstanding
Basic 479 483 487 494 500
Diluted 483 487 492 498 504
22. Note: Both MSN and Yahoo! have recently made it
difficult to copy and paste financial statements into
Excel. Therefore, I got this data from Morningstar
Direct. There may be slight errors due to rounding.
23. Automatic Data Processing, Inc.
Income Statements
For the Years 2010 to 2014
USD in Million except per share data
Jun-14 Jun-13 Jun-12 Jun-11 Jun-10
Assets
Cash and cash equivalents 1,984 1,699 1,548 1,389 1,643
Short-term investments 2,032 28 30 36 28
Total cash 4,016 1,727 1,578 1,425 1,671
Receivables 1,716 1,519 1,323 1,288 1,037
Other current assets 20,101 22,955 22,254 25,869 19,609
Total current assets 25,833 26,201 25,155 28,582 22,317
Gross property, plant and equipment 2,126 2,043 1,957 1,952 1,829
Accumulated Depreciation (1,348) (1,314) (1,251) (1,236) (1,155)
Net property, plant and equipment 778 729 706 716 674
Equity and other investments 54 314 87 98 104
Goodwill 3,114 3,053 3,155 3,074 2,383
Intangible assets 632 643 711 716 542
Other long-term assets 1,641 1,329 1,000 1,051 842
Total non-current assets 6,219 6,068 5,659 5,655 4,545
Total assets 32,052 32,269 30,814 34,237 26,862
Liabilities and stockholders' equity
Short-term debt 2,173 - - - -
Accounts payable 170 157 168 153 150
Taxes payable 20 40 39 29 60
Accrued liabilities 2,022 1,811 1,654 1,489 1,220
Deferred revenues 333 316 334 351 322
Other current liabilities 19,190 22,409 21,045 24,765 18,301
Total current liabilities 23,908 24,733 23,240 26,787 20,053
Non-current liabilities
Long-term debt 12 15 17 34 40
Deferred taxes liabilities 289 234 391 374 306
Deferred revenues 513 493 468 477 457
Other long-term liabilities 660 603 586 556 528
Total non-current liabilities 1,474 1,345 1,462 1,441 1,331
Total liabilities 25,382 26,078 24,702 28,228 21,384
Stockholders' equity
Common stock 64 64 64 64 64
Additional paid-in capital 545 457 486 490 493
Retained earnings 13,633 13,020 12,438 11,804 11,252
Treasury stock (7,750) (7,367) (7,105) (6,714) (6,540)
Accumulated other comprehensive income 178 15 230 367 210
Total stockholders' equity 6,670 6,189 6,113 6,011 5,479
Total liabilities and stockholders' equity 32,052 32,267 30,815 34,239 26,863
24. Automatic Data Processing, Inc.
Income Statements
For the Years 2010 to 2014
USD in Million except per share data
Jun-14 Jun-13 Jun-12 Jun-11 Jun-10
Revenue 100.00% 100.00% 100.00% 100.00% 100.00%
Cost of revenue 59.16% 58.80% 58.51% 58.02% 56.34%
Gross profit 40.84% 41.20% 41.49% 41.98% 43.66%
Total operating expenses 22.63% 23.55% 23.12% 23.51% 23.82%
Operating income 18.21% 17.66% 18.37% 18.47% 19.84%
Interest Expense 0.05% 0.08% 0.08% 0.09% 0.10%
Other income (expense) 0.48% 0.85% 1.60% 1.18% 1.13%
Income before taxes 18.64% 18.43% 19.90% 19.56% 20.87%
Provision for income taxes 6.32% 6.37% 6.88% 6.86% 7.35%
Net income from continuing operations 12.31% 12.06% 13.01% 12.70% 13.52%
Net income from discontinuing ops 0.11% 0.37% 0.00% 0.00% 0.04%
Net income 12.42% 12.43% 13.01% 12.70% 13.56%
Net income available to common shareholders 12.42% 12.43% 13.01% 12.70% 13.56%
Earnings per share
Basic 3.17 2.91 2.85 2.54 2.42
Diluted 3.14 2.89 2.82 2.52 2.40
Weighted average shares outstanding
Basic 479 483 487 494 500
Diluted 483 487 492 498 504
25. Note: Both MSN and Yahoo! have recently made it
difficult to copy and paste financial statements into
Excel. Therefore, I got this data from Morningstar
Direct. There may be slight errors due to rounding.
26. Automatic Data Processing, Inc.
Income Statements
For the Years 2010 to 2014
USD in Million except per share data
Jun-14 Jun-13 Jun-12 Jun-11 Jun-10
Assets
Cash and cash equivalents 6.19% 5.27% 5.02% 4.06% 6.12%
Short-term investments 6.34% 0.09% 0.10% 0.11% 0.10%
Total cash 12.53% 5.35% 5.12% 4.16% 6.22%
Receivables 5.35% 4.71% 4.29% 3.76% 3.86%
Other current assets 62.71% 71.14% 72.22% 75.56% 73.00%
Total current assets 80.60% 81.20% 81.63% 83.48% 83.08%
Gross property, plant and equipment 6.63% 6.33% 6.35% 5.70% 6.81%
Accumulated Depreciation -4.21% -4.07% -4.06% -3.61% -4.30%
Net property, plant and equipment 2.43% 2.26% 2.29% 2.09% 2.51%
Equity and other investments 0.17% 0.97% 0.28% 0.29% 0.39%
Goodwill 9.72% 9.46% 10.24% 8.98% 8.87%
Intangible assets 1.97% 1.99% 2.31% 2.09% 2.02%
Other long-term assets 5.12% 4.12% 3.25% 3.07% 3.13%
Total non-current assets 19.40% 18.80% 18.37% 16.52% 16.92%
Total assets 100.00% 100.00% 100.00% 100.00% 100.00%
Liabilities and stockholders' equity
Short-term debt 6.78% 0.00% 0.00% 0.00% 0.00%
Accounts payable 0.53% 0.49% 0.55% 0.45% 0.56%
Taxes payable 0.06% 0.12% 0.13% 0.08% 0.22%
Accrued liabilities 6.31% 5.61% 5.37% 4.35% 4.54%
Deferred revenues 1.04% 0.98% 1.08% 1.03% 1.20%
Other current liabilities 59.87% 69.44% 68.30% 72.33% 68.13%
Total current liabilities 74.59% 76.65% 75.42% 78.24% 74.65%
Non-current liabilities
Long-term debt 0.04% 0.05% 0.06% 0.10% 0.15%
Deferred taxes liabilities 0.90% 0.73% 1.27% 1.09% 1.14%
Deferred revenues 1.60% 1.53% 1.52% 1.39% 1.70%
Other long-term liabilities 2.06% 1.87% 1.90% 1.62% 1.97%
Total non-current liabilities 4.60% 4.17% 4.74% 4.21% 4.95%
Total liabilities 79.19% 80.81% 80.16% 82.45% 79.61%
Stockholders' equity
Common stock 0.20% 0.20% 0.21% 0.19% 0.24%
Additional paid-in capital 1.70% 1.42% 1.58% 1.43% 1.84%
Retained earnings 42.53% 40.35% 40.36% 34.48% 41.89%
Treasury stock -24.18% -22.83% -23.06% -19.61% -24.35%
Accumulated other comprehensive income 0.56% 0.05% 0.75% 1.07% 0.78%
Total stockholders' equity 20.81% 19.18% 19.84% 17.56% 20.40%
Total liabilities and stockholders' equity 100.00% 99.99% 100.00% 100.01% 100.00%
27. Elvis Products International
Income Statement
For the Year Ended Dec. 31, 2014
2014 2013
Sales 3,850,000 3,432,000
Cost of Goods Sold 3,250,000 2,864,000
Gross Profit 600,000 568,000
Selling and G&A Expenses 330,300 240,000
Fixed Expenses 100,000 100,000
Depreciation Expense 20,000 18,900
EBIT 149,700 209,100
Interest Expense 76,000 62,500
Earnings Before Taxes 73,700 146,600
Taxes 29,480 58,640
Net Income 44,220 87,960
Notes:
Tax Rate 40%
Note: The year in cell B4 is the one which
all of years in this workbook depend on.
To change all dates, change B4 to another
year. This will also be reflected in the text
in these workbooks.
28. ell B4 is the one which
orkbook depend on.
change B4 to another
be reflected in the text
29. Elvis Products International
Income Statement
For the Year Ended Dec. 31, 2014 ($ in 000's)
2014 2013
Sales 3,850.00 3,432.00
Cost of Goods Sold 3,250.00 2,864.00
Gross Profit 600.00 568.00
Selling and G&A Expenses 330.30 240.00
Fixed Expenses 100.00 100.00
Depreciation Expense 20.00 18.90
EBIT 149.70 209.10
Interest Expense 76.00 62.50
Earnings Before Taxes 73.70 146.60
Taxes 29.48 58.64
Net Income 44.22 87.96
Notes:
Tax Rate 40%
Note: All of the values on this sheet
reference the original values from the
Income Statement. The only purpose of this
sheet is to show the effect of the custom
number format.
30. l of the values on this sheet
e the original values from the
Statement. The only purpose of this
o show the effect of the custom
31. Elvis Products International
Common-size Income Statement
For the Year Ended Dec. 31, 2014
2014 2013 Contribution
Sales 100.00% 100.00%
Cost of Goods Sold 84.42% 83.45% -0.97%
Gross Profit 15.58% 16.55%
Selling and G&A Expenses 8.58% 6.99% -1.59%
Fixed Expenses 2.60% 2.91% 0.32%
Depreciation Expense 0.52% 0.55% 0.03%
EBIT 3.89% 6.09%
Interest Expense 1.97% 1.82% -0.15%
Earnings Before Taxes 1.91% 4.27%
Taxes 0.77% 1.71% 0.94%
Net Income 1.15% 2.56% -1.41%
Notes:
Tax Rate 40%
32. Elvis Products International
Pro-forma Income Statement
For the Year Ended Dec. 31, 2014
2015* 2014 2013
Sales 4,300.00 3,850.00 3,432.00
Cost of Goods Sold 3,609.11 3,250.00 2,864.00
Gross Profit 690.89 600.00 568.00
Selling and G&A Expenses 334.80 330.30 240.00
Fixed Expenses 100.00 100.00 100.00
Depreciation Expense 25.00 20.00 18.90
EBIT 231.09 149.70 209.10
Interest Expense 76.00 76.00 62.50
Earnings Before Taxes 155.09 73.70 146.60
Taxes 62.04 29.48 58.64
Net Income 93.05 44.22 87.96
* Forecast
Notes:
Tax Rate 40% 40%
Additional Depreciation 5.00
Note that firm's capital expenditures
are expected to rise by $50,000 in the
new year. This will lead to an increase
of $5,000 in accumulated depreciation.
34. Elvis Products International
Balance Sheet
As of Dec. 31, 2014
Assets 2014 2013
Cash and Equivalents 52,000 57,600
Accounts Receivable 402,000 351,200
Inventory 836,000 715,200
Total Current Assets 1,290,000 1,124,000
Plant & Equipment 527,000 491,000
Accumulated Depreciation 166,200 146,200
Net Fixed Assets 360,800 344,800
Total Assets 1,650,800 1,468,800
Liabilities and Owner's Equity
Accounts Payable 175,200 145,600
Short-term Notes Payable 225,000 200,000
Other Current Liabilities 140,000 136,000
Total Current Liabilities 540,200 481,600
Long-term Debt 424,612 323,432
Total Liabilities 964,812 805,032
Common Stock 460,000 460,000
Retained Earnings 225,988 203,768
Total Shareholder's Equity 685,988 663,768
Total Liabilities and Owner's Equity 1,650,800 1,468,800
35. Elvis Products International
Balance Sheet
As of Dec. 31, 2014 ($ in 000's)
Assets 2014 2013
Cash and Equivalents 52.00 57.60
Accounts Receivable 402.00 351.20
Inventory 836.00 715.20
Total Current Assets 1,290.00 1,124.00
Plant & Equipment 527.00 491.00
Accumulated Depreciation 166.20 146.20
Net Fixed Assets 360.80 344.80
Total Assets 1,650.80 1,468.80
Liabilities and Owner's Equity
Accounts Payable 175.20 145.60
Short-term Notes Payable 225.00 200.00
Other Current Liabilities 140.00 136.00
Total Current Liabilities 540.20 481.60
Long-term Debt 424.61 323.43
Total Liabilities 964.81 805.03
Common Stock 460.00 460.00
Retained Earnings 225.99 203.77
Total Shareholder's Equity 685.99 663.77
Total Liabilities and Owner's Equity 1,650.80 1,468.80
Note: All of the values on this s
reference the original values fro
Balance Sheet. The only purpos
sheet is to show the effect of th
number format.
36. Note: All of the values on this sheet
reference the original values from the
Balance Sheet. The only purpose of this
sheet is to show the effect of the custom
number format.
37. Elvis Products International
Common-size Balance Sheet
As of Dec. 31, 2014
Assets 2014 2013
Cash and Equivalents 3.15% 3.92%
Accounts Receivable 24.35% 23.91%
Inventory 50.64% 48.69%
Total Current Assets 78.14% 76.53%
Plant & Equipment 31.92% 33.43%
Accumulated Depreciation 10.07% 9.95%
Net Fixed Assets 21.86% 23.47%
Total Assets 100.00% 100.00%
Liabilities and Owner's Equity
Accounts Payable 10.61% 9.91%
Short-term Notes Payable 13.63% 13.62%
Other Current Liabilities 8.48% 9.26%
Total Current Liabilities 32.72% 32.79%
Long-term Debt 25.72% 22.02%
Total Liabilities 58.45% 54.81%
Common Stock 27.87% 31.32%
Retained Earnings 13.69% 13.87%
Total Shareholder's Equity 41.55% 45.19%
Total Liabilities and Owner's Equity 100.00% 100.00%
38. Elvis Products International
Pro-forma Balance Sheet
As of Dec. 31, 2014
Assets 2015* 2014 2013
Cash and Equivalents 52.00 52.00 57.60
Accounts Receivable 444.51 402.00 351.20
Inventory 914.90 836.00 715.20
Total Current Assets 1,411.40 1,290.00 1,124.00
Plant & Equipment 577.00 527.00 491.00
Accumulated Depreciation 191.20 166.20 146.20
Net Fixed Assets 385.80 360.80 344.80
Total Assets 1,797.20 1,650.80 1,468.80
Liabilities and Owner's Equity
Accounts Payable 189.05 175.20 145.60
Short-term Notes Payable 225.00 225.00 200.00
Other Current Liabilities 163.38 140.00 136.00
Total Current Liabilities 577.43 540.20 481.60
Long-term Debt 424.61 424.61 323.43
Total Liabilities 1,002.04 964.81 805.03
Common Stock 460.00 460.00 460.00
Retained Earnings 297.04 225.99 203.77
Total Shareholder's Equity 757.04 685.99 663.77
Total Liabilities and Owner's Equity 1,759.08 1,650.80 1,468.80
*Forecast
Discretionary Financing Needed 38.12 Deficit
Notes:
Net Addition to Plant & Equipment 50.00
Life of New Equipment in Years 10
New Depreciation (Straight Line) 5.00
Note that firm's capital expenditure
are expected to rise by $50,000 in
new year. This will lead to an incre
of $5,000 in accumulated deprecia
39. Note that firm's capital expenditures
are expected to rise by $50,000 in the
new year. This will lead to an increase
of $5,000 in accumulated depreciation.
40. Elvis Products International
Statement of Cash Flows
For the Year Ended Dec. 31, 2014 ($ in 000's)
Cash Flows from Operations
Net Income 44.22
Depreciation Expense 20.00
Change in Accounts Receivable -50.80
Change in Inventories -120.80
Change in Accounts Payable 29.60
Change in Other Current Liabilities 4.00
Total Cash Flows from Operations -73.78
Cash Flows from Investing
Change in Plant & Equipment -36.00
Total Cash Flows from Investing -36.00
Cash Flows from Financing
Change in Short-term Notes Payable 25.00
Change in Long-term Debt 101.18
Change in Common Stock 0.00
Cash Dividends Paid to Shareholders -22.00
Total Cash Flows from Financing 104.18
Net Change in Cash Balance -5.60
41. Elvis Products International Denominator 1
Common-size Statement of Cash Flows
For the Year Ended Dec. 31, 2014
Cash Flows from Operations % of Sales
Net Income 1.15%
Depreciation Expense 0.52%
Change in Accounts Receivable -1.32%
Change in Inventories -3.14%
Change in Accounts Payable 0.77%
Change in Other Current Liabilities 0.10%
Total Cash Flows from Operations -1.92%
Cash Flows from Investing
Change in Plant & Equipment -0.94%
Total Cash Flows from Investing -0.94%
Cash Flows from Financing
Change in Short-term Notes Payable 0.65%
Change in Long-term Debt 2.63%
Change in Common Stock 0.00%
Cash Dividends Paid to Shareholders -0.57%
Total Cash Flows from Financing 2.71%
Net Change in Cash Balance -0.15%
42.
43. Elvis Products International
Ratio Analysis for 2013 and 2014
Ratio 2014 2013
Industry
2014 Analysis
Liquidity Ratios
Current Ratio 2.39x 2.33x 2.70x Ok
Quick Ratio 0.84x 0.85x 1.00x Bad
Efficiency Ratios
Inventory Turnover 3.89x 4.00x 7.00x Bad
A/R Turnover 9.58x 9.77x 10.70x Bad
Average Collection Period 37.59 days 36.84 days 33.64 days Bad
Fixed Asset Turnover 10.67x 9.95x 11.20x Ok
Total Asset Turnover 2.33x 2.34x 2.60x Bad
Leverage Ratios
Total Debt Ratio 58.45% 54.81% 50.00% Bad
Long-term Debt Ratio 25.72% 22.02% 20.00% Bad
LTD to Total Capitalization 38.23% 32.76% 28.57% Bad
Debt to Equity 1.41x 1.21x 1.00x Bad
LTD to Equity 61.90% 48.73% 40.00% Bad
Coverage Ratios
Times Interest Earned 1.97x 3.35x 2.50x Bad
Cash Coverage Ratio 2.23x 3.65x 2.80x Bad
Profitability Ratios
Gross Profit Margin 15.58% 16.55% 17.50% Bad
Operating Profit Margin 3.89% 6.09% 6.25% Bad
Net Profit Margin 1.15% 2.56% 3.50% Bad
Return on Total Assets 2.68% 5.99% 9.10% Bad
Return on Equity 6.45% 13.25% 18.20% Bad
Return on Common Equity 6.45% 13.25% 18.20% Bad
DuPont ROE 6.45% 13.25% 18.20%
Market Value of Equity 884,400 1,759,200
Z-Score - Publicly Traded 3.92 4.84
Z-Score - Privately Held 3.35 3.55
Stock Valuation Notes:
Number of Shares 100,000 100,000
Assumed P/E Ratio 20 20
Stock Price $8.84 $17.59
44. Elvis Products International
Economic Profit Calculations
2014 2013
Tax Rate 40% 40%
NOPAT 89,820 125,460
Total Operating Capital 1,335,600 1,187,200
After-tax Cost of Capital 13% 13%
Dollar Cost of Capital 173,628 154,336
Economic Profit (83,808) (28,876)
45. Year Sales
2010 1,890,532
2011 2,098,490
2012 2,350,308
2013 3,432,000
2014 3,850,000
0
1,000,000
2,000,000
3,000,000
4,000,000
5,000,000
2009 2010 2011 2012 2013 2014 2015Sales
Year
EPI Sales for 2010 to 2014
47. Year Sales
2010 1,890,532
2011 2,098,490
2012 2,350,308
2013 3,432,000
2014 3,850,000
2015 4,300,000
2016 4,825,244
2017 5,350,489
Actual Equation Using LinEst
Slope Intercept
525,244.60 ############## This is an example using LinEst as an array-entered function.
525,244.60 ############## This is an example of pulling out just the specific parameter that you wa
Year Sales
2015 4,300,000 These are forecasts using the LinEst() and Index() functions.
2016 4,825,244
2017 5,350,489
y = 525,244.60x - 1,054,067,869.20
0
1,000,000
2,000,000
3,000,000
4,000,000
5,000,000
6,000,000
2008 2010 2012 2014 2016 2018
Sales
Year
EPI Sales for 2010 to 2014 with Trend
48. Chart Title EPI Sales for 2010 to 2014 with Trend
as an array-entered function.
just the specific parameter that you want using the Index() function.
Est() and Index() functions.
52. SUMMARY OUTPUT
Regression Statistics
Multiple R 99.91%
R Square 99.83%
Adjusted R Square 99.77%
Standard Error 35523.08
Observations 5
ANOVA
df SS MS F Significance F
Regression 1 2,205,960,110,240 2,205,960,110,240 1,748 0.0000
Residual 3 3,785,666,909 1,261,888,970
Total 4 2,209,745,777,149
Coefficients Standard Error t Stat P-value Lower 95% Upper 95%
Intercept (63,680.8247) 58,134.6760 (1.0954) 0.3534 (248,691.3095) 121,329.6601
Sales 0.8583 0.0205 41.8108 0.0000 0.7929 0.9236
53. Year Sales Cost of Goods Chart Title Cost of Goods vs Sales
2010 1,890,532 1,570,200
2011 2,098,490 1,695,694
2012 2,350,308 1,992,400
2013 3,432,000 2,864,000
2014 3,850,000 3,250,000
2015* 4,300,000 3,626,855
*Forecast
y = 0.8583x - 63681
R² = 0.9983
1,000,000
2,000,000
3,000,000
4,000,000
1,000,000 2,000,000 3,000,000 4,000,000
CostofGoods
Sales
Cost of Goods vs Sales
2010 to 2014
54. Winter Park Web Design
Income Statements
For the Years 2013 and 2014
2014 2013
Sales 280,419$ 225,000$
Cost of Goods Sold 154,229 123,750
Gross Profit
Depreciation Expense 4,646
Selling & Admin Expense 825 720
Net Operating Income
Interest Expense 1,020 810
Earnings Before Taxes
Taxes
Net Income
Notes:
Tax Rate 37.0% 35.0%
Shares Outstanding
Earnings per Share
Dividends per Share $6.00 $5.00
Addition to RE per Share
55. Note: Cells with a green
background are the missing cells in
the problem.
56. Winter Park Web Design
Balance Sheets
For the Years 2013 and 2014
2014 2013
Cash 15,225$ 11,250$
Accounts receivable 18,756
Inventories 11,325
Total Current Assets
Gross fixed assets 43,530
Accumulated depreciation 10,845
Net Fixed Assets 32,685 -
Total assets 32,685 -
Accounts payable 12,302$
Notes payable 4,500
Total Current Liabilities 4,500
Long-term debt 10,673
Total Liabilities 10,673 4,500
Common stock 7,500
Additional paid in capital 750
Retained earnings 15,351
Total Equity
Total Liabilities & Equity
Notes:
Shares Outstanding 7,500
57.
58. Winter Park Web Design
Statement of Cash Flows
For the Year 2014
Cash Flows from Operations
Net Income
Depreciation Expense 5,295
Change in Accounts Receivable (2,256)
Change in Inventories (1,586)
Change in Accounts Payable 2,025
Total Cash Flows from Operations
Cash Flows from Investing
Change in fixed assets (30,255)
Total Cash Flows from Investing (30,255)$
Cash Flows from Financing
Change in Notes Payable (1,500)
Change in Long-Term Debt 2,250
Change in Common Stock -
Change in Paid-In Capital -
Cash Dividends
Total Cash Flows from Financing
Net Change in Cash Balance
Check answer against Balance Sheet
Beginning Cash From Balance Sheet
Ending Cash From Balance Sheet
Net Change in Cash Balance
59.
60.
61. Financial Analysis with Microsoft Excel 7th Edition Mayes Solutions Manual
Full Download: http://alibabadownload.com/product/financial-analysis-with-microsoft-excel-7th-edition-mayes-solutions-manual/
This sample only, Download all chapters at: alibabadownload.com