Tungsten carbide nanotubes supported platinum nanoparticles as a
•
1 like•320 views

Tungsten carbide nanotubes supported platinum nanoparticles as a

Recommended
Recommended
More Related Content
What's hot
What's hot (15)
Similar to Tungsten carbide nanotubes supported platinum nanoparticles as a
Similar to Tungsten carbide nanotubes supported platinum nanoparticles as a (20)
More from Science Padayatchi
More from Science Padayatchi (20)
Recently uploaded
Recently uploaded (20)
Tungsten carbide nanotubes supported platinum nanoparticles as a
- 1. Tungsten Carbide Nanotubes Supported Platinum Nanoparticles as a Potential Sensing Platform for Oxalic Acid Thandavarayan Maiyalagan,†,§ Palanisamy Kannan,*,‡,§ Martin Jönsson-Niedziolka,*,‡ and Joanna Niedziolka-Jönsson‡ † Materials Science and Engineering Program, The University of Texas at Austin, 204 East Dean Keeton Street, Austin, Texas 78712, United States ‡ Institute of Physical Chemistry, Polish Academy of Sciences, ul. Kasprzaka 44/52, 01-224 Warsaw, Poland *S Supporting Information ABSTRACT: Supported tungsten carbide is an efficient and vital nanomaterial for the development of high-performance, sensitive, and selective electrochemical sensors. In this work, tungsten carbide with tube-like nanostructures (WC NTs) supported platinum nanoparticles (PtNPs) are synthesized and explored as an efficient catalyst toward electrochemical oxidation of oxalic acid for the first the time. The WC NTs supported PtNPs modified glassy carbon (GC) electrode is highly sensitive toward the electrochemical oxidation of oxalic acid. A large decrease in the oxidation overpotential (220 mV) and significant enhancement in the peak current compared to unmodified and Pt/C modified GC electrodes have been observed without using any redox mediator. Moreover, WC NTs supported PtNPs modified electrode possessed wide linear concentration ranges from 0 to 125 nM and a higher sensitivity toward the oxidation of oxalic acid (80 nA/nM) achieved by the amperometry method. The present modified electrode showed an experimentally determined lowest detection limit (LOD) of 12 nM (S/N = 3). Further, WC NTs supported PtNPs electrode can be demonstrated to have an excellent selectivity toward the detection of oxalic acid in the presence of a 200-fold excess of major important interferents. The practical application of WC NTs supported PtNPs has also been demonstrated in the detection of oxalic acid in tomato fruit sample, by differential pulse voltammetry under optimized conditions. Oxalic acid (OA) naturally occurs in many plants, such as spinach, ginger, tomato, and so forth, and it combines with Ca, Fe, Na, Mg, or K to form less soluble salts known as oxalates.1−3 High levels of these salts in the diet can lead to irritation of the digestive system, particularly in stomach and kidneys. It is also known to contribute to the formation of kidney stones, that is, chelation of OA with calcium ions which forms dihydrate and/or monohydrate of insoluble calcium oxalate crystals leads to hypocalcaemia, nephrotoxicity, and neurotoxicity.4,5 Therefore, the urinary level of OA has been recognized as an important indicator for the diagnosis of renal stone formation.1−3,6,7 OA can also remove calcium from blood with severe disturbances in the activity of the heart and the neural system.8 Moreover, OA is also a water pollutant resulting from some industrial processes.9,10 A fast and simple method for the accurate detection of OA has attracted considerable interest in the assessment of food quality, as well as in the analysis of wastewater. Electrochemical OA sensors, in particular enzymatic biosensors, have attracted interest in recent years. The majority of these biosensors are based on the use of oxalate oxidase (OxOx), which specifically catalyzes the oxidation of OA to CO2 and H2O2.11−18 Although these enzyme-based sensors show good selectivity and sensitivity, originating from enzyme characteristics, the most common and serious problem with enzymatic OA sensors is insufficient sensitivity and long-term stability. In addition, because the sensor sensitivity essentially depends on the enzyme activity, reproducibility is still a critical issue in quality control. On the other hand, nonenzymatic electrochemical determination of OA by various modified electrodes have also been reported, though these reports still show some disadvantages, such as higher oxidation potential (≥1 V), low sensitivity, and/or low selectivity, limit of detection, among others.1−3,8,19−22 Nanomaterials with well-defined morphology has attracted considerable interest because of applications in the design of novel electronic devices, drug carrier systems, optical sensors, and electrochemical sensors.23 Tungsten carbide (WC) has been utilized as an emerging catalyst nanomaterial, which has shown potential applications in fuel cells and oxygen catalysis.24−30 Because of its unique physical and chemical properties, such as large surface area, high conductivity, and easy modification, WC provides an ideal support for electrical Received: May 12, 2014 Accepted: July 15, 2014 Published: July 15, 2014 Article pubs.acs.org/ac © 2014 American Chemical Society 7849 dx.doi.org/10.1021/ac501768m | Anal. Chem. 2014, 86, 7849−7857
- 2. devices.24,31−33 Recently, WC-based materials have received attention in various catalytic reactions because of their platinum-like characteristics, while possessing desirable stability in both acidic and alkaline solutions as well as high tolerance toward both CO and bisulfide poisoning.34−38 Interestingly, loading of platinum nanoparticles (PtNPs) onto WC showed better catalytic activity toward methanol oxidation than a commercial Pt/C catalyst.25,26,39−44 As a result, the WC supported PtNPs have been used in fuel cell applications, especially for electrocatalytic oxidation of methanol, ethanol as well as electro-reduction of oxygen.5,39,40,45−48 For instance, Liang et al. reported that the introduction of WxC onto carbon nanotubes (CNTs) as a hybrid support for Pt electrocatalysts resulted in enhanced ORR activity in H2SO4, as compared to the conventional catalyst of Pt supported on CNTs with similar metal loading.41 Li and co-workers demonstrated that a Pt supported nanochain-structured mesoporous tungsten carbide (m-NCTC) catalyst showed superior electroactivity and high resistance to CO poisoning for methanol oxidation compared to Pt/C.30 It is important to mention that the active surface area of WC has played a crucial role for loading large amount of PtNPs in electrocatalysis reactions. Recently researchers have made an effort to improve the surface area of WC by synthesizing various nanostructured morphologies. For instance, Ganesan et.al., reported the surface area 176 m2 /g WC with microsphere structure by a polymer method.25 Shen and co-workers reported a series of nanostructured tungsten carbide/carbon composites that were synthesized in situ using a microwave heating method and found that the surface area of tungsten carbide/carbon10,20 were of 256.8 and 264.6 m2 /g, respec- tively.40 Later, Huang et.al., reported nanobamboo’s meso- porous silica structure supported WC nanoparticles with a surface area of 296 m2 /g.49 In this work, we present the synthesis of tube-like nanostructures of WC with a surface area of 339 m2 /g; followed by the accumulation of a large amount of PtNPs. To the best of our knowledge, this is the first report that describes the synthesis of this novel hybrid nanomaterial (i.e., tube-like nanostructured WC), and it can serve as an ideal support for anchoring PtNPs. Hereafter, WC nanotubes and WC nanotubes supported PtNPs will be referred to as WC NTs and WC NTs/PtNPs, respectively. A simple drop-cast approach was used for sensor electrode modification. The above modified electrodes were studied toward electrochemical oxidation of OA in acidic medium. Interestingly, the oxidation potential of OA at the WC NTs/PtNPs modified glassy carbon (GC) electrode showed 2-fold higher OA oxidation current response in comparison with a Pt/C catalyst modified GC electrode. Moreover, the WC NTs/PtNPs modified electrode showed lower onset oxidation potential and enhanced catalytic response compared to other supports such as PtNPs/Graphene and PtNPs/CNTs modified electrodes. The WC NTs supported PtNPs electrode showed an excellent sensitivity for OA detection (80 nA/nM in the amperometry method), with a detection limit (LOD) of 12 nM (S/N = 3). The sensitivity, selectivity, and LOD of this sensor is superior to the previous electrochemical-based sensors (vide infra). The present WC NTs supported PtNPs electrode is very simple to fabricate and is highly stable, sensitive, and reproducible. Thus, our work shows not only a promising new method for production of this interesting material but also its excellent properties in electrochemical sensing. We further demonstrated the deter- mination of OA in real samples, specifically in tomato extract using the WC NTs/PtNPs electrode. ■ MATERIALS AND METHODS Materials. Ammonium metatungstate hydrate (AMT), glucose, hexachloroplatinic acid hydrate (H2PtCl6.xH2O), oxalic acid (OA), and Nafion (5 wt %) solution were purchased from Sigma-Aldrich. Hydrofluoric acid, sulfuric acid, and hydrogen peroxide (30%) were purchased from Merck Ltd. Anodisc alumina membrane (AAM) template (13 mm diameter, 0.2 μm pore diameter, and 60 μm thick) was obtained commercially from Whatman Anopore Filters, Alltech. All other chemicals used were of analytical grade or better for all experiments in this work. Synthesis of WC NTs and WC NTs/PtNPs Nano- catalysts. In a typical synthesis of WC NTs supports, ammonium metatungstate (AMT) and glucose with a molar ratio of 0.04 were taken in a 20 mL Teflon-lined steel autoclave. A porous anodizc alumina membrane (13 mm diameter, 60 μm thick with a uniform pore size of 200 nm) was placed on the solution and the reaction mixture was kept in the oven at 180 °C for 24 h. The black-colored membrane thus obtained was carefully removed from the Teflon container and carbonized at 900 °C in a tube furnace under H2/N2 (VH2/VN2 = 1:3, 50 mL min−1 ) at a heating ramp of 5 °C/min for 4 h. Pt nanoparticles (nanoclusters) were loaded on the surface walls of the WC nanotubes as follows: The as-prepared WC NTs were mixed in 73 mM chloroplatinic acid hydrate and kept aside for 12 h. Then the composite sample was dried in air. Subsequently, the present Pt ions were reduced by 3 h exposure to flowing hydrogen gas at 550 °C. Materials Characterization. The morphology of the as- synthesized WC NTs nanostructures before and after PtNPs loading was investigated by field emission scanning electron microscopy (FESEM, JEOL JSM 6301F) with an acceleration voltage of 5 kV and transmission electron microscopy (TEM) (JEOL-2010F, operating at 200 kV). The samples were prepared by dropping 3 μL of a nanocomposite ink solution onto a carbon-coated copper grid. X-ray diffraction (XRD) experiments were performed to study the crystalline nature of the prepared catalysts. The XRD patterns were recorded using Bruker diffractometer with Cu Kα (λ = 1.5406°A) radiation source (Bruker D8 Advanced) at a step scan of 0.02θ, from 5 to 80, and 90θ. The accelerating voltage and the applied current were 40 kV and 40 mA, respectively. X-ray photoelectron spectroscopy (XPS) analysis was performed on a VG ESCALAB MK II with an Mg Kα (1253.6 eV) achromatic X- ray source. The Brunauer−Emmett−Teller (BET) specific surface area of the WC NTs was measured by an automatic volumetric sorption analyzer (Quantachrome, Nova1200). Energy dispersive X-ray spectroscopy (EDX) was carried out to analyze the chemical compositions of the selected area. The atomic percentage of PtNPs on WC nanotubes was controlled by stoichiometric calculation and confirmed by EDX measure- ments. Measurement of Electrochemical Sensor Activity. The electrochemical activities of the catalysts (WC NTs/PtNPs) were investigated by cyclic voltammetry (CV) and ampero- metric techniques. The experiments were performed in a three- electrode cell using an Autolab potentiostat at room temper- ature. For electrochemical measurements, 6 μL of the well- dispersed catalyst ink mixed with nafion solution was dropped onto a clean glassy carbon disk (0.196 cm2 ) electrode surface. Analytical Chemistry Article dx.doi.org/10.1021/ac501768m | Anal. Chem. 2014, 86, 7849−78577850
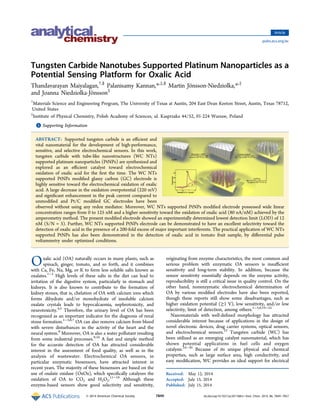
- 3. The amount of Pt loading on WC NTs catalyst was controlled to be 0.2, 0.3, 0.4, and 0.5 mg cm−2 . A saturated Ag/AgCl electrode and Pt wire were used as the reference electrode and counter electrodes, respectively, and 0.1 M H2SO4 or 0.1 M H2SO4 + 2 mM OA was used as the electrolyte in cyclic voltammetry experiments. The CV experiments were recorded at a scan rate of 50 mV s−1 from the potential of 0 to 1.5 V versus Ag/AgCl reference electrode. ■ RESULTS AND DISCUSSION Morphological Characterization of WC NTs. The controlled synthesis of nanocomposite is very important for recognition of biomolecules (i.e., biocompatibility) in biosensor technology. The morphology and nanostructure of the WCs and WCs supported PtNPs composites were examined by FE- SEM, HRTEM, XRD, and XPS methods. From the FE-SEM micrographs (Figure 1A), it can be clearly seen that the as- synthesized WCs have perfect smooth and porous nanotubes structure with fairly uniform lengths. The FE-SEM images clearly showed nanotube-like morphology with cylindrical diameter of about 70 ± 10 nm and lengths ranging between 0.5 and 1.0 μm. The formation mechanism of the nanotube- structured porous WC very likely starts from the aggregation of initially formed WC nanoparticles (nanospheres) in the AAM membrane, which are involved in self-assembly process during the course of nucleation reaction (bundles of tube-like nanostructures due to strong intratube van der Waals binding interactions). The steps involved in the formation are schematically shown in Figure 1E (steps a and b). The homogeneous aqueous solution of glucose and AMT were placed into the porous AAM membrane, which allows hydrothermal treatment at 180 °C for 24 h (Figure 1E; step a). During this treatment, initially carbonized tungsten nanospheres were formed within the AAM membrane, which are stabilized by the glucose molecules. The porous tube-like nanostructures were then formed by the self-assembling of the glucose stabilized nanospheres, probably through the charge density match during evaporation of the solvent in a vacuum oven.50 Finally, the WC NTs product was obtained through carbonization treatment at 900 °C for 4 h in H2/N2 flow (Figure 1E; step b). Brunauer−Emmett−Teller (BET) surface area measurement confirms the high porosity of the WC NTs material. The nitrogen adsorption/desorption isotherms Figure 1. High-resolution FE-SEM and TEM images of before (A and C) and after (B and D) loading of Pt nanoparticles into the surface walls of WC NTs. A uniform dispersion of PtNPs (black dots) is clearly visible on the surface of WC NTs (D). The corresponding schematic representation of PtNPs loaded on the surface of WC NTs (E). Analytical Chemistry Article dx.doi.org/10.1021/ac501768m | Anal. Chem. 2014, 86, 7849−78577851
- 4. (shown in Figure S1A, Supporting Information) with a distinct hysteretic loop at the relative pressure of P/P0 ranging from 0 to 1.0 were observed, indicating the presence of many mesopores in the sample surface. The pore size distribution was investigated by the Barrett−Joyner−Halenda (BJH) method and clearly displays a sharp peak of the pore size centered at about 5.1 nm for porous WC NTs (Supporting Information Figure S1B). The 5 nm pores are possibly produced from close packing of the completely formed WC nanotubes, which was supported by the FE-SEM measurement (Figure 1A). The WC NTs have a BET surface area of 339 m2 / g with a total pore volume of 0.41 m2 /g, exhibiting a high specific surface area in contrast to the less than 10 m2 /g for commercial WC products (Supporting Information Figure S1C). The reported porous tungsten carbide synthesized by a surfactant-assisted polymer method has displayed a surface area of 76 m2 /g with a total pore volume of 0.24 m2 /g, and an average pore size of 4.3 nm.26,51−53 Obviously, WC NTs synthesized by our approach has much higher surface area and a higher total pore volume, as well as compatible pore size (5.1 nm) to allow more amounts of PtNPs, thus indicating its better morphological properties, which will show better electro- catalytic performance. It is well-known that the specific activity of catalysts is strongly related to the metal dispersion, size, and compatibility with supporting materials. Highly dispersed catalyst nano- particles with uniform size and narrow size distribution supported on carbide nanostructures are an ideal candidate for high electrochemical activity in biosensor applications due to their large surface-to-volume ratio. To support metal nanoparticles on the surface of carbide nanostructures, metal precursor compound in the form of liquid precursors are significantly employed.54,55 The preparation of PtNPs on the tube-like WCs surfaces was achieved by the reduction of Pt precursor (H2PtCl6) by 3 h exposure to flowing hydrogen gas at 550 °C, resulting in the formation of more uniform PtNPs on the both inside and surface walls of the WC NTs. FE-SEM image of the WC NTs/PtNPs nanocomposite is shown in Figure 1B and schematically in E (step c). The image indicates that the PtNPs are in the form of small rough dots, and they are highly dispersed on the inner and outer surface of the WC NTs. The nanoparticle size was in the range of 3 ± 0.5 nm, and it was somewhat difficult to distinguish the PtNPs from the surface of WC NTs in the high-resolution SEM images (Figure 1B). Next, we performed HR-TEM analysis for as-prepared WC NTs and WC NTs/PtNPs samples, and the images of the composite clearly showed (Figure 1D) the presence of PtNPs on WC NTs surface walls. The PtNPs were discernible on the images as dark spherical dots (see Figure 1D). The PtNPs showed no tendency to agglomerate and covered both the inside and outer pore walls of the WC NTs, with a quite constant size, forming a sandwich-type structure. The PtNPs on the surface of WC NTs were spherically shaped and have a diameter of ∼3 ± 0.1 nm, which is closely matched with size distribution analysis of FE-SEM measurements. However, no such dark spots were visible specifically in the high-resolution TEM images of WC NTs before the PtNPs insertion process (see Figure 1C). In addition, the diameter size and morphology of WC NTs (obtained from TEM) matches with SEM measurements. We further confirmed the PtNPs introduction on WC NTs nanotube structures by X-ray diffraction (XRD) measurements. The XRD patterns of the product are shown in Figure 2. Three major intensive diffraction peaks were shown with 2θ values of 31.48°, 35.76°, and 48.40° (Figure 2A), which can be assigned to the planes of WC (001), (100), and (101) respectively (JCPDS 25-1047). Besides that some additional diffraction peaks with 2θ values of 64.32°, 66.20°, 74.60°, 76.42° and 77.16°, which can be assigned to the planes of WC (110), (002), (111), (200), and (102) respectively (Figure 2A). The observed diffraction features indicate that the presence of crystalline phases in tungsten carbide (WC) sample with hexagonal structure. In addition, the 2θ of 39.75◦ and 40.56◦ were corresponding to the (200) and (102) facets of bitungsten carbide (W2C) species, which shows the presence of W2C impurity in the sample. However, WC exists as the main phase of our sample. It should be mentioned that the ratio of WC to W2C in the reaction mixture depends on the initial molar ratio of AMT to glucose as well as on carbonization temperature and reaction time. The content of the WC phase increases with the increase of AMT content in the reaction mixture, which is in good agreement with recent reports.25 The 2θ values of the WC NTs sample prepared by our method was well-matched with the defined diffraction pattern of commercially available WC sample, as shown in Figure 2B. For comparison, the commercial WC sample (Figure 2B) showed the main diffraction peaks similar to our WC NTs at 31.40°, 35.81°, and 48.12°. Figure 2C shows the XRD patterns of the PtNPs on WC NTs sample. The well-distinguished peaks at 2θ = 39.40°, 45.68°, 66.84°, and 81.22° in the WC NTs/PtNPs were assigned to the (111), (200), (220), and (311) crystalline planes of the face-centered cubic (fcc) structured PtNPs (JCPDS no. 46-1043), respectively. Besides that the character- istic diffraction peaks of WC NTs were also observed at 31.48°, 35.76°, 48.40°, and 74.60°. Moreover, there was no evidence of peaks related to Pt oxide or hydroxides indicating that the Pt precursor was completely reduced onto the WC NTs. The result obtained from XRD data confirmed that PtNPs were successfully introduced into the surface walls of WC NTs. The average crystallite size of the Pt can be calculated using the Debye−Scherrer formula (eq 1): λ β θ=d 0.89 / cos (1) Figure 2. XRD patterns of as-synthesized WC NTs (A), commercial WC sample (B), Pt nanoparticles loaded on WC NTs support (C), and the Pt nanoparticles on the commercial carbon support (Pt/C) (D). Analytical Chemistry Article dx.doi.org/10.1021/ac501768m | Anal. Chem. 2014, 86, 7849−78577852
- 5. where d is the crystallite size, λ is the wavelength, β is the full width at half-maximum of the peak, and θ is the diffraction angle. In order to avoid the influence of the WC NTs, the size was calculated from the peak corresponding to Pt (220) crystal face. The average size of the catalysts was found to be 4.3 ± 0.5 nm, which is similar to the size obtained from FE-SEM and TEM images. On the other hand, XRD patterns of the Pt/C sample was also measured for comparison and presented in Figure 2D. The broad diffraction peak at about 24° was ascribed to the (002) plane of Vulcan XC-72 carbon. Additionally, four more broad peaks at about 40°, 46.5°, 68.1°, and 82.1° were corresponding to the characteristic diffraction peaks of fcc crystalline Pt (111), (200), (220), and (311) respectively. It is worthwhile to point out here that the PtNP in the Pt/C sample was poorly crystallized into the Vulcan XC-72 carbon pore surfaces. The chemical composition and electronic properties of the WC NTs and WC NTs/PtNPs samples were also studied by high-resolution XPS, and these are presented in the Supporting Information (Figure S2). Electrochemical Sensing of OA. For testing the WC NTs/PtNPs as sensors for OA, two different methods were used. Voltammetry allows discrimination against other oxidizable interferents in the potential domain. Amperometry, on the other hand, gives a very high sensitivity for low concentrations of the analyte, but it lacks the possibility of discrimination in the potential domain. Figure 3 shows cyclic voltammograms recorded in the presence and absence of 2 mM OA in 0.1 M H2SO4 at different electrodes at a scan rate of 50 mV/s. In the absence of OA, no cathodic and anodic peaks for OA were observed at the WC NTs/PtNPs modified electrode (Figure 3A, curve a). An anodic peak (broad) at around 1.0 V and a cathodic peak around 0.40 V, corresponding to the formation of platinum oxides and the reformation of a clean surface of Pt(0), respectively, could be seen. When OA was introduced in the electrolyte solution, the CV is completely different, and it can be seen that a new and well-defined oxidation peak is observed at 0.90 V. This occurs at the same time the corresponding cathodic peak around ∼0.40 V was considerably decreased at the WC NTs supported PtNPs modified GC electrode (WC NTs/PtNPs) (Figure 3A, curve b). The observed oxidation peak with higher current response could be attributed to the electro-oxidation of OA on the WC NTs/PtNPs modified electrode. We compared the effect of different electrode materials toward OA oxidation. Figure 3B presents the voltammograms obtained for the oxidation of OA at bare GC (curve a), WC NTs (curve b), Pt/C (curve c), and WC NTs/PtNPs (curve d) modified electrodes. The bare GC electrode does not show any characteristic response for the oxidation of OA in the potential window used, and WC NTs modified electrode showed a small oxidation peak around 1.30 V, which confirmed the limited catalytic behavior of WC NTs. However, it can be readily seen from curve c that an improved voltammetric response was obtained for the oxidation of OA on the Pt/C electrode at less-positive potentials (1.12 V). Interestingly, OA oxidation on WC NTs/PtNPs electrode occurred already at 0.90 V, which is ∼400 mV less positive than that on WC NT electrode, suggesting that the Pt nanoparticles supported on WC NTs efficiently catalyze the oxidation process of OA. This very large decrease in oxidation overpotential was observed in the absence of any enzymes/ mediator. Moreover, we have carried out the experiments by using other supports such as graphene (PtNPs/Graphene) and carbon nanotubes (PtNPs/CNTs), toward the electrochemical oxidation of OA. Among them, PtNPs/WC NTs have shown an excellent electrochemical oxidation response toward OA (Figure S3 in Supporting Information). To the best of our knowledge, such a large decrease in the oxidation overpotential has not been observed at any electrodes in acidic (sulfuric acid) medium. On the other hand, the WC NTs modified electrode shows a small OA oxidation peak (Figure 3B; curve b) at more- positive potential (0.13 V), presumably because of low electrocatalytic activity (i.e., slow electron-transfer kinetics). The large decrease in the oxidation overpotential associated with a substantial increase in the peak current reflects a fast electron-transfer reaction on the WC NTs/PtNPs electrode owing to their higher catalytic effect of the nanostructured Pt particles assembly. Moreover, the faster electron transfer leads to a sharper and more well-defined peak. Earlier studies have shown that the oxidation of OA involves a direct homogeneous chemical reaction between HC2O4 − and metal ions generated on the electrode surface.56−58 The PtNPs/WC NTs are electro- oxidized to yield the species that oxidize the substrate molecules first adsorbed on the electrode surface and then entering from the solution. It is likely that the electrochemically generated platinum(II) species (i.e., PtO) acts as a catalyst. The electro-oxidation of H2C2O4 involves the step of the preliminary adsorption of H2C2O4 on the Pt (Pt0 ) nano- particles in WC NTs surfaces: + →Pt H C O Pt(H C O )0 2 2 4 2 2 4 ads (i) and the adsorbed complex undergoes a subsequent probable fast hydrogen abstraction mechanism where the reactive Pt(II) species in WC NTs catalyst are involved + → + + + (H C O ) Pt(II) Pt 2CO 2H2 2 4 ads 2 (ii) Figure 3. (A) Cyclic voltammogram (CV) curves of the WC NTs/ PtNPs modified GC electrode in 0.1 M H2SO4 solution in the absence (a) and presence (b) of 2 mM OA. (B) CV curves obtained at different electrodes; bare GC (a), WC NTs (b), Pt/C (c), and WC NTs/PtNPs (d) modified electrodes in 0.1 M H2SO4 solution containing 2 mM OA. (C) CVs obtained at WC NTs/PtNPs modified GC electrode toward OA oxidation first (a), after 10th (b) and 25th (c) successive potential cycles. Scan rate: 50 mV/s. Analytical Chemistry Article dx.doi.org/10.1021/ac501768m | Anal. Chem. 2014, 86, 7849−78577853
- 6. On the other hand, adsorbed (H2C2O4)ads is then formed intermediate (CO2 species) on the PtNPs surface in an acidic medium. Then, PtNPs can provide more active sites to improve further adsorption of (H2C2O4)ads onto the surface of WC NTs catalyst, and then the adsorbed molecules of the analyte undergoes oxidation with the participation of Pt(II) formed in this range of potential (0.8−1.4 V) and concurrently reduced (0.75−0.25 V): + → + + + (H C O ) Pt(II) Pt 2CO 2H2 2 4 ads 0 2 (iii) The PtNPs were uniformly dispersed in the surface walls of WC NTs, and the nanoparticles were in good electrical communication with each other. The PtNPs are known to be more catalytically active than the bulk platinum, thus the observed higher electrocatalytic activity is due to the increase in the active surface area of the PtNPs/WC NTs electrode, and the synergetic effect between PtNPs and platinum-like behavior of WC NTs (electronic structure of WC resembles Pt metal) might exist at the interface such that the tungsten carbides intervene in the electrocatalytic catalytic process (i.e., the oxidation of OA on PtNPs/WC NTs modified elec- trode).27,59,60 The synergistic effect was explained by the strong negative electronic property of WC; when WC was used as the support for PtNPs to form the PtNPs/WC electro- catalyst, the surface electronic structure of PtNPs/WCs was different from that of the commercial Pt/C catalyst as a result of the electron-donating effect generated by the WC support to Pt. Thus, PtNPs/WC NTs showed an obvious anti-CO poisoning effect during the electro-oxidation of OA, which is also an important reason for higher electrocatalytic activity.44,61 Moreover, a strong orbital hybridization exists between Pt and WC intensifies metal support interaction between Pt and WC. This kind of metal−support (Pt-WC) interaction and structural promoting activity of WC inhibits the aggregation of PtNPs, keeping the high dispersion of the PtNPs and a narrow size distribution. It could also enhance the intrinsic activity of PtNPs toward efficient OA oxidation process.42,62,63 More importantly, this platform provides the conduction pathway within the film and allows an efficient electron-transfer process in the film. Further, the oxidation of OA at WC NTs/PtNPs modified GC electrode was found to be highly stable when scanned from 0 to 1.5 V. CVs were recorded for the oxidation of OA at the first (curve a), 10th (curve b), and 25th (curve c) successive potential cycles (Figure 3C). It can be seen in Figure 3C that the oxidation potential of OA remained stable even after 25 repeated potential cycles, indicating that the WC NTs/ PtNPs modified GC electrode do not undergo fouling during the electrochemical oxidation. This result further ascertains that adsorption of the reactant and/or intermediate oxidation (i.e., oxide products on the electrode surface) does not affect the electrode activity. Notably, PtNPs loaded graphene nanosheets modified electrodes are not stable in this wide potential scan window.64 It has been further reported that the OA reaction mechanism is highly dependent on the nature of the electrode material. When the interaction of OA molecules with the electrode surface is particularly strong, the oxidation reaction is fast.2 The current response of OA oxidation peak on the WC NTs/PtNPs modified GC electrode is 170 μM/mM, which is 2-fold higher than the Pt/C modified GC electrode. This observed result might arise from several factors: (i) the tube- like nanostructures of WC provides an excellent pathway for rapid electron transport; (ii) PtNPs on the surface of WC NTs offer numerous active sites, which allow the biomolecules to readily accessible to the inner and outer surface walls; (iii) the WC NTs/PtNPs possesses a large active surface area (vide supra); (iv) the efficient conductivity of WC (exhibits its platinum-like42,65 behavior) and its robust adhesion to PtNPs to facilitate electron conduction were well-manifested toward the oxidation of OA. These results affirmed that the WC NTs/ PtNPs modified GC electrode has proved to be an excellent electrocatalyst nanomaterial. Chollier-Brym et.al., reported57 that the catalytic activity of Pt is lower in H2SO4 at a pH value <2.5 than in HClO4, though our WC NTs/PtNPs modified GC electrode showed better catalytic activity in H2SO4 (Figure S4 in Supporting Information) as a result of the platinum-like65 behavior of WC NTs; it can also be highly supportive for PtNPs in electrocatalytic process (vide supra). Further, oxidation of OA was tested with different loading of Pt nanoparticles (0.2, 0.3, 0.4, and 0.5 mg cm−2 ) into the WC nanotubes (Figure S5 in Supporting Information). We noticed that for higher loading than 0.4 mg, there is no improvement in overpotential toward the oxidation of OA, which is why this loading was chosen for all experiments. Amperometric Detection of OA. The next important objective of the present investigation is to utilize the Pt nanoparticle-based platform for amperometric sensing of OA at low concentration levels under optimized conditions. Specifi- cally, for practical application of any sensor, it is desirable to use constant potential amperometry, which is a method that can evaluate the performance of the transducer. Figure 4A displays the amperometric responses observed for sensing of OA in nanomolar ranges at the WC NTs/PtNPs (Figure 4A: curve a) and Pt/C (Figure 4A: curve b) modified electrodes at an applied potential of 1.20 V. The addition of 5 nM, that is, 50 μL of 0.5 μM OA into a homogeneously stirred cell with 5 mL 0.1 Figure 4. (A) Amperometric i−t curve response observed at the WC NTs/PtNPs (a) and Pt/C (b) modified GC electrodes for sensing OA upon the addition of 5 nM of OA into a homogeneously stirred 0.1 M H2SO4 at regular intervals 50 s at an applied potential of 1.20 V. (B) Corresponding calibration plots for three replicate measurements. (C) DPVs obtained for before (a) and after (b−d) the addition of 100 μL of tomato fruit sample into 0.1 M H2SO4 at WC NTs/PtNPs modified electrode. The DPVs obtained after the addition of 0.5 mM commercial OA (e−g) into the same experimental solution, at WC NTs/PtNPs modified electrode from 0 to 1.20 V. Pulse width = 0.05 s, amplitude = 0.05 V, sample period = 0.02 s, and pulse period = 0.2 s. Analytical Chemistry Article dx.doi.org/10.1021/ac501768m | Anal. Chem. 2014, 86, 7849−78577854
- 7. M H2SO4 solution, led to a rapid increase in the amperometric (anodic) signal for every addition, and a steady-state current response was attained within 2 s. A linear calibration plot (Figure 4B) was obtained for three successive amperometric measurements of current versus concentration of OA in the electrochemical cell with a correlation coefficient of 0.9976 for WC NTs/PtNPs electrode. The WC NTs/PtNPs modified GC electrode showed a high sensitivity (80 nA/nM) and stable amperometric current responses, with a wide linear ranges of OA concentrations (from 0 nM to at least 125 nM).The same experiment was performed for the Pt/C modified GC electrode (Figure 4A; curve b), which resulted in a low amperometric current response as well as sensitivity (<10 nA/nM). Importantly, the WC NTs/PtNPs electrode showed a linear and stable amperometric current response with very low noise. The detection limit of WC NTs/PtNPs electrode was determined based on the 3sigma method66 (eq iv) using amperometric data (Figure 4B). σ= blimit of detection (LOD) 3 / (iv) where σ is the standard deviation of y-coordinates from the line of best fit, and b is the slope of the same line. The limit of detection for WC NTs/PtNPs electrode was calculated to be 12 nM (S/N = 3, n = 3). The standard addition procedure was repeated three times giving a standard deviation of less than 2.1% toward determination of OA in 0.1 M H2SO4 using the WC NTs/PtNPs electrode. The main advantage of WC NTs/ PtNPs electrode for OA determination is simple to construct and does not require any expensive chemicals, especially enzymes. It is worth comparing the analytical performance of the WC NTs/PtNPs electrode with those of available recent nanoparticle-modified electrodes.2,64,67 Chen and co-workers reported a detection limit of 10 μM by using platinum nanoparticle loaded graphene nanosheets modified electrode.64 Fakhari and co-workers reported a detection limit of 33 μM by a TiO2 nanoparticles/multiwalled carbon nanotubes composite modified GC electrode.67 Lie et al. observed a detection limit of 0.2 mM with a palladium nanoparticle-loaded carbon nanofiber (Pd/CNF) composites.2 We summarized the detection limits on the bais of recent reports, as shown in Table S1. We further studied the determination of OA in the presence of important common interferents such as ascorbic acid, formic acid and tartaric acid, glucose, acetate, Fe2+ , Mg2+ , Cu2+ , and Zn2+ by the amperometric method and described in Supporting Informa- tion (Figure S6). The stability and repeatability of the sensor was also tested with excellent results (Figure S7 in Supporting Information). The practical application of the WC NTs/PtNPs modified electrode for the determination of OA in real sample was tested by measuring the concentration of OA in tomato juice samples. In this case, we used DPV for the measurements because the concentration of OA is relatively high, and the presence of other oxidizable interferents can disturb the measurements. Tomatoes belong to the nightshade plant family, along with eggplant, potatoes, and bell peppers, which contain a relatively high amount of OA. The U.S. Department of Agriculture (U.S.D.A.) lists the oxalic acid content of tomatoes as 50 mg per 100 g serving.68 The oxalate content of any one type of food is highly variable depending on the state of ripeness and climate, as well as soil conditions. Very ripened tomatoes, for example, generally contain higher oxalate amounts than less mature fruit. According to previous work, oxalate levels in one specific food can differ 2- to 15-fold.69 In this work, the tomato fruit sample was diluted 50-fold in 0.1 M H2SO4 solution, without any other treatment that could reduce the matrix effect of real sample. The DPVs were obtained for the WC NTs/ PtNPs modified electrode before (curve a) and after (curve b) 100 μL of the tomato fruit sample was added into 0.1 M H2SO4 solution, as shown in Figure 4C. It shows an oxidation peak around ∼0.90 V, which is corresponding to the oxidation of OA. Further, two steps of 100 μL of tomato fruit sample were again added into the same experimental solution (curves c and d), and the oxidation peak of OA increases at the same potential (0.90 V). To confirm that the observed oxidation peak was due to OA, 0.5 mM commercial OA was spiked into the above solution, and the resulting DPV is shown in Figure 4C, curve e. An increase in oxidation peak current confirmed that the oxidation peak at 0.90 V is due to the oxidation of OA. The two more steps of subsequent addition of OA (0.5 mM) into the same experimental solution (curves f and g), clearly evidenced the oxidation of OA in real sample analysis. From the data we calculated that the concentration of OA in the tomato sample is about 100 ± 15 μM, which is in good agreement with the value from the U.S.D.A.68 The obtained results in the present study illustrated that the WC NTs/PtNPs modified electrode is highly suitable for the determination of OA in real sample analysis. ■ CONCLUSIONS In this work, we presented the synthesis of tube-like nanostructures of WC with a surface area of 339 m2 /g, followed by the accumulation of large amount of PtNPs on its surface walls. To the best of our knowledge, this is the first report that describes the synthesis of this novel hybrid nanomaterial (i.e., tube-like nanostructured WC), and it can serve as an ideal support for anchoring PtNPs. This novel PtNPs/WC NTs nanomaterial was explored as high-perform- ance nanocatalysts toward electrochemical oxidation of OA. The presented sensor method is simple and highly reprodu- cible. The WC NTs/PtNPs modified GC electrode has shown lower onset oxidation potential and enhanced catalytic response observed than the other supports such as PtNPs/Graphene and PtNPs/CNTs modified electrodes. Moreover, the WC NTs/ PtNPs modified electrode possessed OA with a wide concentration range (0−125 nM), and higher sensitivity (80 nA/nM) was achieved by the amperometry method. The WC NTs supported PtNPs electrode showed an excellent sensitivity for OA detection, with a detection limit (LOD) of 12 nM (S/N = 3) and excellent reproducibility. The WC NTs/PtNPs electrode can be demonstrated to have an excellent selectivity toward electrochemical oxidation of OA in the presence of 200- fold excess of major important interferents. Finally, the practical application of WC NTs supported PtNPs nanomaterial has also been demonstrated for the detection of OA in tomato fruit sample, by the DPV method under optimized conditions. Our findings show that WC NTs supported PtNPs can be developed as a high-performance and versatile electrocatalyst for electrochemical sensor applications. ■ ASSOCIATED CONTENT *S Supporting Information The nitrogen adsorption/desorption isotherms of WC NTs and the corresponding pore size distribution curve. The nitrogen adsorption/desorption isotherms curve of commercial tungsten carbide sample. XPS spectra of WC NTs and WC NTs supported PtNPs. Oxidation of OA by using different supports Analytical Chemistry Article dx.doi.org/10.1021/ac501768m | Anal. Chem. 2014, 86, 7849−78577855
- 8. for Pt nanoparticles. Oxidation of OA in different electrolytes. Oxidation of OA by different loading of Pt nanoparticles (0.2, 0.3, 0.4, and 0.5 mg cm−2 ) into WC NTs. Amperometric interference analysis. Long-term storage and operating stability. Comparison of different chemically modified electrodes for the determination of OA. This material is available free of charge via the Internet at http://pubs.acs.org. ■ AUTHOR INFORMATION Corresponding Authors *E-mail: martinj@ichf.edu.pl. Fax: +48 22 343 3333. Tel.: +48 22 33 343 3375. *E-mail: ktpkannan@gmail.com. Fax: +48 22 343 3333. Tel.: +48 22 33 343 3282. Author Contributions § T.M. and P.K. have contributed equally to this work. Notes The authors declare no competing financial interest. ■ ACKNOWLEDGMENTS Palanisamy Kannan thanks the European Union FP7, under the grant REGPOT-CT-2011-285949-NOBLESSE, for financial support. ■ REFERENCES (1) Ivandini, T. A.; Rao, T. N.; Fujishima, A.; Einaga, Y. Anal. Chem. 2006, 78, 3467−3471. (2) Liu, Y.; Huang, J.; Wang, D.; Hou, H.; You, T. Anal. Methods 2010, 2, 855−859. (3) Shang, L.; Zhao, F.; Zeng, B. Electroanalysis 2013, 25, 453−459. (4) Agency for Toxic Substances and Disease Registry (ATSDR); U.S. Department of Health and Human Services: Atlanta, GA, 1997. http://www.atsdr.cdc.gov/. (5) Pritchard, J. D. Ethylene Glycol Toxicological Overview. Health Protection Agency, version 3, 2011; pp 5−27. (6) Chaplin, A. J. J. Clin. Pathol. 1977, 30, 800−811. (7) Williams, H. E Kidney Int. 1978, 13, 410−417. (8) Manea, F.; Radovan, C.; Corb, I.; Pop, A.; Burtica, G.; Malchev, P.; Picken, S.; Schoonman, J. Sensors 2007, 7, 615−627. (9) Herrmann, J.-M.; Mozzanega, M.-N.; Pichat, P. J. Photochem. 1983, 22, 333−343. (10) Li, Y.; Lu, G.; Li, S. Appl. Catal., A 2001, 214, 179−185. (11) Hong, F.; Nilvebrant, N.-O.; Jönsson, L. J. Biosens. Bioelectron. 2003, 18, 1173−1181. (12) Perez, E. F.; de Oliveira Neto, G.; Kubota, L. T. Sens. Actuators, B 2001, 72, 80−85. (13) Yamazaki, S.-i.; Fujiwara, N.; Yasuda, K. Electrochim. Acta 2010, 55, 753−758. (14) Milardovi, S.; Grabari, Z.; Tkalec, M.; Rumenjak, V. J. AOAC Int. 2000, 83, 1212−1217. (15) Yadav, S.; Devi, R.; Kumari, S.; Yadav, S.; Pundir, C. S. J. Biotechnol. 2011, 151, 212−217. (16) Yadav, S.; Devi, R.; Pundir, C. S. Sensor Letters 2011, 9, 1661− 1665. (17) Chauhan, N.; Narang, J.; Shweta; Pundir, C. S. Clin. Biochem. 2012, 45, 253−258. (18) Rodriguez, J. A.; Hernandez, P.; Salazar, V.; Castrillejo, Y.; Barrado, E. Molecules 2012, 17, 8859−8871. (19) Zheng, Y.; Yang, C.; Pu, W.; Zhang, J. Food Chem. 2009, 114, 1523−1528. (20) Haber, J.; Nowak, P.; Żurek, P. Langmuir 2002, 19, 196−199. (21) Šljukić, B.; Baron, R.; Compton, R. G. Electroanalysis 2007, 19, 918−922. (22) Ahmar, H.; Fakhari, A. R.; Nabid, M. R.; Rezaei, S. J. T.; Bide, Y. Sens. Actuators, B 2012, 171−172, 611−618. (23) Hu, J.; Odom, T. W.; Lieber, C. M. Acc. Chem. Res. 1999, 32, 435−445. (24) Levy, R. B.; Boudart, M. Science 1973, 181, 547−549. (25) Ganesan, R.; Lee, J. S. Angew. Chem., Int. Ed. 2005, 44, 6557− 6560. (26) Ganesan, R.; Ham, D. J.; Lee, J. S. Electrochem. Commun. 2007, 9, 2576−2579. (27) Meng, H.; Shen, P. K. J. Phys. Chem. B 2005, 109, 22705− 22709. (28) Li, G.; Ma, C. a.; Tang, J.; Sheng, J. Electrochim. Acta 2007, 52, 2018−2023. (29) Wu, M.; Shen, P. K.; Wei, Z.; Song, S.; Nie, M. J. Power Sources 2007, 166, 310−316. (30) Wang, Y.; Song, S.; Shen, P. K.; Guo, C.; Li, C. M. J. Mater. Chem. 2009, 19, 6149−6153. (31) Zaoxue, Yan; Mei, Cai; Shen, P. K. Sci. Rep. 2013, 3, 1−7. (32) Feng, K.; Xiong, J.; Sun, L.; Fan, H.; Zhou, X. J. Alloys Compd. 2010, 504, 277−283. (33) Kumar, A.; Singh, K.; Pandey, O. P. Ceram. Int. 2011, 37, 1415− 1422. (34) Bodoardo, S.; Maja, A. M.; Penazzi, A. N.; Henn, F. E. G. Electrochim. Acta 1997, 42, 2603−2609. (35) Barnett, C. J.; Burstein, G. T.; Kucernak, A. R. J.; Williams, K. R. Electrochim. Acta 1997, 42, 2381−2388. (36) Chhina, H.; Campbell, S.; Kesler, O. J. Power Sources 2007, 164, 431−440. (37) Christian, J. B.; Smith, S. P. E.; Whittingham, M. S.; Abruña, H. D. Electrochem. Commun. 2007, 9, 2128−2132. (38) Jeon, M. K.; Daimon, H.; Lee, K. R.; Nakahara, A.; Woo, S. I. Electrochem. Commun. 2007, 9, 2692−2695. (39) Ham, D. J.; Kim, Y. K.; Han, S. H.; Lee, J. S. Catal. Today 2008, 132, 117−122. (40) Lu, J. L.; Li, Z. H.; Jiang, S. P.; Shen, P. K.; Li, L. J. Power Sources 2012, 202, 56−62. (41) Liang, C.; Ding, L.; Li, C.; Pang, M.; Su, D.; Li, W.; Wang, Y. Energy Environ. Sci. 2010, 3, 1121−1127. (42) Kok Poh, C.; Hua Lim, S.; Tian, Z.; Lai, L.; Ping Feng, Y.; Shen, Z.; Lin, J. Nano Energy 2013, 2, 28−39. (43) Wang, Y.; Song, S.; Maragou, V.; Shen, P. K.; Tsiakaras, P. Appl. Catal., B 2009, 89, 223−228. (44) Cui, G.; Shen, P. K.; Meng, H.; Zhao, J.; Wu, G. J. Power Sources 2011, 196, 6125−6130. (45) Lee, Y.-W.; Ko, A. R.; Han, S.-B.; Kim, H.-S.; Kim, D.-Y.; Kim, S.-J.; Park, K.-W. Chem. Commun. 2010, 46, 9241−9243. (46) d’Arbigny, J. B.; Taillades, G.; Marrony, M.; Jones, D. J.; Roziere, J. Chem. Commun. 2011, 47, 7950−7952. (47) Esposito, D. V.; Chen, J. G. Energy Environ. Sci. 2011, 4, 3900− 3912. (48) Ko, A. R.; Kim, J.-Y.; Oh, J.-K.; Kim, H.-S.; Lee, Y.-W.; Han, S.- B.; Park, K.-W. Phys. Chem. Chem. Phys. 2010, 12, 15181−15183. (49) Huang, Y.; Deng, F.; Ni, C.; Chen, J. G.; Vlachos, D. G. Dalton Trans. 2012, 41, 6914−6918. (50) Tian, Z. R.; Tong, W.; Wang, J. Y.; Duan, N. G.; Krishnan, V. V.; Suib, S. L. Science 1997, 276, 926−930. (51) Hara, Y.; Minami, N.; Matsumoto, H.; Itagaki, H. Appl. Catal., A 2007, 332, 289−296. (52) Chhina, H.; Campbell, S.; Kesler, O. J. Power Sources 2008, 179, 50−59. (53) Li, G.; Ma, C. a.; Zheng, Y.; Zhang, W. Microporous Mesoporous Mater. 2005, 85, 234−240. (54) Garcia, A. C.; Ticianelli, E. A. Electrochim. Acta 2013, 106, 453− 459. (55) Yan, Z.; He, G.; Cai, M.; Meng, H.; Shen, P. K. J. Power Sources 2013, 242, 817−823. (56) Johnson, J. W.; Wroblowa, H.; Bockris, J. O. M. Electrochim. Acta 1964, 9, 639−651. (57) Chollier-Brym, M. J.; Epron, F.; Lamy-Pitara, E.; Barbier, J. J. Electroanal. Chem. 1999, 474, 147−154. Analytical Chemistry Article dx.doi.org/10.1021/ac501768m | Anal. Chem. 2014, 86, 7849−78577856
- 9. (58) Martínez-Huitle, C. A.; Ferro, S.; De Battisti, A. Electrochim. Acta 2004, 49, 4027−4034. (59) Meng, H.; Shen, P. K. Chem. Commun. 2005, 4408−4410. (60) He, C.; Shen, P. K. Nano Energy 2014, 8, 52−61. (61) Ma, X.; Meng, H.; Cai, M.; Shen, P. K. J. Am. Chem. Soc. 2012, 134, 1954−1957. (62) Liu, Y.; Shrestha, S.; Mustain, W. E. ACS Catal. 2012, 2, 456− 463. (63) Poh, C. K.; Lim, S. H.; Lin, J.; Feng, Y. P. J. Phys. Chem. C 2014, 118, 13525−13538. (64) Chen, X.; Cai, Z.; Huang, Z.; Oyama, M.; Jiang, Y.; Chen, X. Nanoscale 2013, 5, 5779−5783. (65) Bennett, L. H.; Cuthill, J. R.; McAlister, A. J.; Erickson, N. E.; Watson, R. E. Science 1974, 184, 563−565. (66) Brett, C. M. A.; Brett, A. M. O.; Electrochemistry: Principles, Methods, and Applications; Oxford Science Publications: Oxford, U.K., 1993. (67) Fakhari, A. R.; Rafiee, B.; Ahmar, H.; Bagheri, A. Anal. Methods 2012, 4, 3314−3319. (68) Oxalic Acid in Tomatoes. http://www.livestrong.com/article/ 491991-oxalic-acid-tomatoes/. (69) Murray, M.T.; Pizzorno, J.; Pizzorno, L. Encyclopedia of Healing Foods; Atria Books: New York, 2005 Analytical Chemistry Article dx.doi.org/10.1021/ac501768m | Anal. Chem. 2014, 86, 7849−78577857