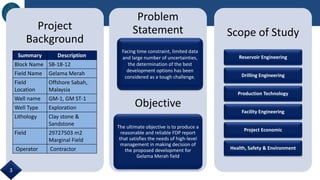
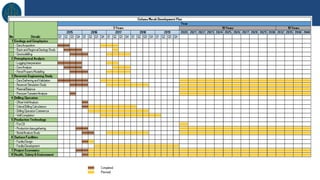
SlideShare a Scribd company logo
Gelama Merah
Group 10
Supervisor: Muhammad Aslam B Md Yusof
CONTENT
INTRODUCTION
RESERVOIR ENGINEERING
DRILLING ENGINEERING
PRODUCTION TECHNOLOGY
FACILITY ENGINEERING
PROJECT ECONOMICS
HEALTH, SAFETY & ENVIRONMENT
1
Background & Problem Statement
Objectives & Scope of Study
Regional Geology, Petrophysics &
Volumetric
INTRODUCTION
2
Project
Background
Problem
Statement
Objective
The ultimate objective is to produce a
reasonable and reliable FDP report
that satisfies the needs of high-level
management in making decision of
the proposed development for
Gelama Merah field
Scope of Study
Reservoir Engineering
Drilling Engineering
Production Technology
Facility Engineering
Project Economic
Health, Safety & Environment
Facing time constraint, limited data
and large number of uncertainties,
the determination of the best
development options has been
considered as a tough challenge.
Summary Description
Block Name SB-18-12
Field Name Gelama Merah
Field
Location
Offshore Sabah,
Malaysia
Well name GM-1, GM ST-1
Well Type Exploration
Lithology Clay stone &
Sandstone
Field 29727503 m2
Marginal Field
Operator Contractor
3
REGIONAL GEOLOGY
• Sabah can be divided into 3 basins that are
characterized by distinct structural styles
and sedimentation histories
• Sabah Basin
• NE Sabah Basin
• SE Sabah Basin
Sabah Basin
• Located in East Baram Delta Province in Sabah Basin
• Gelama Merah field located in the West Labuan-Paisley
Syncline and identified by a major North-South growth
Morris Fault
• Deposited in the later part of Middle Miocene sands
Gelama Merah Field
4
PETROPHYSICS & VOLUMETRIC
Contacts
Log-Based
Method
Formation-Pressure
Method
GOC 1468.7 m TVD 1467.7 m TVD
WOC 1498.7 m TVD 1503 m TVD
Summary of Deterministic and Probabilistic Methods
Comparison of GOC and WOC
Oil Zone
Deterministic
Probabilistic
Petrel
P10 P50 P90
330 MMSTB 250 MMSTB 485 MMSTB 850 MMSTB 423 MMSTB
Gas Zone
Deterministic
Probabilistic
Petrel
P10 P50 P90
862 BSCF 678 BSCF 850 BSCF 955 BSCF 955 BSCF
5
RESERVOIR ENGINEERING
Reservoir Data Review
Dynamic Model Setup
Reservoir Simulation
Sensitivity Study
Reservoir Management Plan
6
RESERVOIR DATA REVIEW : SUMMARY
7
Information Value Source
Oil Rim Thickness 34.3 m Log & MDT
Initial Reservoir Pressure 2116 Psia PVT Report
Bubble Point Pressure 2028.7 Psia PVT Report
Oil Volume Factor 1.17 STB/bbl PVT Report
Average Permeability 140 mD DST Analysis
Average Porosity 0.27 Log
Average Water Saturation 0.36 Log
Rock Compressibility 3.22e-6 1/Psia Hall Correlation
Table: Gelama Merah Reservoir Data Summary
RESERVOIR DATA REVIEW : MDT & PVT
1300.0
1350.0
1400.0
1450.0
1500.0
1550.0
1600.0
2050.0 2100.0 2150.0 2200.0 2250.0 2300.0
RESERVOIRDEPTH,MTVDSS
FORMATION PRESSURE, PSIA
Formation Pressure
GOC = 1468.7 m TVDSS
OWC = 1503 m TVDSS
8
RESERVOIR DATA REVIEW : RCA & SCAL
y = 0.2143x-1.835
R² = 0.7269
0
5
10
15
20
0 0.2 0.4 0.6 0.8 1
J-Function
Water Saturation, Fraction
J-FUNCTION FOR CORE 1-017, 2-010, 5-002
y = 6E+06x7.8256
R² = 0.7167
0.1
1
10
100
1000
10000
0.1 0.15 0.2 0.25 0.3 0.35 0.4
HorizontalPermeability,mD
Porosity, Fraction
POROPERM CROSSPLOT GM-ST1
9
0
0.1
0.2
0.3
0.4
0.5
0.6
0.7
0.8
0.9
1
0 0.1 0.2 0.3 0.4 0.5 0.6 0.7 0.8 0.9 1
Kr
Sg
Gas-Oil Relative Peremability
Krg
Kro
0
0.1
0.2
0.3
0.4
0.5
0.6
0.7
0.8
0.9
1
0 0.1 0.2 0.3 0.4 0.5 0.6 0.7 0.8 0.9 1
Kr
Sw
Oil-Water Relative Permeability
Krw
Kro
DYNAMIC MODEL SETUP : UPSCALING
Grid Size: 50 x 50 Grid Size: 100 x 100 Grid Size: 200 x 200
Cells Number: 642000 Cells Number: 117660 Cells Number: 16848
CPU Time: 3 – 5 hours CPU Time: 1 – 3 hours
CPU Time: 5 – 10
minutes10
RESERVOIR SIMULATION: CASES SUMMARY
Scenario Case Description Oil RF, %
Cumulative Oil,
MMSTB
Cumulative Water,
MMSTB
Cumulative Gas,
BSCF
1 7 Deviated 11.03 49.106 20.288 1130.109
2
a
2 Horizontal + 1
Deviated
7.31 32.517 0.751 280.398
b
2 Horizontal + 2
Deviated
8.77 39.028 1.599 655.509
c
2 Horizontal + 3
Deviated
10.21 45.433 3.526 855.715
d
2 Horizontal + 4
Deviated
11.41 50.753 4.288 1037.598
e
2 Horizontal + 5
Deviated
12.16 54.096 5.36 1091.203
3
a
3 Horizontal + 1
Deviated
9.25 41.165 1.623 384.976
b
3 Horizontal + 2
Deviated
10.28 45.737 2.172 860.65
c
3 Horizontal + 3
Deviated
11.68 51.961 4.256 1022.928
d
3 Horizontal + 4
Deviated
12.7 56.508 4.558 1111.716
Reservoir Cases
Scenario 1: All Deviated
Scenario 2: 2 Horizontal
+ 5 Deviated
Scenario 3: 3 Horizontal
+ 4 Deviated
11
RESERVOIR SIMULATION : WELL PLACEMENT &
CREAMING CURVE
0
1
2
3
4
5
6
7
8
9
10
11
0 1 2 3 4 5 6 7 8 9 10 11 12
UR,%
WELL COUNT
Creaming Curve at AOF
0
1
2
3
4
5
6
7
8
9
10
11
12
0 1 2 3 4 5 6 7 8 9 10 11 12
UR,%
WELL COUNT
Creaming Curve 1520 STB/day
ROI
RQI
12
P8
P1
P9
P3
GM-1
P5
P6
RESERVOIR SIMULATION : WELL BY WELL OIL
PRODUCTION PROFILE
0
1000
2000
3000
4000
5000
6000
7000
8000
0
200
400
600
800
1000
1200
1400
1600
1800
2020 2022 2025 2028 2030 2033 2036 2039
CumulativeOil,MSTB
OilRate,STB/day
Year
Well Oil Production Profiles
Rate P6
Rate P1
Rate P3
Rate P8
Rate P9
Rate P5
Rate GM1
Cumulative Oil P6
Cumulative Oil P1
Cumulative Oil P3
Cumulative Oil P8
Cumulative Oil P9
Cumulative Oil P5
Cumulative Oil GM1
0
2000
4000
6000
8000
10000
12000
2020 2022 2024 2026 2028 2030 2032 2034 2036 2038
OilRate,STB/day
Year
Well by Well Contribution - Oil Rate
Rate GM1
Rate P5
Rate P9
Rate P8
Rate P3
Rate P1
Rate P6
Year Recovery Period, Year Field Cumulative Oil Production, MMSTB Recovery Factor, %
2025 5 20.9 4.72
2030 10 42.3 9.50
2035 15 47.8 10.82
2040 20 49.1 11.03
13
RESERVOIR SIMULATION: WELL BY WELL GAS
PRODUCTION PROFILE
0
50000
100000
150000
200000
250000
300000
0
20000
40000
60000
80000
100000
120000
140000
160000
2020 2022 2025 2028 2030 2033 2036 2039
CumulativeGas,MMSCF
GasRate,MSCF/day
Year
Well Gas Production Profiles
Rate P6
Rate P1
Rate P3
Rate P8
Rate P9
Rate P5
Rate GM1
Cumulative Gas P6
Cumulative Gas P1
Cumulative Gas P3
Cumulative Gas P8
Cumulative Gas P9
Cumulative Gas P5
Cumulative Gas GM1
0
100000
200000
300000
400000
500000
600000
700000
800000
2020 2022 2024 2026 2028 2030 2032 2034 2036 2038
GasRate,MSCF/day
Year
Well by Well Contribution - Gas Rate
Rate GM1
Rate P5
Rate P9
Rate P8
Rate P3
Rate P1
Rate P6
Year Recovery Period, Year Field Cumulative Gas Production, BSCF Recovery Factor, %
2025 5 100.9 9.10
2030 10 689.9 62.26
2035 15 1094.4 98.90
2040 20 1108.0 100.00
14
SENSITIVITY STUDY: Depletion Rate
0
10000
20000
30000
40000
50000
60000
0
5000
10000
15000
20000
25000
01/01/2020 09/27/2022 06/23/2025 03/19/2028 12/14/2030 09/09/2033 06/05/2036 03/02/2039
CumulativeFieldOilProduction,MSTB
TotalFieldOilRate,STB/day
Year
Well Production Rate Sensitivities
Rate 1000
Rate 1500
Rate 2000
Rate 2500
Rate 3000
CumOIl 1000
CumOil 1500
CumOil 2000
CumOil 2500
CumOil 3000
0
5
10
15
20
25
0 5000 10000 15000 20000 25000
PlateauPeriodandFieldLife,Year
Field Plateau Oil Rate, STB/day
Plateau Period and Field Life vs Field Plateau Oil Rate
Plateau
Period
Field
Life
15
SENSITIVITY STUDY: IOR
Gas Injection
(Rate: 100
MMSCF/d/well)
Water Injection (Rate:
30 MSTB/d/well)
Natural
Depletion
INJECTORS LOCATION
16
RESERVOIR MANAGEMENT PLAN
Reservoir
Management Plan
Data
Acquisition
Oil Rim
Development
Strategy
Coning
Mitigation
Reservoir
Surveillance
Concurrent Oil
& Gas
Development
17
Offset Well Analysis
Well Trajectory
Mud & Cementing
Casing
Drilling Schedule
Drilling Problems & Technology
18
DRILLING ENGINEERING
OFFSET WELL ANALYSIS
19
1) GM-1 Well
2) GM ST-1 Well
3) Alab-1 Well
Alab-1 field is located 50 km
north-east of Labuan and 140 km
south-west of Kota Kinabalu.
Problems encountered
 Pipe stuck
 Shallow gas
WELL COORDINATES & RIG SELECTION
Types of MODUs Water Depth Average Daily Rate, USD
Jack-up rig 30 – 500 ft 77,813 - 143,496
Tender Assisted rig Anchor length 44,463 - 117,780
Semi-submersible
rig
150 – 6000 ft 300,279 – 396,342
Drill ship/ Large
Submersible
1000- 8000 ft 237,900 – 420,324
Figure: Well Coordinates
Table: Rig
Selection
• Jack up rig is chosen.
• Platform 1 as mother platform, Platform 2
as an unmanned platform
• Water depth : 42.8 m = 140.2ft
• 6 deviated wells and 1 vertical well (7
wells)
• Well 4 and Well 7 functions as appraisal
wells
20
WELL TRAJECTORY
Figure : Spider Plot for the 7 production wells21
MUD WINDOW & CASING DEPTH
Type of Casing Depth (Ft-SS) Hole Size Casing Size
Conductor casing 0 - 360 Piled case 20"
Surface casing 360 - 2170 17.5" 13.375"
Production casing 2170 – Target Depth 12.25" 9.625"
Figure: Mud Window
22
Seabed – 229.92 ft
RT
CASING SELECTION, WELL SCHEMATICS &
CEMENTING
Type of casing OD (inch) Grade
Nominal
Weight (lb/ft)
Collapse
Pressure (psi)
Internal Yield
Pressure (psi)
Joint Strength
1000 lbs
ID
(inch)
Connection
Type
Conductor 20 API 5L X-56 154.0 2140 3680 2540 18.500 XLC-S
Surface 13 3/8 J-55 54.5 1130 2730 909 12.615 BTC
Production 9 5/8
VAM TOP
( 80 ksi )
40.0 3080 5750 916 8.75 VAM TOP
Casing Type
Total
Cement
Slurry
(cu.ft)
No of sacks
(sk)
Mix Water
Required
(gal)
Additive
(cu.ft)
Surface 25348.739 21301.462 110767.60 5069.74
Production 28541.731 24187.908 125777.12 5708.34
Total 53890.471 45489.370 236544.72 10778.09
Conductercasing
20''piled-360 ft
seabed
Seabed-229.92 ft RT
Surface casing 13
3/8' 360 ft-2170 ft
Productionsasing
9 5/8 - 2170ft -TD
17 1/2''Hole
17 1/2''Hole
TOCSurface &
Productioncasing
at seabed
Table : Casing selection and grade
Table : Well Cementing
Figure : Well Schematics
23
BIT SELECTION AND DRILLING FLUID
Interval Surface Production
Hole size (in) 17 1/2 12 ¼
Casing OD (in) 13 3/8 9 5/8
Bit diameter (in) 17 1/2 12 ¼
Depth in (m-RT) 70.1 732
Depth out (m-RT) 732 Target Depth
Roller cone bit & PDC bit
Depth,TVD-
SS (ft)
Mud Weight
(ppg)
Mud design
70.1 – 2170.0 8.7 Seawater Polymer Mud
2170.0 –
Target Depth
9.8 WBM - KCL/PHPA
Table: Bit Selection
Table: Drilling Fluid
• WBM is chosen,
• OBM and SBM are expensive and
mainly for HPHT wells
• Shale inhibitor is required :
Partially-hydrolyzed Polyacrylamide
(PHPA) + KCL
• Polycrystalline Diamond Compact bit
(PDC) can operate in medium hardness
formation and also hydratable
sediments; sand and shale.
• Economically wise, PDC can’t be used
throughout the drilling
• Roller cone bits will be used with PDC
as the alternative option when rock bit
faces high wear rate
24
DRILLING SCHEDULE
Year 2017
TaskName Startdate TimeTaken Jan Feb Mac April May June July Aug Sept Oct Nov Dec Jan
GelamaMerah
Platform1 24-Feb-16 5
Well4 1-Mar-16 40
Well1 11-Apr-16 40
Well2 21-May-16 40
Well3 1-Jul-16 10
Platform2 11-Jul-16 10
Well7 21-Jul-16 40
Well5 1-Sep-16 40
Well6 11-Oct-16 40
Demob 21-Nov-16 5
270
2016
Figure: Drilling Schedule
25
DRILLING PROBLEMS & TECHNOLOGY
Figure: Drilling Schedule
26
Drilling problems are identified from the offset well analysis. Here are the possible problem that may occur:
I. Pipe stucking
II. Shallow gas
III. Lost circulation
IV. Kick & Blowout
Drilling technology assists the team in overcoming possible drilling problems. Here are some technologies
which can be used for the drilling plan.
I. Drill Dog™ Electro-Magnetic Measurement While Drilling
II. Cement Assurance Tool (CAT)
III. Directional Casing While Drilling (DCwD)
Well Performance Analysis
Production Technology Plan
Sensitivity Analysis
Well Completion
27
PRODUCTION TECHNOLOGY
 PROSPER: Nodal Analysis
WELL PERFORMANCE
ANALYSIS
Figure: Node Locations Figure: PROSPER interface28
Figure : IPR at Reservoir Pressure 2116 psia
PI : 3.95STB/day/psi
AOF : 4724.8STB/Day
PRODUCTION TECHNOLOGY PLAN
IPR Curve
Well Performance Analysis
Reservoir pressure 2116 psia
Reservoir temperature 155 *F
Water cut 0 %
Fluid Oil and water
Method BLACK OIL
GOR 336 scf/stb
Oil gravity 27.3 API
Gas gravity 0.745 sg
Water salinity 30000 ppm
H2S 0 mole%
CO2 0.62 mole%
N2 0.57 mole %
29
PRODUCTION TECHNOLOGY PLAN
Figure: System analysis
Operating Point
Rate 1803 STB/d
Pressure 1560 psig
System Analysis
30
Figure: Tubing performance with different water cuts, and @ Pr = 2116psi.
OUTFLOW PERFORMANCE PREDICTION
W C 0 10 30 40
Tubing diameter
(in)
Oil rate
(Stb/d)
Oil rate
(Stb/d)
Oil rate
(Stb/d)
Oil rate
(Stb/d)
2 1412 1295 930 663
2.75 1800 1596 1041 785
3.5 1881 1648 1015 n/a
4 1881 1622 n/a n/a
4.5 1874 1571 n/a n/a
 Sensitivity Analysis: Tubing variance vs water cut
31
Figure Tubing performance with water cut = 0, and @ Pr = 1500 psi.
Reservoir
pressure
(psia)
2116 2000 1800 1500
Tubing
diameter
(in)
Oil rate
(Stb/d)
Oil rate
(Stb/d)
Oil rate
(Stb/d)
Oil
rate
(Stb/d)
2 1412 1172 758 n/a
2.75 1800 1440 827 n/a
3.5 1881 1471 n/a n/a
4 1881 1446 n/a n/a
4.5 1874 1343 n/a n/a
Figure: Performance @ Pr 1800 psia.
Tubing variance vs reservoir pressure depletion
SENSITIVITY ANALYSIS
32
Figure 7.10 Tubing performance with different WHP @WC=0%.
WHP (psia) 100 300 450
Tubing
diameter (in)
Oil rate
(Stb/d)
Oil rate
(Stb/d)
Oil rate
(Stb/d)
2 2064 1485 841
2.75 2908 1931 909
3.5 3317 2036 811
SENSITIVITYANALYSIS: TUBING VARIANCE VS WHP
33
Functional Requirement Component
Optimize production Tubing Size ID 2.75”
Isolate producing zones Packer
Emergency containment subsurface controlled sub
safety valve (SCSSV)
Gas lift valve installation Side pocket mandrel (SPM)
Routine down-hole operation Xmas tree
Isolation devices that prevent
communication between the
tubing and the annulus.
Dummy valve
WELL COMPLETION MATRIX
Table : Completion String Components
Well Name Type
Perforated
interval, m
Remark
P1 Deviated 1502 - 1540 Producer
P3 Deviated 1505 - 1534 Producer
P5 Deviated 1499 - 1522 Producer
P6 Deviated 1468 - 1496 Producer
P8 Deviated 1503 - 1519 Producer
P9 Deviated 1496 - 1525 Producer
GLM Vertical 1521 - 1530 Producer
Table : Production Well & Perforation Interval
34
WELL COMPLETION MATRIX
Figure: Completion Schematic
Wellhead equipment that meets API Specification 6A
(equivalent to ISO 10423) is available in standard pressure
increments:
• 13.8 MPa (2000 psi)
• 20.7 MPa (3000 psi)
• 34.5 MPa (5000 psi)
• 69.0 MPa (10,000 psi)
• 103.5 MPa (15,000 psi)
• 138.0 MPa (20,000 psi)
• 207 MPa (30,000 psi)
35
Rod pump PCP
ESP Gas Lift
Artificial
Lift
• Low operating cost. Compression cost depends on the fuel
cost and compressor maintenance.
• Suitable for both conditions (gas coned well and water
coned well)
• Gas lift is believed to have a longer lifespan (10-20 years)
Gas Lift Method Justifications
ARTIFICIAL LIFT RECOMMENDATION
36
• Preference : Continuous Gas lift
• Reasons :
 High gas-oil ratio (GOR) produced fluid.
 High reservoir inflow productivity index.
 Use of side pocket mandrels allows easy wireline
replacements of gas lift valves.
 Sufficient producing gas to be used as injecting
gas.
ARTIFICIAL LIFT RECOMMENDATION
37
ARTIFICIAL LIFT DESIGN
 Maximum gas available, which is the
amount of gas present in the reservoir
 Maximum gas during uploading which
the gas each well can handle.
 Water cut which was set at 50 %
Figure: Gas lift design data selection.
38
Figure: Gas lift vales MD proposed by PROSPER
Type
GLV #1 GLV #2 GLV #1
IPO IPO Orifice
Size 1.5 1.5 -
Setting Depth, MD
P1 760 1233 1489
P3 765 1228 1495
P5 768 1231 1496
P6 750 1235 1490
P8 755 1222 1487
P9 760 1233 1499
Pilot Well, GLM 767.157 1230.43 1494
Gas lift must be installed above production packer
ARTIFICIAL LIFT DESIGN
39
PRODUCTION PLAN
ARTIFICIAL LIFT RECOMMENDATION
Figure Performance Curve Injection Gas Rate
Lift gas details
Injection Rate 3.35 MMscf/d
Inject. Pressure 1520 psig
Production Rate 1560 STBD
W C 0 10 30 40
Tubing
diameter
(in)
Oil rate
(Stb/d)
Oil rate
(Stb/d)
Oil rate
(Stb/d)
Oil rate
(Stb/d)
2 1412 1295 930 663
2.75 1800 1596 1041 785
3.5 1881 1648 1015 n/a
4 1881 1622 n/a n/a
4.5 1874 1571 n/a n/a
40
Concept Design
Extraction Facility
Processing Facility
Exporting Facility
41
FACILITY ENGINEERING
Exporting
Processing
Extraction
Facility
*** Main design requirement:
Water depth
Environmental
conditions
Number of wells
Equipment
requirements
Life of the field
Frequency of
human
intervention on
the platform
Interfacing
requirements
 42.8 m
 not very harsh but with
alternating monsoon
period.
 7 deviated wells
 Integrated WHP-CPP-LQ in
single Jacket
 20 years.
 24/7
 subsea pipeline system
42
Location of wells and platforms Topside Structure Schematics
Subsea Structure SchematicsEquipment Arrangement plan
WHY Jacket?
 Support large deck loads
 Large field, long term
production
 Piles result in good stability
 Little effect from sea floor
scour
 Used for production up to
130m water depths
 Cheaper
43
Dry Tree Wet Tree
Advantages
 Tree and well control at surface
in close proximity of people
 Direct vertical access to wells for
future intervention activities
 Minimal offshore construction
 Enable future drilling and
expansion
- Tree and well access the
seabed isolated from people
- Full range of gull types can be
used
- Simplified riser/vessel
interfaces
- Preferable for deep water
installation
 Christmas Tree
Wellhead and Manifold
Conventional Approach Multiport Flow Selector (MPFS)
Complex piping arrangement / valves /
actuators and controls
 Simple piping arrangement with
minimum valves
Large number of leak points risking
production downtime
 Reduced leak points
Occupies more space and much higher
weight
 Compact system, reduced space and
weight
Prone to Human error  Reduced/ minimum human error
Expensive  Economical
 Manifold
44
 Separator
Reciprocating Compressor Centrifugal Compressor
- Low horsepower (< 2,000 hp)
- High-ratio applications
- Size up to 10,000 hp
- Higher fuel efficiency
- Much higher turndown
capabilities
 High horsepower (>4,000 hp)
 For low ratio (<2.5) in 1000 hp
 Cheaper
 Takes less space
 Less weightage
 Has higher availability
 Lower maintenance costs
 Compressor
 Gas Lifting Surface Facility
Horizontal Vertical Spherical
 Can handle much higher GOR
 Cheaper than the vertical
separator
 Easier and cheaper to ship and
assemble
 greater liquid capacity
 Reduces turbulence and reduces
foaming, thus it can handle
foaming crude
- Easier to clean
- Save space
- Provides better
surge control
- Liquid level control
is not critical
- Cheapest
- Better
clean-out
45
 Produced Water Treatment
 Gas and Oil Metering system
 Flaring and Venting System
Multiphase
flow meter
(MPFM)
Simple Design
Low maintenance cost
Reliability
Weight and space reduction ability
 Emergency Shutdown System
* ESD valves for flowline and pipeline should be located away
from facility.
46
* The Flaring system
contains of a flare boom
linked with pipes to
accumulate the gas to be
burnt.
 Drainage System
Open Drains –water from rain, seawater spray.
Closed Drains – collects water from process areas, where water is polluted
and hazardous
Power Generator Type Advantages
Gas Turbines
 Economic for continuous operation of
generators
 Tolerant to high ambient conditions and
elevations
 Low owning and operating costs
 Best fuel efficiency
 Low emission level
 No local fuel storage requirement
Diesel Generator
Renewable Energy
High voltage direct current
 Power Generation  Communication Links
 Seawater Systems
 Helifuel System
Link type Advantage
Microwave line
of sight
Low cost equipment, high
capacity, high reliability.
Troposcatter
 High capacity, high
reliability, no delay, no
recurring monthly
costs, distance 30-250
km.
Fresh water system - Vapour Vacuum Compression (VVC) distillation
Cooling system for generators, ventilation, and air conditioning
Washing facilities - the treatment for water from kitchen, showers and
toilets before being discharged to sea.
Bilge system is a pump system that is used to prevent from flooding of
machinery spaces and pump rooms.
Fixed fire fighting system: fire main and helideck foam systems
* Fuel filter
* Flow meter
* Hose reels with dispensing nozzles
* Electric bonding and spill containment foam based fire fighting system
 Sand Separation System
* The sand that separated from hydrocarbon fluids should
be removed and transported ashore for disposal.
47
Pipeline System: safe, high efficiency for oil transmission, wide transmission capacity, high
economic profit for long life field.
Petronas’s Samarang (1975) oil field with 6-
in. OD natural gas pipeline and 8-in. OD
crude oil pipeline.
Pipeline Flow Assurance:
Hydrate formation
Maintain system operating pressure lower
than hydrate formation threshold
Corrosion Protection System:
Internal Protection
External Protection Cathodic protection
DC current through metal
Corrosion inhibitors
Pigging debris
Location of GM and Samarang fields
48
49
Revenue Over Cost PSC
Fiscal Terms
Economic Assumptions
Development Options
Economic Analysis
PROJECT ECONOMICS
REVENUE OVER COST PSC (1997)
• Encourage additional investment in
Malaysia’s small/marginal oil and
gas discoveries
• Allows contractors to accelerate
their cost recovery if they perform
within certain cost targets
• Allow contractor to own higher
share of profit when their
profitability is low
• Increase NOC’s share of profit when
the contractor’s profitability
improves
• Essentially a self-adjusting formula
of =
Cumulative Revenue
Cumulative Cost
50
Gross
Revenue
Profit Split
Contractor : NOC
(Depends on R/C)
Cost Ceiling
(Depends on R/C)
Government Cash
Flow
Petroleum Income Tax 38%
Royalty 10%
Petroleum Income Tax 38%
Cost
Ceiling
Contractor’s Profit
Contractor Cash
Flow
NOC Cash Flow
NOC Profit
FISCAL TERMS
Contractor’s
R/C Index
Cost
Ceiling
(%)
Profit Ratio (%)
Below THV
NOC : Contractor
Above THV
NOC : Contractor
0.0 < R/C <= 1.0 70 20 : 80 60 : 40
1.0 < R/C <= 1.4 60 30 : 70 70 : 30
1.4 < R/C <= 2.0 50 40 : 60 70 : 30
2.0 < R/C <= 2.5 30 50 : 50 70 : 30
2.5 < R/C <= 3.0 30 60 : 40 70 : 30
R/C > 3.0 30 70 : 30 90 : 10
Note: Oil THV (30 MMSTB) and Gas THV (750 BSCF)
Terms Details
Royalty 10%
Export Duty 10%
Petroleum Income Tax 38%
Contract Period:
Exploration
Development
Production
3 years
4 years
20 years
Research Cess 0.5% (Not inclusive in Cost Oil)
Cost Ceiling Sliding Scale (Up to 70%)
Profit Sharing R/C Index (Max 70%)
NOC Participation Min 15%
Supplementary Payment 70%
51
Table: Fiscal Terms
Table: R/C Index
ECONOMIC ASSUMPTIONS
Fiscal Terms Export Duty, Research Cess and NOC Participation was not taken into account.
Reference Year The year of evaluation is 2016.
First Oil The first oil to be produced from Gelama Merah is expected to be in 2020.
Production Period
A production period of 20 years is expected with a plateau of approximately 10642
stb/day for the first 10 years and then declining.
Decommissioning Year Decommissioning period will be after 20 years of production period in 2039.
Oil and Gas Price
The oil and gas price is assumed to be $60/bbl and $4/mscf respectively based on
previous oil crash trends.
OPEX
The base OPEX is obtained to be approximately $6.35 million/year but will increase
based on the requirement for gas lift and produced water treatment.
Compounding Factor An escalation of 2.5% per annum is assumed to account for the inflation rate.
Discount Rate
Assumed to be 10% WACC during the evaluation according to the opportunity cost
of capital, acquisition cost of capital and risk management.
52
DEVELOPMENT OPTIONS
Criteria Unit Option 1 Option 2 Option 3
Cumulative Oil MMSTB 49.08 54.03 56.45
Cumulative Gas TSCF 1.13 1.09 1.11
Cumulative Water MMSTB 20.21 5.28 4.52
CAPEX $MM 247.75 290.75 301.75
NPV @ 10% $MM 564.71 406.11 392.94
IRR % 47 28 28
Payout Period Years 2.19 3.74 3.79
PIR Ratio 6.02 5.31 4.79
Drilling Option
 Option 1: 7 Deviated wells
 Option 2: 5 Deviated and 2 horizontal wells
 Option 3: 4 Deviated and 3 horizontal wells
Facility Option
 Option 1: Tie-in pipeline to Samarang pipeline
 Option 2: Pipeline to LCOT
Criteria Unit Option 1 Option 2
CAPEX $MM 247.75 289.51
NPV @ 10% $MM 564.71 552.19
IRR % 47 41
Payout Period Years 2.19 2.48
PIR Ratio 6.02 5.05
53
ECONOMIC ANALYSIS
-250
-50
150
350
550
750
950
1150
1350
2016 2017 2018 2019 2020 2021 2022 2023 2024 2025 2026 2027 2028 2029 2030 2031 2032 2033 2034 2035 2036 2037 2038 2039
CashFlow($MM)
Cash Flow Profile
Net Cash Flow Cumulative Cash Flow
Development AbandonmentProduction
Project
Starts 2016
Project
Ends 2039
1st Production
in 2020
Payout Period =
6.19 years
PIR =
$ 𝟏𝟑𝟐𝟔 𝐦𝐢𝐥𝐥𝐢𝐨𝐧
$ 𝟐𝟐𝟎 𝐦𝐢𝐥𝐥𝐢𝐨𝐧
= 6.02
Maximum Capital Outlay
= $ 220 million
Breakeven
Terminal Cash Plus
= $ 1326 million
Year
Net Cash Flow
($MM)
Cumulative
Cash Flow
($MM)
2016 -73.5 -73.5
2017 -82.24 -155.74
2018 -52.4 -208.14
2019 -12.28 -220.42
2020 120.703 -99.717
2021 78.9047 -20.812
2022 111.403 90.5909
2023 109.72 200.311
2024 85.6383 285.949
2025 53.0546 339.004
2026 122.462 461.466
2027 77.6566 539.123
2028 120.815 659.938
2029 165.752 825.689
2030 202.998 1028.69
2031 100.727 1129.41
2032 67.7283 1197.14
2033 46.5664 1243.71
2034 37.2602 1280.97
2035 33.5185 1314.49
2036 13.5407 1328.03
2037 11.2728 1339.3
2038 5.49916 1344.8
2039 -18.36 1326.44
54
ECONOMIC ANALYSIS
Discount Rate
(%)
Unit 0 5 10 15 20 25 30 35 40 45 50 55 60 65 70 75 80 85 90 95 100
NPV $MM 1326 852 565 382 260 176 115 70 35 8 -14 -32 -47 -60 -71 -81 -89 -97 -103 -109 -114
-200
0
200
400
600
800
1000
1200
1400
0 5 10 15 20 25 30 35 40 45 50 55 60 65 70 75 80 85 90 95 100
NPV($MM)
Discount Rate (%)
NPV vs Discount Rate
IRR = 47%
WACC = 10%
55
ECONOMIC ANALYSIS
250
350
450
550
650
750
850
-90% -75% -60% -45% -30% -15% 0 15% 30% 45% 60% 75% 90%
NPV@10%($MM)
Spider Plot
Oil Production Oil Price
CAPEX OPEX
Gas Production Gas Price
Tornado Plot
0% 100%-100%
Gas Price
Gas Production
Oil Price
Oil Production
CAPEX
OPEX
56
Parameter
NPV @ 10% ($MM)
-90% -75% -60% -45% -30% -15% 0 15% 30% 45% 60% 75% 90%
OPEX 579 577 575 573 571 568 565 562 560 557 556 553 551
CAPEX 618 609 606 605 592 580 565 549 532 514 495 476 457
Oil Production 297 354 413 468 513 546 565 583 621 641 677 681 713
Oil Price 295 342 390 434 478 522 565 607 649 687 727 767 806
Gas Production 280 343 401 457 511 521 565 568 604 642 628 661 694
Gas Price 274 323 374 418 466 515 565 614 664 712 761 809 858
Table: Sensitivity Parameters
HSE Development Plant
HSE Management System
Abandonment
57
HEALTH, SAFETY & ENVIRONMENT
Objectives:
 To minimize any negative impact that may occur
 To reach the highest possible level of safety
 To protect its employees, contractors,
customers and local surrounding
HEALTH, SAFETY AND ENVIRONMENT
58
 Safety precaution when
conducting exploration,
development and abandonment
Example of HSE plan
• PETRONAS Health,
Safety & Environment
Management System
(HSEMS)
• Comply to PETRONAS
Regulatory
• Any negligence or
deviation should be
justified.
HSE DEVELOPMENT PLAN
59
Before Exploration
• Secure the area
• Risk assessment
• Selection of contractor and
equipment
During Exploration
• Periodic inspection
• HSE Training Programme
• Cultivate awareness
• Practice emergency drill
Development
• Risk assessment
• Determine treatment
system
Production
• System selection to control
flow rate
• Pipeline inspection for
corrosion purpose
Abandonment
• Determine depth to plug the
well
• Inspection of any
contamination
• Recycle/dispose equipment
HSE DEVELOPMENT PLAN
60
1
• HSE Policy and Strategy Objective
2
• Organization
3
• Arrangement
4
• Risk Management
5
• Planning and Procedure
6
• Implementation and Performance Monitoring
HSE MANAGEMENT SYSTEM
Figure : HSE Management System
61
ABANDONMENT
• Comply with minimum requirement for Plug and
Abandonment(P&A)
• Plug must be verified by the particular engineer that in charge
for particular well
• Well P&A programme and suspension should be submitted to
PETRONAS for approval
62
Perforate
THANK YOU
Question
&
Answer
63

More Related Content

What's hot

Material balance Equation
  Material balance Equation  Material balance Equation
Material balance Equation
Ashfaq Ahmad
 
Waterflood Design and Operational Best Practices
Waterflood Design and Operational Best PracticesWaterflood Design and Operational Best Practices
Waterflood Design and Operational Best Practices
Society of Petroleum Engineers
 
Tubing Performance Relation (TPR)
Tubing Performance Relation (TPR)Tubing Performance Relation (TPR)
Tubing Performance Relation (TPR)
James Craig
 
Acid Fracturing Stimulation
Acid Fracturing StimulationAcid Fracturing Stimulation
Acid Fracturing Stimulation
Himanshu Rajawat
 
Artificial Lift Screening and Selection
Artificial Lift Screening and SelectionArtificial Lift Screening and Selection
Artificial Lift Screening and Selection
Andres Martingano
 
ADVANCED ENHANCE OIL RECOVERY. LECTURE NOTES.pptx
ADVANCED ENHANCE OIL RECOVERY. LECTURE NOTES.pptxADVANCED ENHANCE OIL RECOVERY. LECTURE NOTES.pptx
ADVANCED ENHANCE OIL RECOVERY. LECTURE NOTES.pptx
RAOULMartialTIENTCHE
 
Chemical EOR
Chemical EORChemical EOR
Chemical EOR
MANZIL NATH
 
Artificial Lift Selection Criterion
Artificial Lift Selection CriterionArtificial Lift Selection Criterion
Artificial Lift Selection Criterion
Balaji Chennakrishnan
 
Casing of oil well
Casing of oil wellCasing of oil well
Casing of oil well
Rakesh Kumar
 
Petroleum Production Engineering - Perforation
Petroleum Production Engineering - PerforationPetroleum Production Engineering - Perforation
Petroleum Production Engineering - Perforation
James Craig
 
Sand control
Sand controlSand control
Sand control
AnindiaMisra
 
Applied reservoir eng
Applied reservoir engApplied reservoir eng
Applied reservoir eng
mohamad1286
 
Well Completion Design.pdf
Well Completion Design.pdfWell Completion Design.pdf
Well Completion Design.pdf
mmody4
 
Skin Factor and Formation Damage
Skin Factor and Formation DamageSkin Factor and Formation Damage
Skin Factor and Formation Damage
Nouh Almandhari
 
Reservoir Modeling with Petrel
Reservoir Modeling with PetrelReservoir Modeling with Petrel
Reservoir Modeling with Petreladeeba setu
 
Water coning in oil wells and DWS technology
Water coning in oil wells and DWS technologyWater coning in oil wells and DWS technology
Water coning in oil wells and DWS technology
shubhamsaxena2329
 
waterflooding
waterfloodingwaterflooding
waterflooding
Gowtham Dada
 
Guidelines for field development plan
Guidelines for field development planGuidelines for field development plan
Guidelines for field development plan
Giuseppe Moricca
 
Casing design
Casing designCasing design
Directional drilling
Directional drillingDirectional drilling
Directional drilling
amrhaggag
 

What's hot (20)

Material balance Equation
  Material balance Equation  Material balance Equation
Material balance Equation
 
Waterflood Design and Operational Best Practices
Waterflood Design and Operational Best PracticesWaterflood Design and Operational Best Practices
Waterflood Design and Operational Best Practices
 
Tubing Performance Relation (TPR)
Tubing Performance Relation (TPR)Tubing Performance Relation (TPR)
Tubing Performance Relation (TPR)
 
Acid Fracturing Stimulation
Acid Fracturing StimulationAcid Fracturing Stimulation
Acid Fracturing Stimulation
 
Artificial Lift Screening and Selection
Artificial Lift Screening and SelectionArtificial Lift Screening and Selection
Artificial Lift Screening and Selection
 
ADVANCED ENHANCE OIL RECOVERY. LECTURE NOTES.pptx
ADVANCED ENHANCE OIL RECOVERY. LECTURE NOTES.pptxADVANCED ENHANCE OIL RECOVERY. LECTURE NOTES.pptx
ADVANCED ENHANCE OIL RECOVERY. LECTURE NOTES.pptx
 
Chemical EOR
Chemical EORChemical EOR
Chemical EOR
 
Artificial Lift Selection Criterion
Artificial Lift Selection CriterionArtificial Lift Selection Criterion
Artificial Lift Selection Criterion
 
Casing of oil well
Casing of oil wellCasing of oil well
Casing of oil well
 
Petroleum Production Engineering - Perforation
Petroleum Production Engineering - PerforationPetroleum Production Engineering - Perforation
Petroleum Production Engineering - Perforation
 
Sand control
Sand controlSand control
Sand control
 
Applied reservoir eng
Applied reservoir engApplied reservoir eng
Applied reservoir eng
 
Well Completion Design.pdf
Well Completion Design.pdfWell Completion Design.pdf
Well Completion Design.pdf
 
Skin Factor and Formation Damage
Skin Factor and Formation DamageSkin Factor and Formation Damage
Skin Factor and Formation Damage
 
Reservoir Modeling with Petrel
Reservoir Modeling with PetrelReservoir Modeling with Petrel
Reservoir Modeling with Petrel
 
Water coning in oil wells and DWS technology
Water coning in oil wells and DWS technologyWater coning in oil wells and DWS technology
Water coning in oil wells and DWS technology
 
waterflooding
waterfloodingwaterflooding
waterflooding
 
Guidelines for field development plan
Guidelines for field development planGuidelines for field development plan
Guidelines for field development plan
 
Casing design
Casing designCasing design
Casing design
 
Directional drilling
Directional drillingDirectional drilling
Directional drilling
 

Similar to Field Development Project : Gelama Merah

Study project - Traffic engineering 2019
Study project - Traffic engineering 2019Study project - Traffic engineering 2019
Study project - Traffic engineering 2019
Oleg Buyanov
 
BDC VUB # 150 TTRC modified oct 26_KDK
BDC VUB # 150 TTRC modified oct 26_KDKBDC VUB # 150 TTRC modified oct 26_KDK
BDC VUB # 150 TTRC modified oct 26_KDKKevin Kelley
 
1st Presentation NAME 338
1st Presentation NAME 338 1st Presentation NAME 338
1st Presentation NAME 338
Kifayath Chowdhury
 
NAME 338 , Presentation 1
NAME 338 , Presentation 1NAME 338 , Presentation 1
NAME 338 , Presentation 1
Kifayath Chowdhury
 
Review Week_12_Customer_PulauPanggung (PT.BAS).pptx
Review Week_12_Customer_PulauPanggung (PT.BAS).pptxReview Week_12_Customer_PulauPanggung (PT.BAS).pptx
Review Week_12_Customer_PulauPanggung (PT.BAS).pptx
noelmanroe1
 
IRJET- Geotechnical Investigation of Different Soil Samples using Regression ...
IRJET- Geotechnical Investigation of Different Soil Samples using Regression ...IRJET- Geotechnical Investigation of Different Soil Samples using Regression ...
IRJET- Geotechnical Investigation of Different Soil Samples using Regression ...
IRJET Journal
 
160901_MarketingPresent_Ver39
160901_MarketingPresent_Ver39160901_MarketingPresent_Ver39
160901_MarketingPresent_Ver39F Hary Kristiono
 
Design of security room
Design of security roomDesign of security room
Design of security room
Nabendu Lodh
 
Connecting Bridge
Connecting BridgeConnecting Bridge
Connecting Bridge
MahfuzurRahman939513
 
Operations ETI-DLH
Operations ETI-DLHOperations ETI-DLH
Operations ETI-DLH
Win Nyunt Aung
 
B.3. RESISTANCE C3
B.3. RESISTANCE C3B.3. RESISTANCE C3
B.3. RESISTANCE C3Andrei Loata
 
Divine Somiari,S Well Bore Stability Presentation
Divine  Somiari,S Well Bore Stability PresentationDivine  Somiari,S Well Bore Stability Presentation
Divine Somiari,S Well Bore Stability Presentation
dsomiari
 
Divine Somiari,S Well Bore Stability Presentation
Divine  Somiari,S Well Bore Stability PresentationDivine  Somiari,S Well Bore Stability Presentation
Divine Somiari,S Well Bore Stability Presentation
gillshood
 
final-herbst-ogp-05-01-14.pptx
final-herbst-ogp-05-01-14.pptxfinal-herbst-ogp-05-01-14.pptx
final-herbst-ogp-05-01-14.pptx
AnithaDas6
 
Hard Rock Mine Design Project
Hard Rock Mine Design ProjectHard Rock Mine Design Project
Hard Rock Mine Design Project
AshishKumar3265
 
SARNATH-PROFILE-CAE
SARNATH-PROFILE-CAESARNATH-PROFILE-CAE
SARNATH-PROFILE-CAESarnath R
 
15811-55S00.pdf
15811-55S00.pdf15811-55S00.pdf
15811-55S00.pdf
Mian Majid
 
Lcl users manual electrical drawings
Lcl users manual electrical drawingsLcl users manual electrical drawings
Lcl users manual electrical drawingsbibimisael
 
2015 Denbury Presentation
2015 Denbury Presentation2015 Denbury Presentation
2015 Denbury PresentationPerry Hawks
 

Similar to Field Development Project : Gelama Merah (20)

Study project - Traffic engineering 2019
Study project - Traffic engineering 2019Study project - Traffic engineering 2019
Study project - Traffic engineering 2019
 
BDC VUB # 150 TTRC modified oct 26_KDK
BDC VUB # 150 TTRC modified oct 26_KDKBDC VUB # 150 TTRC modified oct 26_KDK
BDC VUB # 150 TTRC modified oct 26_KDK
 
1st Presentation NAME 338
1st Presentation NAME 338 1st Presentation NAME 338
1st Presentation NAME 338
 
NAME 338 , Presentation 1
NAME 338 , Presentation 1NAME 338 , Presentation 1
NAME 338 , Presentation 1
 
Review Week_12_Customer_PulauPanggung (PT.BAS).pptx
Review Week_12_Customer_PulauPanggung (PT.BAS).pptxReview Week_12_Customer_PulauPanggung (PT.BAS).pptx
Review Week_12_Customer_PulauPanggung (PT.BAS).pptx
 
IRJET- Geotechnical Investigation of Different Soil Samples using Regression ...
IRJET- Geotechnical Investigation of Different Soil Samples using Regression ...IRJET- Geotechnical Investigation of Different Soil Samples using Regression ...
IRJET- Geotechnical Investigation of Different Soil Samples using Regression ...
 
160901_MarketingPresent_Ver39
160901_MarketingPresent_Ver39160901_MarketingPresent_Ver39
160901_MarketingPresent_Ver39
 
Design of security room
Design of security roomDesign of security room
Design of security room
 
Connecting Bridge
Connecting BridgeConnecting Bridge
Connecting Bridge
 
Operations ETI-DLH
Operations ETI-DLHOperations ETI-DLH
Operations ETI-DLH
 
B.3. RESISTANCE C3
B.3. RESISTANCE C3B.3. RESISTANCE C3
B.3. RESISTANCE C3
 
Divine Somiari,S Well Bore Stability Presentation
Divine  Somiari,S Well Bore Stability PresentationDivine  Somiari,S Well Bore Stability Presentation
Divine Somiari,S Well Bore Stability Presentation
 
Divine Somiari,S Well Bore Stability Presentation
Divine  Somiari,S Well Bore Stability PresentationDivine  Somiari,S Well Bore Stability Presentation
Divine Somiari,S Well Bore Stability Presentation
 
final-herbst-ogp-05-01-14.pptx
final-herbst-ogp-05-01-14.pptxfinal-herbst-ogp-05-01-14.pptx
final-herbst-ogp-05-01-14.pptx
 
Hard Rock Mine Design Project
Hard Rock Mine Design ProjectHard Rock Mine Design Project
Hard Rock Mine Design Project
 
Training PPT
Training PPTTraining PPT
Training PPT
 
SARNATH-PROFILE-CAE
SARNATH-PROFILE-CAESARNATH-PROFILE-CAE
SARNATH-PROFILE-CAE
 
15811-55S00.pdf
15811-55S00.pdf15811-55S00.pdf
15811-55S00.pdf
 
Lcl users manual electrical drawings
Lcl users manual electrical drawingsLcl users manual electrical drawings
Lcl users manual electrical drawings
 
2015 Denbury Presentation
2015 Denbury Presentation2015 Denbury Presentation
2015 Denbury Presentation
 

Recently uploaded

Chapter 3 - Islamic Banking Products and Services.pptx
Chapter 3 - Islamic Banking Products and Services.pptxChapter 3 - Islamic Banking Products and Services.pptx
Chapter 3 - Islamic Banking Products and Services.pptx
Mohd Adib Abd Muin, Senior Lecturer at Universiti Utara Malaysia
 
Adversarial Attention Modeling for Multi-dimensional Emotion Regression.pdf
Adversarial Attention Modeling for Multi-dimensional Emotion Regression.pdfAdversarial Attention Modeling for Multi-dimensional Emotion Regression.pdf
Adversarial Attention Modeling for Multi-dimensional Emotion Regression.pdf
Po-Chuan Chen
 
2024.06.01 Introducing a competency framework for languag learning materials ...
2024.06.01 Introducing a competency framework for languag learning materials ...2024.06.01 Introducing a competency framework for languag learning materials ...
2024.06.01 Introducing a competency framework for languag learning materials ...
Sandy Millin
 
Supporting (UKRI) OA monographs at Salford.pptx
Supporting (UKRI) OA monographs at Salford.pptxSupporting (UKRI) OA monographs at Salford.pptx
Supporting (UKRI) OA monographs at Salford.pptx
Jisc
 
Guidance_and_Counselling.pdf B.Ed. 4th Semester
Guidance_and_Counselling.pdf B.Ed. 4th SemesterGuidance_and_Counselling.pdf B.Ed. 4th Semester
Guidance_and_Counselling.pdf B.Ed. 4th Semester
Atul Kumar Singh
 
The Roman Empire A Historical Colossus.pdf
The Roman Empire A Historical Colossus.pdfThe Roman Empire A Historical Colossus.pdf
The Roman Empire A Historical Colossus.pdf
kaushalkr1407
 
How libraries can support authors with open access requirements for UKRI fund...
How libraries can support authors with open access requirements for UKRI fund...How libraries can support authors with open access requirements for UKRI fund...
How libraries can support authors with open access requirements for UKRI fund...
Jisc
 
Introduction to AI for Nonprofits with Tapp Network
Introduction to AI for Nonprofits with Tapp NetworkIntroduction to AI for Nonprofits with Tapp Network
Introduction to AI for Nonprofits with Tapp Network
TechSoup
 
The Challenger.pdf DNHS Official Publication
The Challenger.pdf DNHS Official PublicationThe Challenger.pdf DNHS Official Publication
The Challenger.pdf DNHS Official Publication
Delapenabediema
 
Home assignment II on Spectroscopy 2024 Answers.pdf
Home assignment II on Spectroscopy 2024 Answers.pdfHome assignment II on Spectroscopy 2024 Answers.pdf
Home assignment II on Spectroscopy 2024 Answers.pdf
Tamralipta Mahavidyalaya
 
aaaaaaaaaaaaaaaaaaaaaaaaaaaaaaaaaaaaaaaaa
aaaaaaaaaaaaaaaaaaaaaaaaaaaaaaaaaaaaaaaaaaaaaaaaaaaaaaaaaaaaaaaaaaaaaaaaaaaaaaaaaa
aaaaaaaaaaaaaaaaaaaaaaaaaaaaaaaaaaaaaaaaa
siemaillard
 
Unit 8 - Information and Communication Technology (Paper I).pdf
Unit 8 - Information and Communication Technology (Paper I).pdfUnit 8 - Information and Communication Technology (Paper I).pdf
Unit 8 - Information and Communication Technology (Paper I).pdf
Thiyagu K
 
Sha'Carri Richardson Presentation 202345
Sha'Carri Richardson Presentation 202345Sha'Carri Richardson Presentation 202345
Sha'Carri Richardson Presentation 202345
beazzy04
 
Instructions for Submissions thorugh G- Classroom.pptx
Instructions for Submissions thorugh G- Classroom.pptxInstructions for Submissions thorugh G- Classroom.pptx
Instructions for Submissions thorugh G- Classroom.pptx
Jheel Barad
 
TESDA TM1 REVIEWER FOR NATIONAL ASSESSMENT WRITTEN AND ORAL QUESTIONS WITH A...
TESDA TM1 REVIEWER  FOR NATIONAL ASSESSMENT WRITTEN AND ORAL QUESTIONS WITH A...TESDA TM1 REVIEWER  FOR NATIONAL ASSESSMENT WRITTEN AND ORAL QUESTIONS WITH A...
TESDA TM1 REVIEWER FOR NATIONAL ASSESSMENT WRITTEN AND ORAL QUESTIONS WITH A...
EugeneSaldivar
 
Francesca Gottschalk - How can education support child empowerment.pptx
Francesca Gottschalk - How can education support child empowerment.pptxFrancesca Gottschalk - How can education support child empowerment.pptx
Francesca Gottschalk - How can education support child empowerment.pptx
EduSkills OECD
 
How to Make a Field invisible in Odoo 17
How to Make a Field invisible in Odoo 17How to Make a Field invisible in Odoo 17
How to Make a Field invisible in Odoo 17
Celine George
 
Phrasal Verbs.XXXXXXXXXXXXXXXXXXXXXXXXXX
Phrasal Verbs.XXXXXXXXXXXXXXXXXXXXXXXXXXPhrasal Verbs.XXXXXXXXXXXXXXXXXXXXXXXXXX
Phrasal Verbs.XXXXXXXXXXXXXXXXXXXXXXXXXX
MIRIAMSALINAS13
 
1.4 modern child centered education - mahatma gandhi-2.pptx
1.4 modern child centered education - mahatma gandhi-2.pptx1.4 modern child centered education - mahatma gandhi-2.pptx
1.4 modern child centered education - mahatma gandhi-2.pptx
JosvitaDsouza2
 
Biological Screening of Herbal Drugs in detailed.
Biological Screening of Herbal Drugs in detailed.Biological Screening of Herbal Drugs in detailed.
Biological Screening of Herbal Drugs in detailed.
Ashokrao Mane college of Pharmacy Peth-Vadgaon
 

Recently uploaded (20)

Chapter 3 - Islamic Banking Products and Services.pptx
Chapter 3 - Islamic Banking Products and Services.pptxChapter 3 - Islamic Banking Products and Services.pptx
Chapter 3 - Islamic Banking Products and Services.pptx
 
Adversarial Attention Modeling for Multi-dimensional Emotion Regression.pdf
Adversarial Attention Modeling for Multi-dimensional Emotion Regression.pdfAdversarial Attention Modeling for Multi-dimensional Emotion Regression.pdf
Adversarial Attention Modeling for Multi-dimensional Emotion Regression.pdf
 
2024.06.01 Introducing a competency framework for languag learning materials ...
2024.06.01 Introducing a competency framework for languag learning materials ...2024.06.01 Introducing a competency framework for languag learning materials ...
2024.06.01 Introducing a competency framework for languag learning materials ...
 
Supporting (UKRI) OA monographs at Salford.pptx
Supporting (UKRI) OA monographs at Salford.pptxSupporting (UKRI) OA monographs at Salford.pptx
Supporting (UKRI) OA monographs at Salford.pptx
 
Guidance_and_Counselling.pdf B.Ed. 4th Semester
Guidance_and_Counselling.pdf B.Ed. 4th SemesterGuidance_and_Counselling.pdf B.Ed. 4th Semester
Guidance_and_Counselling.pdf B.Ed. 4th Semester
 
The Roman Empire A Historical Colossus.pdf
The Roman Empire A Historical Colossus.pdfThe Roman Empire A Historical Colossus.pdf
The Roman Empire A Historical Colossus.pdf
 
How libraries can support authors with open access requirements for UKRI fund...
How libraries can support authors with open access requirements for UKRI fund...How libraries can support authors with open access requirements for UKRI fund...
How libraries can support authors with open access requirements for UKRI fund...
 
Introduction to AI for Nonprofits with Tapp Network
Introduction to AI for Nonprofits with Tapp NetworkIntroduction to AI for Nonprofits with Tapp Network
Introduction to AI for Nonprofits with Tapp Network
 
The Challenger.pdf DNHS Official Publication
The Challenger.pdf DNHS Official PublicationThe Challenger.pdf DNHS Official Publication
The Challenger.pdf DNHS Official Publication
 
Home assignment II on Spectroscopy 2024 Answers.pdf
Home assignment II on Spectroscopy 2024 Answers.pdfHome assignment II on Spectroscopy 2024 Answers.pdf
Home assignment II on Spectroscopy 2024 Answers.pdf
 
aaaaaaaaaaaaaaaaaaaaaaaaaaaaaaaaaaaaaaaaa
aaaaaaaaaaaaaaaaaaaaaaaaaaaaaaaaaaaaaaaaaaaaaaaaaaaaaaaaaaaaaaaaaaaaaaaaaaaaaaaaaa
aaaaaaaaaaaaaaaaaaaaaaaaaaaaaaaaaaaaaaaaa
 
Unit 8 - Information and Communication Technology (Paper I).pdf
Unit 8 - Information and Communication Technology (Paper I).pdfUnit 8 - Information and Communication Technology (Paper I).pdf
Unit 8 - Information and Communication Technology (Paper I).pdf
 
Sha'Carri Richardson Presentation 202345
Sha'Carri Richardson Presentation 202345Sha'Carri Richardson Presentation 202345
Sha'Carri Richardson Presentation 202345
 
Instructions for Submissions thorugh G- Classroom.pptx
Instructions for Submissions thorugh G- Classroom.pptxInstructions for Submissions thorugh G- Classroom.pptx
Instructions for Submissions thorugh G- Classroom.pptx
 
TESDA TM1 REVIEWER FOR NATIONAL ASSESSMENT WRITTEN AND ORAL QUESTIONS WITH A...
TESDA TM1 REVIEWER  FOR NATIONAL ASSESSMENT WRITTEN AND ORAL QUESTIONS WITH A...TESDA TM1 REVIEWER  FOR NATIONAL ASSESSMENT WRITTEN AND ORAL QUESTIONS WITH A...
TESDA TM1 REVIEWER FOR NATIONAL ASSESSMENT WRITTEN AND ORAL QUESTIONS WITH A...
 
Francesca Gottschalk - How can education support child empowerment.pptx
Francesca Gottschalk - How can education support child empowerment.pptxFrancesca Gottschalk - How can education support child empowerment.pptx
Francesca Gottschalk - How can education support child empowerment.pptx
 
How to Make a Field invisible in Odoo 17
How to Make a Field invisible in Odoo 17How to Make a Field invisible in Odoo 17
How to Make a Field invisible in Odoo 17
 
Phrasal Verbs.XXXXXXXXXXXXXXXXXXXXXXXXXX
Phrasal Verbs.XXXXXXXXXXXXXXXXXXXXXXXXXXPhrasal Verbs.XXXXXXXXXXXXXXXXXXXXXXXXXX
Phrasal Verbs.XXXXXXXXXXXXXXXXXXXXXXXXXX
 
1.4 modern child centered education - mahatma gandhi-2.pptx
1.4 modern child centered education - mahatma gandhi-2.pptx1.4 modern child centered education - mahatma gandhi-2.pptx
1.4 modern child centered education - mahatma gandhi-2.pptx
 
Biological Screening of Herbal Drugs in detailed.
Biological Screening of Herbal Drugs in detailed.Biological Screening of Herbal Drugs in detailed.
Biological Screening of Herbal Drugs in detailed.
 

Field Development Project : Gelama Merah

  • 1. Gelama Merah Group 10 Supervisor: Muhammad Aslam B Md Yusof
  • 2. CONTENT INTRODUCTION RESERVOIR ENGINEERING DRILLING ENGINEERING PRODUCTION TECHNOLOGY FACILITY ENGINEERING PROJECT ECONOMICS HEALTH, SAFETY & ENVIRONMENT 1
  • 3. Background & Problem Statement Objectives & Scope of Study Regional Geology, Petrophysics & Volumetric INTRODUCTION 2
  • 4. Project Background Problem Statement Objective The ultimate objective is to produce a reasonable and reliable FDP report that satisfies the needs of high-level management in making decision of the proposed development for Gelama Merah field Scope of Study Reservoir Engineering Drilling Engineering Production Technology Facility Engineering Project Economic Health, Safety & Environment Facing time constraint, limited data and large number of uncertainties, the determination of the best development options has been considered as a tough challenge. Summary Description Block Name SB-18-12 Field Name Gelama Merah Field Location Offshore Sabah, Malaysia Well name GM-1, GM ST-1 Well Type Exploration Lithology Clay stone & Sandstone Field 29727503 m2 Marginal Field Operator Contractor 3
  • 5.
  • 6. REGIONAL GEOLOGY • Sabah can be divided into 3 basins that are characterized by distinct structural styles and sedimentation histories • Sabah Basin • NE Sabah Basin • SE Sabah Basin Sabah Basin • Located in East Baram Delta Province in Sabah Basin • Gelama Merah field located in the West Labuan-Paisley Syncline and identified by a major North-South growth Morris Fault • Deposited in the later part of Middle Miocene sands Gelama Merah Field 4
  • 7. PETROPHYSICS & VOLUMETRIC Contacts Log-Based Method Formation-Pressure Method GOC 1468.7 m TVD 1467.7 m TVD WOC 1498.7 m TVD 1503 m TVD Summary of Deterministic and Probabilistic Methods Comparison of GOC and WOC Oil Zone Deterministic Probabilistic Petrel P10 P50 P90 330 MMSTB 250 MMSTB 485 MMSTB 850 MMSTB 423 MMSTB Gas Zone Deterministic Probabilistic Petrel P10 P50 P90 862 BSCF 678 BSCF 850 BSCF 955 BSCF 955 BSCF 5
  • 8. RESERVOIR ENGINEERING Reservoir Data Review Dynamic Model Setup Reservoir Simulation Sensitivity Study Reservoir Management Plan 6
  • 9. RESERVOIR DATA REVIEW : SUMMARY 7 Information Value Source Oil Rim Thickness 34.3 m Log & MDT Initial Reservoir Pressure 2116 Psia PVT Report Bubble Point Pressure 2028.7 Psia PVT Report Oil Volume Factor 1.17 STB/bbl PVT Report Average Permeability 140 mD DST Analysis Average Porosity 0.27 Log Average Water Saturation 0.36 Log Rock Compressibility 3.22e-6 1/Psia Hall Correlation Table: Gelama Merah Reservoir Data Summary
  • 10. RESERVOIR DATA REVIEW : MDT & PVT 1300.0 1350.0 1400.0 1450.0 1500.0 1550.0 1600.0 2050.0 2100.0 2150.0 2200.0 2250.0 2300.0 RESERVOIRDEPTH,MTVDSS FORMATION PRESSURE, PSIA Formation Pressure GOC = 1468.7 m TVDSS OWC = 1503 m TVDSS 8
  • 11. RESERVOIR DATA REVIEW : RCA & SCAL y = 0.2143x-1.835 R² = 0.7269 0 5 10 15 20 0 0.2 0.4 0.6 0.8 1 J-Function Water Saturation, Fraction J-FUNCTION FOR CORE 1-017, 2-010, 5-002 y = 6E+06x7.8256 R² = 0.7167 0.1 1 10 100 1000 10000 0.1 0.15 0.2 0.25 0.3 0.35 0.4 HorizontalPermeability,mD Porosity, Fraction POROPERM CROSSPLOT GM-ST1 9 0 0.1 0.2 0.3 0.4 0.5 0.6 0.7 0.8 0.9 1 0 0.1 0.2 0.3 0.4 0.5 0.6 0.7 0.8 0.9 1 Kr Sg Gas-Oil Relative Peremability Krg Kro 0 0.1 0.2 0.3 0.4 0.5 0.6 0.7 0.8 0.9 1 0 0.1 0.2 0.3 0.4 0.5 0.6 0.7 0.8 0.9 1 Kr Sw Oil-Water Relative Permeability Krw Kro
  • 12. DYNAMIC MODEL SETUP : UPSCALING Grid Size: 50 x 50 Grid Size: 100 x 100 Grid Size: 200 x 200 Cells Number: 642000 Cells Number: 117660 Cells Number: 16848 CPU Time: 3 – 5 hours CPU Time: 1 – 3 hours CPU Time: 5 – 10 minutes10
  • 13. RESERVOIR SIMULATION: CASES SUMMARY Scenario Case Description Oil RF, % Cumulative Oil, MMSTB Cumulative Water, MMSTB Cumulative Gas, BSCF 1 7 Deviated 11.03 49.106 20.288 1130.109 2 a 2 Horizontal + 1 Deviated 7.31 32.517 0.751 280.398 b 2 Horizontal + 2 Deviated 8.77 39.028 1.599 655.509 c 2 Horizontal + 3 Deviated 10.21 45.433 3.526 855.715 d 2 Horizontal + 4 Deviated 11.41 50.753 4.288 1037.598 e 2 Horizontal + 5 Deviated 12.16 54.096 5.36 1091.203 3 a 3 Horizontal + 1 Deviated 9.25 41.165 1.623 384.976 b 3 Horizontal + 2 Deviated 10.28 45.737 2.172 860.65 c 3 Horizontal + 3 Deviated 11.68 51.961 4.256 1022.928 d 3 Horizontal + 4 Deviated 12.7 56.508 4.558 1111.716 Reservoir Cases Scenario 1: All Deviated Scenario 2: 2 Horizontal + 5 Deviated Scenario 3: 3 Horizontal + 4 Deviated 11
  • 14. RESERVOIR SIMULATION : WELL PLACEMENT & CREAMING CURVE 0 1 2 3 4 5 6 7 8 9 10 11 0 1 2 3 4 5 6 7 8 9 10 11 12 UR,% WELL COUNT Creaming Curve at AOF 0 1 2 3 4 5 6 7 8 9 10 11 12 0 1 2 3 4 5 6 7 8 9 10 11 12 UR,% WELL COUNT Creaming Curve 1520 STB/day ROI RQI 12 P8 P1 P9 P3 GM-1 P5 P6
  • 15. RESERVOIR SIMULATION : WELL BY WELL OIL PRODUCTION PROFILE 0 1000 2000 3000 4000 5000 6000 7000 8000 0 200 400 600 800 1000 1200 1400 1600 1800 2020 2022 2025 2028 2030 2033 2036 2039 CumulativeOil,MSTB OilRate,STB/day Year Well Oil Production Profiles Rate P6 Rate P1 Rate P3 Rate P8 Rate P9 Rate P5 Rate GM1 Cumulative Oil P6 Cumulative Oil P1 Cumulative Oil P3 Cumulative Oil P8 Cumulative Oil P9 Cumulative Oil P5 Cumulative Oil GM1 0 2000 4000 6000 8000 10000 12000 2020 2022 2024 2026 2028 2030 2032 2034 2036 2038 OilRate,STB/day Year Well by Well Contribution - Oil Rate Rate GM1 Rate P5 Rate P9 Rate P8 Rate P3 Rate P1 Rate P6 Year Recovery Period, Year Field Cumulative Oil Production, MMSTB Recovery Factor, % 2025 5 20.9 4.72 2030 10 42.3 9.50 2035 15 47.8 10.82 2040 20 49.1 11.03 13
  • 16. RESERVOIR SIMULATION: WELL BY WELL GAS PRODUCTION PROFILE 0 50000 100000 150000 200000 250000 300000 0 20000 40000 60000 80000 100000 120000 140000 160000 2020 2022 2025 2028 2030 2033 2036 2039 CumulativeGas,MMSCF GasRate,MSCF/day Year Well Gas Production Profiles Rate P6 Rate P1 Rate P3 Rate P8 Rate P9 Rate P5 Rate GM1 Cumulative Gas P6 Cumulative Gas P1 Cumulative Gas P3 Cumulative Gas P8 Cumulative Gas P9 Cumulative Gas P5 Cumulative Gas GM1 0 100000 200000 300000 400000 500000 600000 700000 800000 2020 2022 2024 2026 2028 2030 2032 2034 2036 2038 GasRate,MSCF/day Year Well by Well Contribution - Gas Rate Rate GM1 Rate P5 Rate P9 Rate P8 Rate P3 Rate P1 Rate P6 Year Recovery Period, Year Field Cumulative Gas Production, BSCF Recovery Factor, % 2025 5 100.9 9.10 2030 10 689.9 62.26 2035 15 1094.4 98.90 2040 20 1108.0 100.00 14
  • 17. SENSITIVITY STUDY: Depletion Rate 0 10000 20000 30000 40000 50000 60000 0 5000 10000 15000 20000 25000 01/01/2020 09/27/2022 06/23/2025 03/19/2028 12/14/2030 09/09/2033 06/05/2036 03/02/2039 CumulativeFieldOilProduction,MSTB TotalFieldOilRate,STB/day Year Well Production Rate Sensitivities Rate 1000 Rate 1500 Rate 2000 Rate 2500 Rate 3000 CumOIl 1000 CumOil 1500 CumOil 2000 CumOil 2500 CumOil 3000 0 5 10 15 20 25 0 5000 10000 15000 20000 25000 PlateauPeriodandFieldLife,Year Field Plateau Oil Rate, STB/day Plateau Period and Field Life vs Field Plateau Oil Rate Plateau Period Field Life 15
  • 18. SENSITIVITY STUDY: IOR Gas Injection (Rate: 100 MMSCF/d/well) Water Injection (Rate: 30 MSTB/d/well) Natural Depletion INJECTORS LOCATION 16
  • 19. RESERVOIR MANAGEMENT PLAN Reservoir Management Plan Data Acquisition Oil Rim Development Strategy Coning Mitigation Reservoir Surveillance Concurrent Oil & Gas Development 17
  • 20. Offset Well Analysis Well Trajectory Mud & Cementing Casing Drilling Schedule Drilling Problems & Technology 18 DRILLING ENGINEERING
  • 21. OFFSET WELL ANALYSIS 19 1) GM-1 Well 2) GM ST-1 Well 3) Alab-1 Well Alab-1 field is located 50 km north-east of Labuan and 140 km south-west of Kota Kinabalu. Problems encountered  Pipe stuck  Shallow gas
  • 22. WELL COORDINATES & RIG SELECTION Types of MODUs Water Depth Average Daily Rate, USD Jack-up rig 30 – 500 ft 77,813 - 143,496 Tender Assisted rig Anchor length 44,463 - 117,780 Semi-submersible rig 150 – 6000 ft 300,279 – 396,342 Drill ship/ Large Submersible 1000- 8000 ft 237,900 – 420,324 Figure: Well Coordinates Table: Rig Selection • Jack up rig is chosen. • Platform 1 as mother platform, Platform 2 as an unmanned platform • Water depth : 42.8 m = 140.2ft • 6 deviated wells and 1 vertical well (7 wells) • Well 4 and Well 7 functions as appraisal wells 20
  • 23. WELL TRAJECTORY Figure : Spider Plot for the 7 production wells21
  • 24. MUD WINDOW & CASING DEPTH Type of Casing Depth (Ft-SS) Hole Size Casing Size Conductor casing 0 - 360 Piled case 20" Surface casing 360 - 2170 17.5" 13.375" Production casing 2170 – Target Depth 12.25" 9.625" Figure: Mud Window 22 Seabed – 229.92 ft RT
  • 25. CASING SELECTION, WELL SCHEMATICS & CEMENTING Type of casing OD (inch) Grade Nominal Weight (lb/ft) Collapse Pressure (psi) Internal Yield Pressure (psi) Joint Strength 1000 lbs ID (inch) Connection Type Conductor 20 API 5L X-56 154.0 2140 3680 2540 18.500 XLC-S Surface 13 3/8 J-55 54.5 1130 2730 909 12.615 BTC Production 9 5/8 VAM TOP ( 80 ksi ) 40.0 3080 5750 916 8.75 VAM TOP Casing Type Total Cement Slurry (cu.ft) No of sacks (sk) Mix Water Required (gal) Additive (cu.ft) Surface 25348.739 21301.462 110767.60 5069.74 Production 28541.731 24187.908 125777.12 5708.34 Total 53890.471 45489.370 236544.72 10778.09 Conductercasing 20''piled-360 ft seabed Seabed-229.92 ft RT Surface casing 13 3/8' 360 ft-2170 ft Productionsasing 9 5/8 - 2170ft -TD 17 1/2''Hole 17 1/2''Hole TOCSurface & Productioncasing at seabed Table : Casing selection and grade Table : Well Cementing Figure : Well Schematics 23
  • 26. BIT SELECTION AND DRILLING FLUID Interval Surface Production Hole size (in) 17 1/2 12 ¼ Casing OD (in) 13 3/8 9 5/8 Bit diameter (in) 17 1/2 12 ¼ Depth in (m-RT) 70.1 732 Depth out (m-RT) 732 Target Depth Roller cone bit & PDC bit Depth,TVD- SS (ft) Mud Weight (ppg) Mud design 70.1 – 2170.0 8.7 Seawater Polymer Mud 2170.0 – Target Depth 9.8 WBM - KCL/PHPA Table: Bit Selection Table: Drilling Fluid • WBM is chosen, • OBM and SBM are expensive and mainly for HPHT wells • Shale inhibitor is required : Partially-hydrolyzed Polyacrylamide (PHPA) + KCL • Polycrystalline Diamond Compact bit (PDC) can operate in medium hardness formation and also hydratable sediments; sand and shale. • Economically wise, PDC can’t be used throughout the drilling • Roller cone bits will be used with PDC as the alternative option when rock bit faces high wear rate 24
  • 27. DRILLING SCHEDULE Year 2017 TaskName Startdate TimeTaken Jan Feb Mac April May June July Aug Sept Oct Nov Dec Jan GelamaMerah Platform1 24-Feb-16 5 Well4 1-Mar-16 40 Well1 11-Apr-16 40 Well2 21-May-16 40 Well3 1-Jul-16 10 Platform2 11-Jul-16 10 Well7 21-Jul-16 40 Well5 1-Sep-16 40 Well6 11-Oct-16 40 Demob 21-Nov-16 5 270 2016 Figure: Drilling Schedule 25
  • 28. DRILLING PROBLEMS & TECHNOLOGY Figure: Drilling Schedule 26 Drilling problems are identified from the offset well analysis. Here are the possible problem that may occur: I. Pipe stucking II. Shallow gas III. Lost circulation IV. Kick & Blowout Drilling technology assists the team in overcoming possible drilling problems. Here are some technologies which can be used for the drilling plan. I. Drill Dog™ Electro-Magnetic Measurement While Drilling II. Cement Assurance Tool (CAT) III. Directional Casing While Drilling (DCwD)
  • 29. Well Performance Analysis Production Technology Plan Sensitivity Analysis Well Completion 27 PRODUCTION TECHNOLOGY
  • 30.  PROSPER: Nodal Analysis WELL PERFORMANCE ANALYSIS Figure: Node Locations Figure: PROSPER interface28
  • 31. Figure : IPR at Reservoir Pressure 2116 psia PI : 3.95STB/day/psi AOF : 4724.8STB/Day PRODUCTION TECHNOLOGY PLAN IPR Curve Well Performance Analysis Reservoir pressure 2116 psia Reservoir temperature 155 *F Water cut 0 % Fluid Oil and water Method BLACK OIL GOR 336 scf/stb Oil gravity 27.3 API Gas gravity 0.745 sg Water salinity 30000 ppm H2S 0 mole% CO2 0.62 mole% N2 0.57 mole % 29
  • 32. PRODUCTION TECHNOLOGY PLAN Figure: System analysis Operating Point Rate 1803 STB/d Pressure 1560 psig System Analysis 30
  • 33. Figure: Tubing performance with different water cuts, and @ Pr = 2116psi. OUTFLOW PERFORMANCE PREDICTION W C 0 10 30 40 Tubing diameter (in) Oil rate (Stb/d) Oil rate (Stb/d) Oil rate (Stb/d) Oil rate (Stb/d) 2 1412 1295 930 663 2.75 1800 1596 1041 785 3.5 1881 1648 1015 n/a 4 1881 1622 n/a n/a 4.5 1874 1571 n/a n/a  Sensitivity Analysis: Tubing variance vs water cut 31
  • 34. Figure Tubing performance with water cut = 0, and @ Pr = 1500 psi. Reservoir pressure (psia) 2116 2000 1800 1500 Tubing diameter (in) Oil rate (Stb/d) Oil rate (Stb/d) Oil rate (Stb/d) Oil rate (Stb/d) 2 1412 1172 758 n/a 2.75 1800 1440 827 n/a 3.5 1881 1471 n/a n/a 4 1881 1446 n/a n/a 4.5 1874 1343 n/a n/a Figure: Performance @ Pr 1800 psia. Tubing variance vs reservoir pressure depletion SENSITIVITY ANALYSIS 32
  • 35. Figure 7.10 Tubing performance with different WHP @WC=0%. WHP (psia) 100 300 450 Tubing diameter (in) Oil rate (Stb/d) Oil rate (Stb/d) Oil rate (Stb/d) 2 2064 1485 841 2.75 2908 1931 909 3.5 3317 2036 811 SENSITIVITYANALYSIS: TUBING VARIANCE VS WHP 33
  • 36. Functional Requirement Component Optimize production Tubing Size ID 2.75” Isolate producing zones Packer Emergency containment subsurface controlled sub safety valve (SCSSV) Gas lift valve installation Side pocket mandrel (SPM) Routine down-hole operation Xmas tree Isolation devices that prevent communication between the tubing and the annulus. Dummy valve WELL COMPLETION MATRIX Table : Completion String Components Well Name Type Perforated interval, m Remark P1 Deviated 1502 - 1540 Producer P3 Deviated 1505 - 1534 Producer P5 Deviated 1499 - 1522 Producer P6 Deviated 1468 - 1496 Producer P8 Deviated 1503 - 1519 Producer P9 Deviated 1496 - 1525 Producer GLM Vertical 1521 - 1530 Producer Table : Production Well & Perforation Interval 34
  • 37. WELL COMPLETION MATRIX Figure: Completion Schematic Wellhead equipment that meets API Specification 6A (equivalent to ISO 10423) is available in standard pressure increments: • 13.8 MPa (2000 psi) • 20.7 MPa (3000 psi) • 34.5 MPa (5000 psi) • 69.0 MPa (10,000 psi) • 103.5 MPa (15,000 psi) • 138.0 MPa (20,000 psi) • 207 MPa (30,000 psi) 35
  • 38. Rod pump PCP ESP Gas Lift Artificial Lift • Low operating cost. Compression cost depends on the fuel cost and compressor maintenance. • Suitable for both conditions (gas coned well and water coned well) • Gas lift is believed to have a longer lifespan (10-20 years) Gas Lift Method Justifications ARTIFICIAL LIFT RECOMMENDATION 36
  • 39. • Preference : Continuous Gas lift • Reasons :  High gas-oil ratio (GOR) produced fluid.  High reservoir inflow productivity index.  Use of side pocket mandrels allows easy wireline replacements of gas lift valves.  Sufficient producing gas to be used as injecting gas. ARTIFICIAL LIFT RECOMMENDATION 37
  • 40. ARTIFICIAL LIFT DESIGN  Maximum gas available, which is the amount of gas present in the reservoir  Maximum gas during uploading which the gas each well can handle.  Water cut which was set at 50 % Figure: Gas lift design data selection. 38
  • 41. Figure: Gas lift vales MD proposed by PROSPER Type GLV #1 GLV #2 GLV #1 IPO IPO Orifice Size 1.5 1.5 - Setting Depth, MD P1 760 1233 1489 P3 765 1228 1495 P5 768 1231 1496 P6 750 1235 1490 P8 755 1222 1487 P9 760 1233 1499 Pilot Well, GLM 767.157 1230.43 1494 Gas lift must be installed above production packer ARTIFICIAL LIFT DESIGN 39
  • 42. PRODUCTION PLAN ARTIFICIAL LIFT RECOMMENDATION Figure Performance Curve Injection Gas Rate Lift gas details Injection Rate 3.35 MMscf/d Inject. Pressure 1520 psig Production Rate 1560 STBD W C 0 10 30 40 Tubing diameter (in) Oil rate (Stb/d) Oil rate (Stb/d) Oil rate (Stb/d) Oil rate (Stb/d) 2 1412 1295 930 663 2.75 1800 1596 1041 785 3.5 1881 1648 1015 n/a 4 1881 1622 n/a n/a 4.5 1874 1571 n/a n/a 40
  • 43. Concept Design Extraction Facility Processing Facility Exporting Facility 41 FACILITY ENGINEERING
  • 44. Exporting Processing Extraction Facility *** Main design requirement: Water depth Environmental conditions Number of wells Equipment requirements Life of the field Frequency of human intervention on the platform Interfacing requirements  42.8 m  not very harsh but with alternating monsoon period.  7 deviated wells  Integrated WHP-CPP-LQ in single Jacket  20 years.  24/7  subsea pipeline system 42
  • 45. Location of wells and platforms Topside Structure Schematics Subsea Structure SchematicsEquipment Arrangement plan WHY Jacket?  Support large deck loads  Large field, long term production  Piles result in good stability  Little effect from sea floor scour  Used for production up to 130m water depths  Cheaper 43
  • 46. Dry Tree Wet Tree Advantages  Tree and well control at surface in close proximity of people  Direct vertical access to wells for future intervention activities  Minimal offshore construction  Enable future drilling and expansion - Tree and well access the seabed isolated from people - Full range of gull types can be used - Simplified riser/vessel interfaces - Preferable for deep water installation  Christmas Tree Wellhead and Manifold Conventional Approach Multiport Flow Selector (MPFS) Complex piping arrangement / valves / actuators and controls  Simple piping arrangement with minimum valves Large number of leak points risking production downtime  Reduced leak points Occupies more space and much higher weight  Compact system, reduced space and weight Prone to Human error  Reduced/ minimum human error Expensive  Economical  Manifold 44
  • 47.  Separator Reciprocating Compressor Centrifugal Compressor - Low horsepower (< 2,000 hp) - High-ratio applications - Size up to 10,000 hp - Higher fuel efficiency - Much higher turndown capabilities  High horsepower (>4,000 hp)  For low ratio (<2.5) in 1000 hp  Cheaper  Takes less space  Less weightage  Has higher availability  Lower maintenance costs  Compressor  Gas Lifting Surface Facility Horizontal Vertical Spherical  Can handle much higher GOR  Cheaper than the vertical separator  Easier and cheaper to ship and assemble  greater liquid capacity  Reduces turbulence and reduces foaming, thus it can handle foaming crude - Easier to clean - Save space - Provides better surge control - Liquid level control is not critical - Cheapest - Better clean-out 45
  • 48.  Produced Water Treatment  Gas and Oil Metering system  Flaring and Venting System Multiphase flow meter (MPFM) Simple Design Low maintenance cost Reliability Weight and space reduction ability  Emergency Shutdown System * ESD valves for flowline and pipeline should be located away from facility. 46 * The Flaring system contains of a flare boom linked with pipes to accumulate the gas to be burnt.  Drainage System Open Drains –water from rain, seawater spray. Closed Drains – collects water from process areas, where water is polluted and hazardous
  • 49. Power Generator Type Advantages Gas Turbines  Economic for continuous operation of generators  Tolerant to high ambient conditions and elevations  Low owning and operating costs  Best fuel efficiency  Low emission level  No local fuel storage requirement Diesel Generator Renewable Energy High voltage direct current  Power Generation  Communication Links  Seawater Systems  Helifuel System Link type Advantage Microwave line of sight Low cost equipment, high capacity, high reliability. Troposcatter  High capacity, high reliability, no delay, no recurring monthly costs, distance 30-250 km. Fresh water system - Vapour Vacuum Compression (VVC) distillation Cooling system for generators, ventilation, and air conditioning Washing facilities - the treatment for water from kitchen, showers and toilets before being discharged to sea. Bilge system is a pump system that is used to prevent from flooding of machinery spaces and pump rooms. Fixed fire fighting system: fire main and helideck foam systems * Fuel filter * Flow meter * Hose reels with dispensing nozzles * Electric bonding and spill containment foam based fire fighting system  Sand Separation System * The sand that separated from hydrocarbon fluids should be removed and transported ashore for disposal. 47
  • 50. Pipeline System: safe, high efficiency for oil transmission, wide transmission capacity, high economic profit for long life field. Petronas’s Samarang (1975) oil field with 6- in. OD natural gas pipeline and 8-in. OD crude oil pipeline. Pipeline Flow Assurance: Hydrate formation Maintain system operating pressure lower than hydrate formation threshold Corrosion Protection System: Internal Protection External Protection Cathodic protection DC current through metal Corrosion inhibitors Pigging debris Location of GM and Samarang fields 48
  • 51. 49 Revenue Over Cost PSC Fiscal Terms Economic Assumptions Development Options Economic Analysis PROJECT ECONOMICS
  • 52. REVENUE OVER COST PSC (1997) • Encourage additional investment in Malaysia’s small/marginal oil and gas discoveries • Allows contractors to accelerate their cost recovery if they perform within certain cost targets • Allow contractor to own higher share of profit when their profitability is low • Increase NOC’s share of profit when the contractor’s profitability improves • Essentially a self-adjusting formula of = Cumulative Revenue Cumulative Cost 50 Gross Revenue Profit Split Contractor : NOC (Depends on R/C) Cost Ceiling (Depends on R/C) Government Cash Flow Petroleum Income Tax 38% Royalty 10% Petroleum Income Tax 38% Cost Ceiling Contractor’s Profit Contractor Cash Flow NOC Cash Flow NOC Profit
  • 53. FISCAL TERMS Contractor’s R/C Index Cost Ceiling (%) Profit Ratio (%) Below THV NOC : Contractor Above THV NOC : Contractor 0.0 < R/C <= 1.0 70 20 : 80 60 : 40 1.0 < R/C <= 1.4 60 30 : 70 70 : 30 1.4 < R/C <= 2.0 50 40 : 60 70 : 30 2.0 < R/C <= 2.5 30 50 : 50 70 : 30 2.5 < R/C <= 3.0 30 60 : 40 70 : 30 R/C > 3.0 30 70 : 30 90 : 10 Note: Oil THV (30 MMSTB) and Gas THV (750 BSCF) Terms Details Royalty 10% Export Duty 10% Petroleum Income Tax 38% Contract Period: Exploration Development Production 3 years 4 years 20 years Research Cess 0.5% (Not inclusive in Cost Oil) Cost Ceiling Sliding Scale (Up to 70%) Profit Sharing R/C Index (Max 70%) NOC Participation Min 15% Supplementary Payment 70% 51 Table: Fiscal Terms Table: R/C Index
  • 54. ECONOMIC ASSUMPTIONS Fiscal Terms Export Duty, Research Cess and NOC Participation was not taken into account. Reference Year The year of evaluation is 2016. First Oil The first oil to be produced from Gelama Merah is expected to be in 2020. Production Period A production period of 20 years is expected with a plateau of approximately 10642 stb/day for the first 10 years and then declining. Decommissioning Year Decommissioning period will be after 20 years of production period in 2039. Oil and Gas Price The oil and gas price is assumed to be $60/bbl and $4/mscf respectively based on previous oil crash trends. OPEX The base OPEX is obtained to be approximately $6.35 million/year but will increase based on the requirement for gas lift and produced water treatment. Compounding Factor An escalation of 2.5% per annum is assumed to account for the inflation rate. Discount Rate Assumed to be 10% WACC during the evaluation according to the opportunity cost of capital, acquisition cost of capital and risk management. 52
  • 55. DEVELOPMENT OPTIONS Criteria Unit Option 1 Option 2 Option 3 Cumulative Oil MMSTB 49.08 54.03 56.45 Cumulative Gas TSCF 1.13 1.09 1.11 Cumulative Water MMSTB 20.21 5.28 4.52 CAPEX $MM 247.75 290.75 301.75 NPV @ 10% $MM 564.71 406.11 392.94 IRR % 47 28 28 Payout Period Years 2.19 3.74 3.79 PIR Ratio 6.02 5.31 4.79 Drilling Option  Option 1: 7 Deviated wells  Option 2: 5 Deviated and 2 horizontal wells  Option 3: 4 Deviated and 3 horizontal wells Facility Option  Option 1: Tie-in pipeline to Samarang pipeline  Option 2: Pipeline to LCOT Criteria Unit Option 1 Option 2 CAPEX $MM 247.75 289.51 NPV @ 10% $MM 564.71 552.19 IRR % 47 41 Payout Period Years 2.19 2.48 PIR Ratio 6.02 5.05 53
  • 56. ECONOMIC ANALYSIS -250 -50 150 350 550 750 950 1150 1350 2016 2017 2018 2019 2020 2021 2022 2023 2024 2025 2026 2027 2028 2029 2030 2031 2032 2033 2034 2035 2036 2037 2038 2039 CashFlow($MM) Cash Flow Profile Net Cash Flow Cumulative Cash Flow Development AbandonmentProduction Project Starts 2016 Project Ends 2039 1st Production in 2020 Payout Period = 6.19 years PIR = $ 𝟏𝟑𝟐𝟔 𝐦𝐢𝐥𝐥𝐢𝐨𝐧 $ 𝟐𝟐𝟎 𝐦𝐢𝐥𝐥𝐢𝐨𝐧 = 6.02 Maximum Capital Outlay = $ 220 million Breakeven Terminal Cash Plus = $ 1326 million Year Net Cash Flow ($MM) Cumulative Cash Flow ($MM) 2016 -73.5 -73.5 2017 -82.24 -155.74 2018 -52.4 -208.14 2019 -12.28 -220.42 2020 120.703 -99.717 2021 78.9047 -20.812 2022 111.403 90.5909 2023 109.72 200.311 2024 85.6383 285.949 2025 53.0546 339.004 2026 122.462 461.466 2027 77.6566 539.123 2028 120.815 659.938 2029 165.752 825.689 2030 202.998 1028.69 2031 100.727 1129.41 2032 67.7283 1197.14 2033 46.5664 1243.71 2034 37.2602 1280.97 2035 33.5185 1314.49 2036 13.5407 1328.03 2037 11.2728 1339.3 2038 5.49916 1344.8 2039 -18.36 1326.44 54
  • 57. ECONOMIC ANALYSIS Discount Rate (%) Unit 0 5 10 15 20 25 30 35 40 45 50 55 60 65 70 75 80 85 90 95 100 NPV $MM 1326 852 565 382 260 176 115 70 35 8 -14 -32 -47 -60 -71 -81 -89 -97 -103 -109 -114 -200 0 200 400 600 800 1000 1200 1400 0 5 10 15 20 25 30 35 40 45 50 55 60 65 70 75 80 85 90 95 100 NPV($MM) Discount Rate (%) NPV vs Discount Rate IRR = 47% WACC = 10% 55
  • 58. ECONOMIC ANALYSIS 250 350 450 550 650 750 850 -90% -75% -60% -45% -30% -15% 0 15% 30% 45% 60% 75% 90% NPV@10%($MM) Spider Plot Oil Production Oil Price CAPEX OPEX Gas Production Gas Price Tornado Plot 0% 100%-100% Gas Price Gas Production Oil Price Oil Production CAPEX OPEX 56 Parameter NPV @ 10% ($MM) -90% -75% -60% -45% -30% -15% 0 15% 30% 45% 60% 75% 90% OPEX 579 577 575 573 571 568 565 562 560 557 556 553 551 CAPEX 618 609 606 605 592 580 565 549 532 514 495 476 457 Oil Production 297 354 413 468 513 546 565 583 621 641 677 681 713 Oil Price 295 342 390 434 478 522 565 607 649 687 727 767 806 Gas Production 280 343 401 457 511 521 565 568 604 642 628 661 694 Gas Price 274 323 374 418 466 515 565 614 664 712 761 809 858 Table: Sensitivity Parameters
  • 59. HSE Development Plant HSE Management System Abandonment 57 HEALTH, SAFETY & ENVIRONMENT
  • 60. Objectives:  To minimize any negative impact that may occur  To reach the highest possible level of safety  To protect its employees, contractors, customers and local surrounding HEALTH, SAFETY AND ENVIRONMENT 58  Safety precaution when conducting exploration, development and abandonment
  • 61. Example of HSE plan • PETRONAS Health, Safety & Environment Management System (HSEMS) • Comply to PETRONAS Regulatory • Any negligence or deviation should be justified. HSE DEVELOPMENT PLAN 59
  • 62. Before Exploration • Secure the area • Risk assessment • Selection of contractor and equipment During Exploration • Periodic inspection • HSE Training Programme • Cultivate awareness • Practice emergency drill Development • Risk assessment • Determine treatment system Production • System selection to control flow rate • Pipeline inspection for corrosion purpose Abandonment • Determine depth to plug the well • Inspection of any contamination • Recycle/dispose equipment HSE DEVELOPMENT PLAN 60
  • 63. 1 • HSE Policy and Strategy Objective 2 • Organization 3 • Arrangement 4 • Risk Management 5 • Planning and Procedure 6 • Implementation and Performance Monitoring HSE MANAGEMENT SYSTEM Figure : HSE Management System 61
  • 64. ABANDONMENT • Comply with minimum requirement for Plug and Abandonment(P&A) • Plug must be verified by the particular engineer that in charge for particular well • Well P&A programme and suspension should be submitted to PETRONAS for approval 62 Perforate