Downloaded 112 times
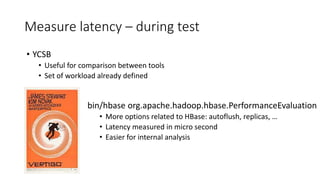
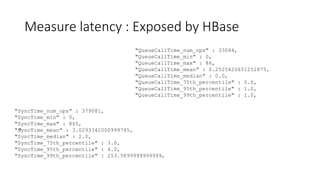
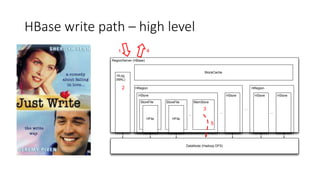
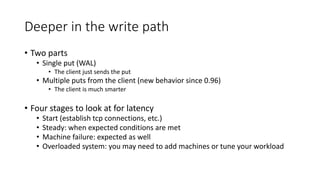


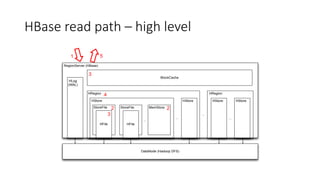
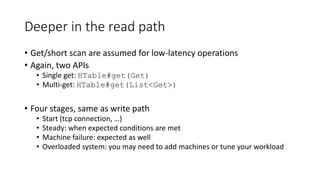
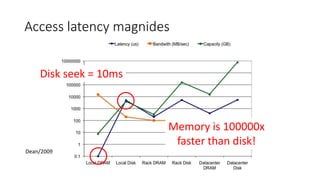
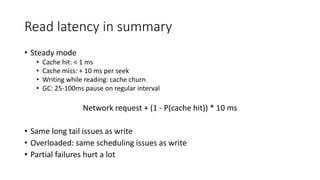

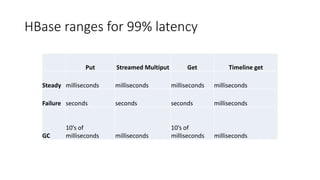


This document summarizes a presentation about optimizing for low latency in HBase. It discusses how to measure latency, the write and read paths in HBase, sources of latency like garbage collection and compactions, and techniques for reducing latency like streaming puts, block caching, and timeline consistency. The key points are that single puts can achieve millisecond latency while garbage collection and machine failures can cause pauses of 10s of milliseconds to seconds, and optimizing for the "magical 1%" of requests after the 99th percentile is important to improve average latency.


![谷歌留痕技术教程[ 𝙩𝙤𝙥 𝟮𝟯𝟯. 𝙘 𝙤𝙢 ]](https://cdn.slidesharecdn.com/ss_thumbnails/top233-260130173900-2eb784f9-thumbnail.jpg?width=640&height=640&fit=bounds)


