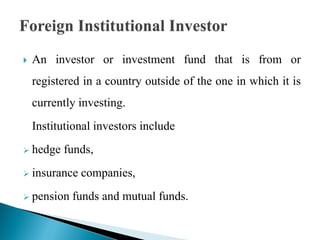
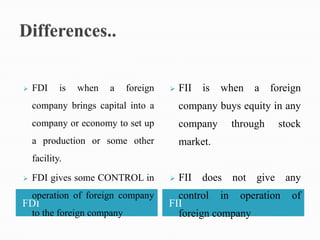
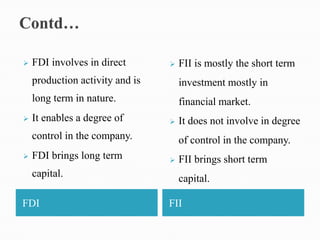
-Jonty Mohta
IIPM- Ahmedabad
(UGP/09-12)
GDP (IN Rs crore)
                      GDP (IN Rs crore)

                                                    6164178
                                          5574449
                              4947857
                    4283979
          3706473
3239224


2004-05   2005-06   2006-07   2007-08     2008-09   2009-10
GDP Growth Rate (in %)


          9.5     9.7
                             9.2

  6.9                                          7.2
                                         6.7


2004-05 2005-06 2006-07 2007-08 2008-09 2009-10
Chart Title
                 Inflation (WPI)     Inflation (CPI )
                                                               11.4

                                                      9.1
                                                8.4
6.5                          6.7         6.2
                       5.4
            4.4 4.4                4.7
      3.8

                                                            1.6


2004-05     2005-06   2006-07      2007-08     2008-09      2009-10
Chart Title
           Exports (US$ Mn.)     Imports (US$ Mn.)

                                           307651
                                257629

                     190670              189001        193820
            157056         166162
   118908105152   128888                             117580
85,206


2004-05   2005-06   2006-07    2007-08    2008-09     2009-10
Trade Balance (US$ Mn.)
     0
          2004-05   2005-06   2006-07   2007-08   2008-09   2009-10


 -20000


 -40000


 -60000

                                                                      Trade Balance (US$ Mn.)

 -80000


-100000


-120000


-140000
Foreign direct investment is that investment, which is made to serve the
business interests of the investor in a company, which is in a different
nation distinct from the investor's country of origin.


The parent enterprise through its foreign direct investment effort seeks
to exercise substantial “Control” over the foreign affiliate company.


Exp. - An American company taking a majority stake in a company in
India.
1) By Direction
     Inward
     Outward
 2) By Target
     Mergers and Acquisitions
     Horizontal FDI
     Vertical FDI
3 )By Motive
    Resource-Seeking

    Market-Seeking

    Efficiency-Seeking
Available Financial Instruments

Equity Shares, Compulsorily Convertible Preference
Shares and compulsorily Convertible Debentures.

Not Available to Investors who are

Citizens of Pakistan OR Entities of Pakistan

Available with approval of FIPB (AP (DIR) No.22
dt.19/12/2007)

To Citizens & Entities of Bangladesh
   Financial incentives (Funds from local Government)
   Fiscal incentives (Exemption from import duties)
   Indirect incentives (Provides land and other resources)
   Political stability
   Market potential & accessibility
   Large economy
   Market size
FDI
                            Amount in US bn $        %age growth over
                                                                        29.89
                                                                                   27.92

                                                           22.08


                                                 8.96
          6.13                         6.05
4.03                5.04   4.32
          52.10%                                   146.40%
                                        40.00%48.10%     35.40%
FY 2001   FY 2002
                    -17.90% 2004 FY 2005
                    FY 2003
                            -14.20%
                            FY                   FY 2006     FY 2007     FY 2008   FY 2009 (till
                                                                                      dec.)
Rank   Country       Total 2000 to   % of
                     2009            Total of all
                                     Countries
1.     Mauritius     39,379          44
2.     Singapore     8,071           9
3.     U.S.A         6,508           7
4.     U.K           5,289           6
5.     Netherlands   3,701           4
5.     Cyprus        2,579           3
6.     Germany       2,379           3
7.     France        1,233           1
CONTRIBUTION IN FDI (in %)
MAURITIUS          SINGAPORE      U.S.A.
U.K.               JAPAN          NETHERLANDS
CYPRUS             OTHERS


                  22%
                            44%
           4%

         4% 4%

             5%
                  8%        9%
Investing in India – Entry Routes
                         Investing in India


                                      Prior Permission
   Automatic Route
                                           (FIPB)

 General rule                      By exception
 No prior permission               Prior Government
 required                          Approval needed
 Only information to the
 Reserve Bank of India             Decision generally
 within 15 days of inflow/         Within 4-6 weeks
 Issue of shares
Sector/Activity          FDI Cap/Equity          Entry Route
Airports                 100%                    Automatic
Construction
                         100%                    Automatic
Development
Petroleum & Natural
Gas
                         26%     (For      PSUs) FIPB
(b) Refining             100%        (    Private Automatic
                         companies)
Other than Refining      100%                    Automatic
Telecommunication
Basic and                74%                     Automatic up to 49%
cellular;STD/ISD
Manufacture of telecom
                         100%                    Automatic
equipment
Power ( Except Atomic
energy); regulations
transmission,
distribution and Power
Ranks   Sector       2006-       2007-       2007-       2007-       Cum          % of
                                                                     Inflows
                     07          08          08          08          Till
                                                                                  total
                     (Apr-       (Apr-       (Apr-       (Apr-       Nov09        Inflows
                     Mar)        Mar)        Mar)        Mar)

1.      SERVICES       21,047      26,589      28,411      16,566       101,019    22 %
        SECTOR         (4,664)     (6,615)     (6,116)     (3,438)     (22,687)
        (fin& non-
        financial)
2.      COMPUT.        11,786       5,623       7,329       2,763        42,259     9%
        SOFT &         (2,614)     (1,410)     (1,677)      (575)       (9,529)
        HARD.
3.      TELE            2,155       5,103      11,727      10,811        39,179     8%
        COMMUN          (478)      (1,261)     (2,558)     (2,223)      (8,600)
        ICATIONS
4.      HOUSING         2,121        8,749     12,621      10,565       34,348      7%
        & REAL          (467)      (2,179)     (2,801)     (2,189)      (7,701)
        ESTATE
5.      CONSTRU         4,424        6,989       8,792       8,380      30,557      7%
        CTION           (985)      (1,743)     (2,028)     (1,754)      (6,945)
        (inroads &
 Economic growth
 Trade
 Employment and skill levels
 Technology diffusion and knowledge transfer
 Linkages and spillover to domestic firms
 Improved technology.
 Management expertise.
 Access to international markets
       Gambling and betting

       Lottery Business

       Atomic Energy

       Retail Trading

      Agricultural or plantation activities of
    Agriculture

    (excluding  Floriculture, Horticulture, Development of Seeds, Animal
    Husbandry, Pisiculture and Cultivation of Vegetables, Mushrooms
    etc., under controlled conditions and services related to agro and
    allied sectors) and Plantations other than Tea Plantations)
   An investor or investment fund that is from or
    registered in a country outside of the one in which it is
    currently investing.
    Institutional investors include
   hedge funds,
   insurance companies,
   pension funds and mutual funds.
Pension Funds
Mutual Funds
Insurance Companies
Investment Trusts
Banks
Endowments
Foundations
Charitable Trusts / Charitable Societies
Applicant’s track record, professional competence, financial
 soundness, experience,
 general reputation of fairness and integrity. (The applicant
 should have been in existence for at least one year)

whether the applicant is registered with and
 regulated by an appropriate Foreign Regulatory
 Authority in the same capacity in which the application is
 filed with SEBI

Whether the applicant is a fit & proper person.
Chart Title
             100000

              80000

              60000

              40000
Axis Title


                                                                                     YEAR
              20000
                                                                                     FII in Rs Cr.
                  0
                      2001

                             2002

                                    2003

                                           2004

                                                  2005

                                                         2006

                                                                2007

                                                                       2008

                                                                              2009
             -20000

             -40000

             -60000
25000


20000


15000
            FII

10000


 5000

           Sensex
    0


 -5000

         Exchange Ra
-10000


-15000
Foreign Institutional Investor
• Foreign Institutional Investors can individually
  purchase up to 10% and collectively up to 24% of
  the paid up share capital of any company.
• This limit of 24% can be increased to sectoral cap/
  statutory limit applicable to the Indian company by
  passing Board or shareholder resolution.
• FIIs can purchase shares through open offer/ private
  placement/ stock exchange.
• shares purchased by FII through stock exchange
  can’t be sold through a private arrangement.
   Unavailability of Corporate      Problem of inflation

    Debt                             Reduces flexibility of Policy
                                      makers
   Increase Forex Reserve
                                     Hot Money
   Increase Domestic Savings
                                     False     representation       of
    and Investments
                                      Economy
Large Availability of Capital       Can’t be used for long term
Advantages                        Disadvantages
                                     Problems for small investors
   FDI     is   when   a    foreign      FII   is   when   a   foreign
    company brings capital into a          company buys equity in any
    company or economy to set up           company     through    stock
    a production or some other             market.
    facility.
   FDI gives some CONTROL in             FII does not give any
    operation of foreign company         control in operation        of
FDI                                    FII
    to the foreign company               foreign company
   FDI involves in direct          FII is mostly the short term
    production activity and is       investment mostly in
    long term in nature.             financial market.
   It enables a degree of          It does not involve in degree
    control in the company.          of control in the company.
   FDI brings long term            FII brings short term
    capital.                         capital.

FDI                              FII
   www.ibef.org
   www.imf.org
   www.rbi.org.in
   www.tradechakra.com
   www.tradingeconomy.com
Fdi & Fii  Final

Fdi & Fii Final

  • 1.
  • 2.
    GDP (IN Rscrore) GDP (IN Rs crore) 6164178 5574449 4947857 4283979 3706473 3239224 2004-05 2005-06 2006-07 2007-08 2008-09 2009-10
  • 3.
    GDP Growth Rate(in %) 9.5 9.7 9.2 6.9 7.2 6.7 2004-05 2005-06 2006-07 2007-08 2008-09 2009-10
  • 4.
    Chart Title Inflation (WPI) Inflation (CPI ) 11.4 9.1 8.4 6.5 6.7 6.2 5.4 4.4 4.4 4.7 3.8 1.6 2004-05 2005-06 2006-07 2007-08 2008-09 2009-10
  • 5.
    Chart Title Exports (US$ Mn.) Imports (US$ Mn.) 307651 257629 190670 189001 193820 157056 166162 118908105152 128888 117580 85,206 2004-05 2005-06 2006-07 2007-08 2008-09 2009-10
  • 6.
    Trade Balance (US$Mn.) 0 2004-05 2005-06 2006-07 2007-08 2008-09 2009-10 -20000 -40000 -60000 Trade Balance (US$ Mn.) -80000 -100000 -120000 -140000
  • 7.
    Foreign direct investmentis that investment, which is made to serve the business interests of the investor in a company, which is in a different nation distinct from the investor's country of origin. The parent enterprise through its foreign direct investment effort seeks to exercise substantial “Control” over the foreign affiliate company. Exp. - An American company taking a majority stake in a company in India.
  • 8.
    1) By Direction  Inward  Outward 2) By Target  Mergers and Acquisitions  Horizontal FDI  Vertical FDI 3 )By Motive  Resource-Seeking  Market-Seeking  Efficiency-Seeking
  • 9.
    Available Financial Instruments EquityShares, Compulsorily Convertible Preference Shares and compulsorily Convertible Debentures. Not Available to Investors who are Citizens of Pakistan OR Entities of Pakistan Available with approval of FIPB (AP (DIR) No.22 dt.19/12/2007) To Citizens & Entities of Bangladesh
  • 10.
    Financial incentives (Funds from local Government)  Fiscal incentives (Exemption from import duties)  Indirect incentives (Provides land and other resources)  Political stability  Market potential & accessibility  Large economy  Market size
  • 11.
    FDI Amount in US bn $ %age growth over 29.89 27.92 22.08 8.96 6.13 6.05 4.03 5.04 4.32 52.10% 146.40% 40.00%48.10% 35.40% FY 2001 FY 2002 -17.90% 2004 FY 2005 FY 2003 -14.20% FY FY 2006 FY 2007 FY 2008 FY 2009 (till dec.)
  • 12.
    Rank Country Total 2000 to % of 2009 Total of all Countries 1. Mauritius 39,379 44 2. Singapore 8,071 9 3. U.S.A 6,508 7 4. U.K 5,289 6 5. Netherlands 3,701 4 5. Cyprus 2,579 3 6. Germany 2,379 3 7. France 1,233 1
  • 13.
    CONTRIBUTION IN FDI(in %) MAURITIUS SINGAPORE U.S.A. U.K. JAPAN NETHERLANDS CYPRUS OTHERS 22% 44% 4% 4% 4% 5% 8% 9%
  • 14.
    Investing in India– Entry Routes Investing in India Prior Permission Automatic Route (FIPB) General rule By exception No prior permission Prior Government required Approval needed Only information to the Reserve Bank of India Decision generally within 15 days of inflow/ Within 4-6 weeks Issue of shares
  • 15.
    Sector/Activity FDI Cap/Equity Entry Route Airports 100% Automatic Construction 100% Automatic Development Petroleum & Natural Gas 26% (For PSUs) FIPB (b) Refining 100% ( Private Automatic companies) Other than Refining 100% Automatic Telecommunication Basic and 74% Automatic up to 49% cellular;STD/ISD Manufacture of telecom 100% Automatic equipment Power ( Except Atomic energy); regulations transmission, distribution and Power
  • 16.
    Ranks Sector 2006- 2007- 2007- 2007- Cum % of Inflows 07 08 08 08 Till total (Apr- (Apr- (Apr- (Apr- Nov09 Inflows Mar) Mar) Mar) Mar) 1. SERVICES 21,047 26,589 28,411 16,566 101,019 22 % SECTOR (4,664) (6,615) (6,116) (3,438) (22,687) (fin& non- financial) 2. COMPUT. 11,786 5,623 7,329 2,763 42,259 9% SOFT & (2,614) (1,410) (1,677) (575) (9,529) HARD. 3. TELE 2,155 5,103 11,727 10,811 39,179 8% COMMUN (478) (1,261) (2,558) (2,223) (8,600) ICATIONS 4. HOUSING 2,121 8,749 12,621 10,565 34,348 7% & REAL (467) (2,179) (2,801) (2,189) (7,701) ESTATE 5. CONSTRU 4,424 6,989 8,792 8,380 30,557 7% CTION (985) (1,743) (2,028) (1,754) (6,945) (inroads &
  • 17.
     Economic growth Trade  Employment and skill levels  Technology diffusion and knowledge transfer  Linkages and spillover to domestic firms  Improved technology.  Management expertise.  Access to international markets
  • 18.
    Gambling and betting  Lottery Business  Atomic Energy  Retail Trading  Agricultural or plantation activities of Agriculture (excluding Floriculture, Horticulture, Development of Seeds, Animal Husbandry, Pisiculture and Cultivation of Vegetables, Mushrooms etc., under controlled conditions and services related to agro and allied sectors) and Plantations other than Tea Plantations)
  • 19.
    An investor or investment fund that is from or registered in a country outside of the one in which it is currently investing. Institutional investors include  hedge funds,  insurance companies,  pension funds and mutual funds.
  • 20.
    Pension Funds Mutual Funds InsuranceCompanies Investment Trusts Banks Endowments Foundations Charitable Trusts / Charitable Societies
  • 21.
    Applicant’s track record,professional competence, financial soundness, experience, general reputation of fairness and integrity. (The applicant should have been in existence for at least one year) whether the applicant is registered with and regulated by an appropriate Foreign Regulatory Authority in the same capacity in which the application is filed with SEBI Whether the applicant is a fit & proper person.
  • 23.
    Chart Title 100000 80000 60000 40000 Axis Title YEAR 20000 FII in Rs Cr. 0 2001 2002 2003 2004 2005 2006 2007 2008 2009 -20000 -40000 -60000
  • 24.
    25000 20000 15000 FII 10000 5000 Sensex 0 -5000 Exchange Ra -10000 -15000
  • 25.
    Foreign Institutional Investor •Foreign Institutional Investors can individually purchase up to 10% and collectively up to 24% of the paid up share capital of any company. • This limit of 24% can be increased to sectoral cap/ statutory limit applicable to the Indian company by passing Board or shareholder resolution. • FIIs can purchase shares through open offer/ private placement/ stock exchange. • shares purchased by FII through stock exchange can’t be sold through a private arrangement.
  • 26.
    Unavailability of Corporate  Problem of inflation Debt  Reduces flexibility of Policy makers  Increase Forex Reserve  Hot Money  Increase Domestic Savings  False representation of and Investments Economy Large Availability of Capital  Can’t be used for long term Advantages Disadvantages  Problems for small investors
  • 27.
    FDI is when a foreign  FII is when a foreign company brings capital into a company buys equity in any company or economy to set up company through stock a production or some other market. facility.  FDI gives some CONTROL in  FII does not give any operation of foreign company control in operation of FDI FII to the foreign company foreign company
  • 28.
    FDI involves in direct  FII is mostly the short term production activity and is investment mostly in long term in nature. financial market.  It enables a degree of  It does not involve in degree control in the company. of control in the company.  FDI brings long term  FII brings short term capital. capital. FDI FII
  • 29.
    www.ibef.org  www.imf.org  www.rbi.org.in  www.tradechakra.com  www.tradingeconomy.com