Downloaded 425 times


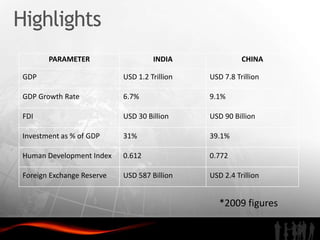
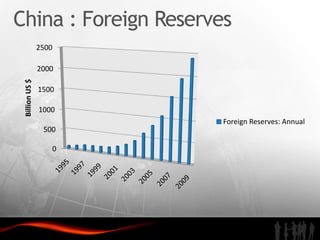
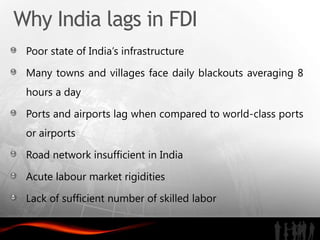


The document analyzes investment trends and policies in India. It finds that while domestic investment is rising due to government stimulus measures, public and private savings are not high enough. Foreign direct investment has grown steadily since the 1990s reforms, reaching $30 billion in 2009-2010, though India still lags China in FDI and infrastructure development. The document recommends improving infrastructure, developing skilled labor, enhancing special economic zones, strengthening intellectual property rights protection, and better coordinating central and state investment policies to attract more high-quality foreign investment to India.


