Downloaded 666 times


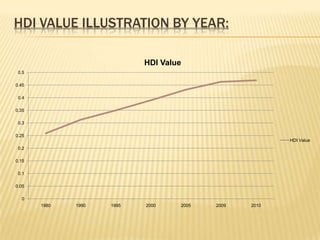
![GDP AND GNI RELATED DATA OF LAST FIVE
FISCAL YEARS:
GDP data 2006-07 2007-08 2008-09 2009-10 2010-11
(p*)
GDP (bn taka) 4,724.77 5,458.22 6,147.95 6,943.20 7875.00
GNI* (bn taka) 5,077.52 5,942.12 6,706.96 7,589.28 8528.22
Per capita GDP 33607 38330 42628 47536 53236
(in taka)
Per capita GNI 36116 41728 46504 51959 57652
(in taka)
Per capita GDP 487 559 620 687 755
(in US$)
Per capita GNI 523 608 676 751 818
(in US$)
Table 1: GDP & GNI data of last five fiscal years.
*P=provisional
GNI=Gross National Income
[Source: Bangladesh Economic Review-2011 (Bangla version), Ministry of Finance.]](https://image.slidesharecdn.com/fdiinbangladeshproblemsprospects-120124115003-phpapp01/85/Fdi-in-bangladesh-problems-prospects-4-320.jpg)
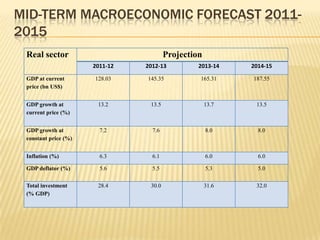
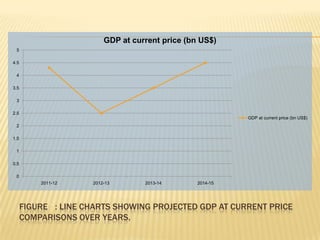
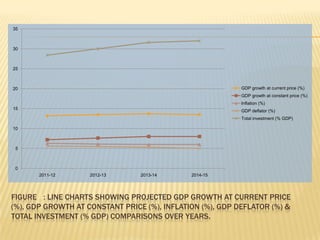


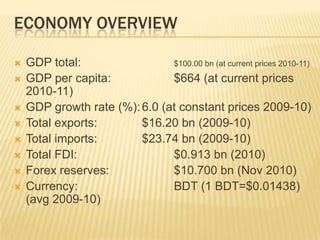
The presentation on Foreign Direct Investment (FDI) in Bangladesh outlines the economic overview, including GDP growth, investment trends, and key sectors for foreign investment. It discusses challenges such as complicated bureaucracy, political unrest, and infrastructure issues that hinder FDI, as well as suggests recommendations for improvement. Special incentives in Export Processing Zones (EPZs) are also highlighted to attract businesses.


![Georgian Banking Sector And Tbc Bank 2011 Q2[1]](https://cdn.slidesharecdn.com/ss_thumbnails/georgianbankingsectorandtbcbank2011q21-13209588990638-phpapp01-111110150353-phpapp01-thumbnail.jpg?width=640&height=640&fit=bounds)


