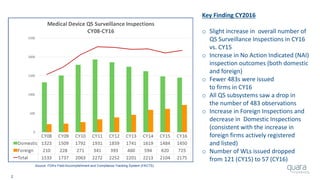
The document provides an overview of FDA inspection trends, focusing on quality metrics and regulatory solutions in the medical device sector. It outlines historical data on FDA-483 observations, inspection outcomes, and the initiative for improving device quality through metrics and data transparency. The 'Case for Quality' initiative aims to shift the focus from compliance to proactive measures for enhancing product quality and patient safety.

![11
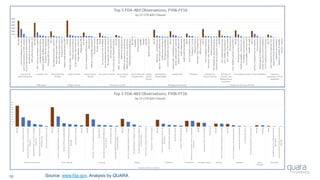
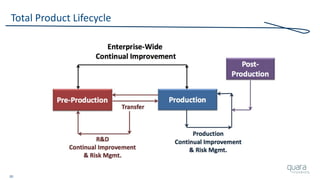
Most Frequently Cited 483 Observations (FY06 – FY16)
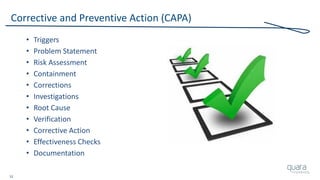
1) Procedures for Corrective and Preventive Action have not been
[adequately] established. Specifically, ***
2) Procedures for receiving, reviewing, and evaluating Complaints by a formally
designated unit have not been [adequately] established. Specifically,***
3) Written MDR procedures have not been [developed]
[maintained] [implemented]. Specifically, ***
4) Corrective and Preventive Action activities and/or results
have not been [adequately] documented. Specifically, ***
5) A Process whose results cannot be fully verified by subsequent inspection and
test has not been [adequately] Validated according to established procedures.
Specifically, ***
Source: FY06-16 Inspectional Observations](https://image.slidesharecdn.com/omtec-2017-fda-inspections-metrics-170619155335/85/FDA-Update-Inspections-Observations-and-Metrics-OMTEC-2017-12-320.jpg)
![23
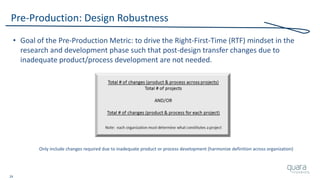
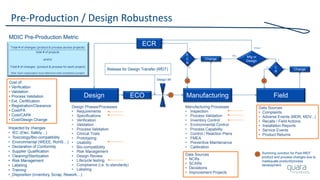
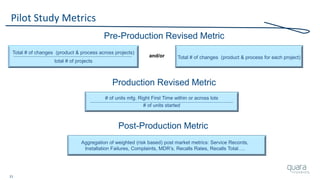
Total Product Lifecycle
• This process [approach] can be used to identify ways to
measure previously untracked areas of quality and/or risk
• Assess which critical requirements the metric is correlated to,
in order to be sure it has the potential to be effective
• Be sure to assess the usefulness of the metric over time
– Is it a flat-line result over time?
– Are any decisions or actions ever taken as a result of tracking?
– Has the metric demonstrated acceptable improvement and steady-state?
– Is unacceptable quality and/or risk experienced even though
this metric is consistently acceptable?
Source: MDIC Case for Quality, Metrics](https://image.slidesharecdn.com/omtec-2017-fda-inspections-metrics-170619155335/85/FDA-Update-Inspections-Observations-and-Metrics-OMTEC-2017-24-320.jpg)