Download to read offline
![IOSR Journal of Mechanical and Civil Engineering (IOSR-JMCE)
e-ISSN: 2278-1684,p-ISSN: 2320-334X, Volume 12, Issue 2 Ver. VII (Mar - Apr. 2015), PP 48-53
www.iosrjournals.org
DOI: 10.9790/1684-12274853 www.iosrjournals.org 48 | Page
Performance of RC Beam Column Connections Subjected to
Cyclic Loading
Minakshi Vaghani 1
, Dr. S.A. Vasanwala 2
, Dr. A.K. Desai 3
1
(Civil Engineering Department, Sarvajanik College of Engineering & Technology, Surat – 1, India)
2,3.
(Applied Mechanics Department, SVNIT, Surat- 1, India)
Abstract : Structures and lifelines designed for typical loading are often badly damaged or can collapse during
earthquakes. The observations from recent earthquakes show that many RC structures have failed in the brittle
behaviour of beam-column connections due to the deficiency of seismic details in the joint regions. Joint shear
failures have been observed recently in many existing RC structures subjected to severe earthquake loadings. In
this study, RC beam column specimen was casted and tested for excitation of cyclic loading. Attempts are made
to study the performance of the test specimen by studying loop hysteresis, maximum push and pull load and load
at the propagation of first crack.
Keywords: Non-linear analysis; Crack propagation, cyclic loading
I. Introduction
Designing beam–column joints is considered to be a complex and challenging task for structural
engineers, and careful design of joints in RC frame structures is crucial to the safety of the structure. Although
the size of the joint is controlled by the size of the frame members, joints are subjected to a different set of loads
from those used in designing beams and columns. It has been identified that the deficiencies of joints are mainly
caused due to inadequate design to resist shear forces (horizontal and vertical) and consequently by inadequate
transverse and vertical shear reinforcement and of course due to insufficient anchorage capacity in the joint [1].
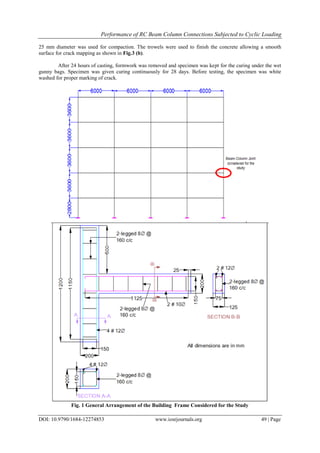
In this study, a conventional four-storey RC school building (Fig.1) is considered for analysis, design
and detailing of exterior joint. Different failure modes are expected in beam-column joints depending on the
type of joint (exterior or interior) and the adopted structural details. Hence, in the present study, exterior beam-
column joint has been chosen for investigating the performance under seismic type loading.
II. Design Of Test Specimen
Characteristic compressive strength of concrete and tensile strength of steel used in the specimen have
been taken as 30 MPa and 415 MPa, respectively. The specimen has the following general and cross-sectional
dimensions: height of column is 3200 mm having cross-sections of (425 x 425) mm and length of beam is 2500
mm with beam size (300 x 525) mm. For casting the specimen, weight ratio of cement: sand: coarse aggregate
was adopted as 1 (cement): 2.25 (fine aggregate): 2.35 (coarse aggregate-60% 10 mm size, 40% 20 mm size):
0.5 (w/c). Ordinary Portland Cement (OPC) with 28 days minimum compressive strength of 53 MPa is used.
Analysis of a conventional four storey RC building frame is carried out using STAAD.Pro. Based on
analysis data, critical region such as exterior joint is selected for the study. Gravity load design (GLD) specimen
was designed and the reinforcement is provided as per details given in IS: 456 – 2000. The geometry of the
specimen is finalised in order to match the bending moment distribution at the joint for which it is designed.
Seismic analysis (Response Spectrum Analysis) of the framed structure (Fig. 1) has been performed using
STAAD.Pro to obtain the design forces. The results obtained from the analysis of a 3 - bay four-storey RC
building under the load combinations are used to design the specimen. Finally, as shown in Fig. 2, the geometry
of the components (top and bottom portion of column and beam length from joint face) is chosen to match the
bending moment distribution at the joint for which it was designed.
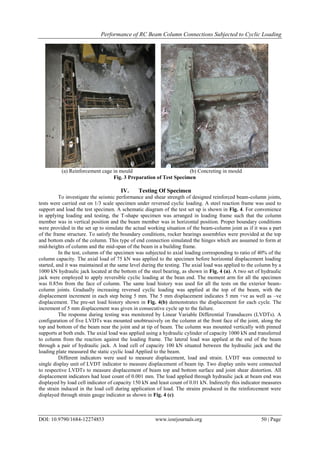
III. Preparation Of Test Specimen
For the construction of beam column specimen, foldable wooden moulds are prepared so set specimen
can be easily removed from the mould. These moulds can be reused. As per details given in Fig. 2
reinforcement bars are provided. Fig. 3 shows the wooden mould with reinforcement bars placed inside it. Strain
gauges were fixed with reinforcement bars in order to study the strain developed in the bars when the specimen
is loaded. After the assemblage of the beam and column reinforcement, the assembly was put into the formwork
and was made ready for casting as shown in Fig. 3 (a). The plain concrete used in all groups was prepared by
proportion 1: 1.57: 3.20. The concrete was poured in the formwork horizontally. The compaction of the concrete
was performed using a vibrator to produce uniformity throughout the specimen. A needle vibrator with a head of](https://image.slidesharecdn.com/i012274853-160711051612/85/I012274853-1-320.jpg)
![IOSR Journal of Mechanical and Civil Engineering (IOSR-JMCE)
e-ISSN: 2278-1684,p-ISSN: 2320-334X, Volume 12, Issue 2 Ver. VII (Mar - Apr. 2015), PP 48-53
www.iosrjournals.org
DOI: 10.9790/1684-12274853 www.iosrjournals.org 48 | Page
Performance of RC Beam Column Connections Subjected to
Cyclic Loading
Minakshi Vaghani 1
, Dr. S.A. Vasanwala 2
, Dr. A.K. Desai 3
1
(Civil Engineering Department, Sarvajanik College of Engineering & Technology, Surat – 1, India)
2,3.
(Applied Mechanics Department, SVNIT, Surat- 1, India)
Abstract : Structures and lifelines designed for typical loading are often badly damaged or can collapse during
earthquakes. The observations from recent earthquakes show that many RC structures have failed in the brittle
behaviour of beam-column connections due to the deficiency of seismic details in the joint regions. Joint shear
failures have been observed recently in many existing RC structures subjected to severe earthquake loadings. In
this study, RC beam column specimen was casted and tested for excitation of cyclic loading. Attempts are made
to study the performance of the test specimen by studying loop hysteresis, maximum push and pull load and load
at the propagation of first crack.
Keywords: Non-linear analysis; Crack propagation, cyclic loading
I. Introduction
Designing beam–column joints is considered to be a complex and challenging task for structural
engineers, and careful design of joints in RC frame structures is crucial to the safety of the structure. Although
the size of the joint is controlled by the size of the frame members, joints are subjected to a different set of loads
from those used in designing beams and columns. It has been identified that the deficiencies of joints are mainly
caused due to inadequate design to resist shear forces (horizontal and vertical) and consequently by inadequate
transverse and vertical shear reinforcement and of course due to insufficient anchorage capacity in the joint [1].
In this study, a conventional four-storey RC school building (Fig.1) is considered for analysis, design
and detailing of exterior joint. Different failure modes are expected in beam-column joints depending on the
type of joint (exterior or interior) and the adopted structural details. Hence, in the present study, exterior beam-
column joint has been chosen for investigating the performance under seismic type loading.
II. Design Of Test Specimen
Characteristic compressive strength of concrete and tensile strength of steel used in the specimen have
been taken as 30 MPa and 415 MPa, respectively. The specimen has the following general and cross-sectional
dimensions: height of column is 3200 mm having cross-sections of (425 x 425) mm and length of beam is 2500
mm with beam size (300 x 525) mm. For casting the specimen, weight ratio of cement: sand: coarse aggregate
was adopted as 1 (cement): 2.25 (fine aggregate): 2.35 (coarse aggregate-60% 10 mm size, 40% 20 mm size):
0.5 (w/c). Ordinary Portland Cement (OPC) with 28 days minimum compressive strength of 53 MPa is used.
Analysis of a conventional four storey RC building frame is carried out using STAAD.Pro. Based on
analysis data, critical region such as exterior joint is selected for the study. Gravity load design (GLD) specimen
was designed and the reinforcement is provided as per details given in IS: 456 – 2000. The geometry of the
specimen is finalised in order to match the bending moment distribution at the joint for which it is designed.
Seismic analysis (Response Spectrum Analysis) of the framed structure (Fig. 1) has been performed using
STAAD.Pro to obtain the design forces. The results obtained from the analysis of a 3 - bay four-storey RC
building under the load combinations are used to design the specimen. Finally, as shown in Fig. 2, the geometry
of the components (top and bottom portion of column and beam length from joint face) is chosen to match the
bending moment distribution at the joint for which it was designed.
III. Preparation Of Test Specimen
For the construction of beam column specimen, foldable wooden moulds are prepared so set specimen
can be easily removed from the mould. These moulds can be reused. As per details given in Fig. 2
reinforcement bars are provided. Fig. 3 shows the wooden mould with reinforcement bars placed inside it. Strain
gauges were fixed with reinforcement bars in order to study the strain developed in the bars when the specimen
is loaded. After the assemblage of the beam and column reinforcement, the assembly was put into the formwork
and was made ready for casting as shown in Fig. 3 (a). The plain concrete used in all groups was prepared by
proportion 1: 1.57: 3.20. The concrete was poured in the formwork horizontally. The compaction of the concrete
was performed using a vibrator to produce uniformity throughout the specimen. A needle vibrator with a head of](https://image.slidesharecdn.com/i012274853-160711051612/75/I012274853-1-2048.jpg)
![Performance of RC Beam Column Connections Subjected to Cyclic Loading
DOI: 10.9790/1684-12274853 www.iosrjournals.org 51 | Page
(a) Experimental set-up
(c) Measuring devices
(d) Cyclic load history
Fig. 4 Testing of Test Specimen
V. Results And Discussions
The cyclic performance characteristics of the beam–column joints can be evaluated through hysteretic
behaviors such as ductility, energy dissipation capacity, strength deterioration, and stiffness degradation.
5.1 Crack and Damage Pattern
Ten full displacement cycles were applied to the test specimen. In the first loading cycle, the specimen
was loaded up to 9.63 kN up and 9.38 kN down to test the instrumentations. First flexural crack was observed
during second cycle at displacement of 10 mm (drift ratio of 1.18%).
Fig. 5 Crack and Damage Pattern of Beam-Column Specimen
The corresponding restoring force was measured as 15.72 kN down. In the fourth cycle, a load of 24.95
kN was applied down and 22.58 kN up to the specimen and new flexural and flexural–shear cracks formed
along the beam length. In the sixth cycle, vertical crack formed in the joint region at beam-tip load of 29.68 kN
due to bond-slip of the beam bottom bars. During the eighth cycle, diagonal shear cracks developed in the joint
region, and the specimen reached a load of 31.06 kN at a beam-tip displacement of 35.9 mm. Repeating the
same cycle, the beam reached the same displacement but at lower load level and the beam bars started to slip out
of the joint with an associated reduction in the developed strain in the bars. The final failure pattern is shown in
Fig. 5.
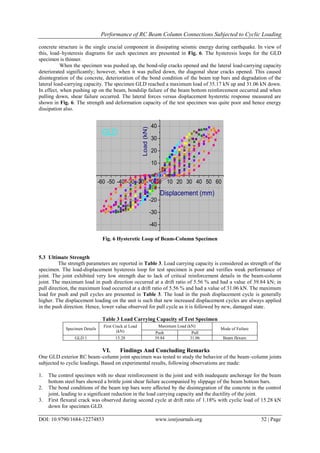
5.2 Hysteretic Behaviour
The most important parameter for seismic performance of structural D-regions can be described by
load–displacement hysteresis during the cyclic loading which can indicate the ductility capacity and energy
dissipation efficiency of the component [2,3]. It is well proven that the beam-column joint of reinforced](https://image.slidesharecdn.com/i012274853-160711051612/85/I012274853-4-320.jpg)
![Performance of RC Beam Column Connections Subjected to Cyclic Loading
DOI: 10.9790/1684-12274853 www.iosrjournals.org 53 | Page
4. The maximum load in push direction occurred at a drift ratio of 5.56 % and had a value of 39.84 kN; in pull
direction, the maximum load occurred at a drift ratio of 5.56 % and had a value of 31.06 kN for GLD
specimen.
References
Journal Papers:
[1]. Akanshu Sharma, R. Eligehausen, G.R. Reddy (2011), "A new model to simulate joint shear behavior of poorly detailed beam–
column connections in RC structures under seismic loads, Part I: Exterior joints", Engineering Structures, 33, 1034–1051.
[2]. Constanze Röhma, Balthasar Novák, Saptarshi Sasmal, Ramanjaneyulu Karusala, Voggu Srinivas(2012), " Behaviour of fibre
reinforced beam-column sub-assemblages under reversed cyclic loading ”, Construction and Building Materials, 36 ,319–329
[3]. Saptarshi Sasmal, Balthasar Novák, K. Ramanjaneyulu (2011), "Numerical analysis of fiber composite-steel plate upgraded beam–
column sub-assemblage under cyclic loading", Composite Structures 93, pp. 599–610.
[4]. G. A. Lakshmi, Anjan Dutta, S.K. Deb (2008), "Numerical Studies of Strengthening of Beam-column Joint under Cyclic Excitation
using FRP Composites", Journal of Structural Engineering, 35, 59-65.
[5]. Ghobarah A. and T. El-Amoury (2002). "Seismic rehabilitation of beam–column joint using GFRP sheets", Engineering Structures
5, 1397–1407.
[6]. Ghobarah A., M. El-Attar, N.M. Aly (2000), "Evaluation of retrofit strategies for reinforced concrete columns: a case study",
Engineering Structures, 22, 490–501.
[7]. Kien Le-Trung, Kihak Lee, Jaehong Lee, Do Hyung Lee, Sungwoo Woo (2010), "Experimental study of RC beam–column joints
strengthened using CFRP composites", Composites: Part B, 41, 76–85.
[8]. Kien Le-Trung, Kihak Lee, Myoungsu Shin, Jaehong Lee (2011), "Analytical assessment and modeling of RC beam-column
connections strengthened with CFRP composites", Composites: Part B, 42, 1786–1798.
[9]. Jaehong Kim and James M. LaFave,"Joint Shear Behavior of Reinforced Concrete Beam-Column Connections subjected to Seismic
Lateral Loading", NSEL Report Series Report No. NSEL-020 November 2009
Book:
[1]. Dr. Durgesh C Rai (2007), Review of Documents on Seismic Strengthening of Existing Buildings, IITK,-GSDMA - EQ07 - V1.0,
India
Standards:
[1]. Indian Standard (IS 13920-1993). Ductile detailing of reinforced concrete structures subjected to seismic forces – code of practice
Bureau of Indian Standards , New Delhi.
[2]. Indian Standard (IS-456-2000). Plain and reinforced concrete – code of practice. New Delhi: Bureau of Indian Standards, New
Delhi.](https://image.slidesharecdn.com/i012274853-160711051612/85/I012274853-6-320.jpg)

This document summarizes a study that tested reinforced concrete beam-column connections under cyclic loading to evaluate their seismic performance. A 1/3 scale beam-column specimen was designed and constructed based on analysis of a 4-story building frame. The specimen was tested under reversed cyclic loading with increasing displacements up to failure while monitoring response through instruments. Cracks initially formed in flexure and progressed to shear cracks. Analysis of load-displacement hysteresis loops provided information on ductility, energy dissipation, strength degradation, and stiffness degradation to evaluate the seismic performance of the connection.


