1) The document examines the main synoptic conditions associated with extreme precipitation amounts in Greece using statistical analysis of daily precipitation data from 3 stations and atmospheric data from 273 grid points over Europe.
2) 369 extreme precipitation cases from 1970-2002 were identified, some common to multiple stations. Factor analysis was used to reduce the atmospheric data dimensions, revealing 7 factors explaining 85% of variance.
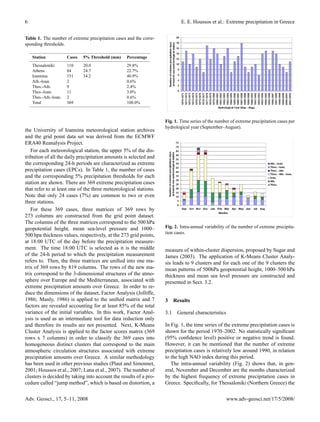
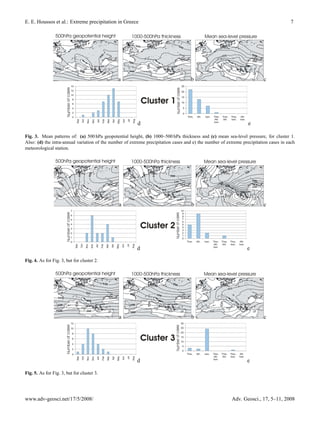
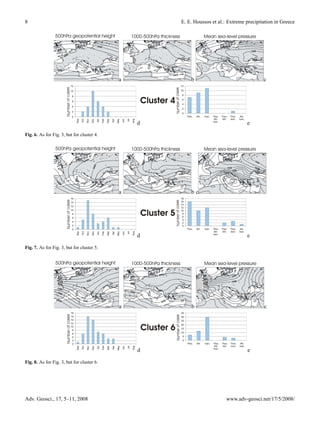
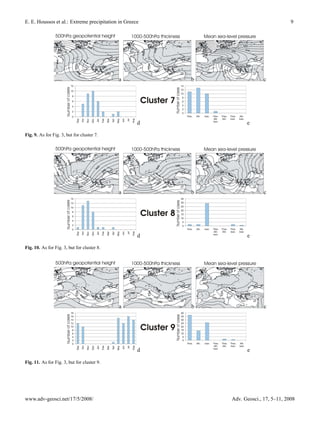
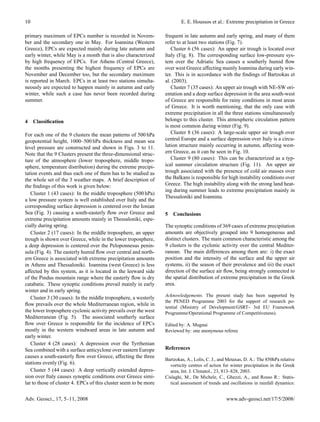
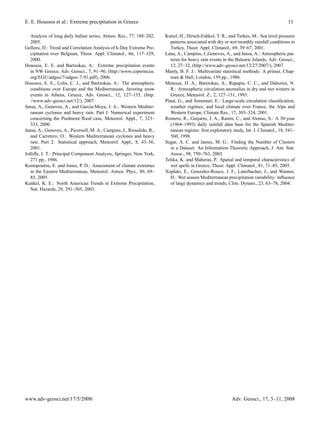
3) Cluster analysis grouped the cases into 9 clusters corresponding to distinct atmospheric circulation patterns favoring extreme precipitation. Mean patterns for each cluster show differences in the position and intensity of surface and upper air synoptic systems.