SlideShare a Scribd company logo
1 of 13
Download to read offline
Historical and Contemporary Trends in the Size, Drift, and Color of Jupiterʼs Great
Red Spot
Amy A. Simon1
, Fachreddin Tabataba-Vakili2
, Richard Cosentino3
, Reta F. Beebe4
, Michael H. Wong5
, and Glenn S. Orton2
1
NASA Goddard Space Flight Center 8800 Greenbelt Road Greenbelt, MD 20771, USA; Amy.simon@nasa.gov
2
Jet Propulsion Laboratory California Institute of Technology 4800 Oak Grove DrivePasadena, CA 91109, USA
3
USRA/NASA Goddard Space Flight Center 8800 Greenbelt Road Greenbelt, MD 20771, USA
4
New Mexico State University Astronomy Department P.O. Box 30001, MSC 4500 Las Cruces, NM 88001, USA
5
University of California, Berkeley Astronomy Department Berkeley, CA 94720-3411, USA
Received 2017 December 29; revised 2018 January 30; accepted 2018 February 6; published 2018 March 13
Abstract
Observations of Jupiter’s Great Red Spot (GRS) span more than 150 years. This allows for careful measurements
of its size and drift rate. High spatial resolution spacecraft data also allow tracking of its spectral characteristics and
internal dynamics and structure. The GRS continues to shrink in longitudinal length at an approximately linear rate
of 0°.194 yr−1
and in latitudinal width at 0°.048 yr−1
. Its westward drift rate (relative to System III W. longitude)
has increased from ∼0°.26/day in the 1980s to ∼0°.36/day currently. Since 2014, the GRS’s short wavelength
(<650 nm) reflectance has continued to decrease, while it has become brighter at 890 nm, indicating a change in
clouds/haze at high altitudes. In addition, its north–south color asymmetry has decreased, and the dark core has
become smaller. Internal velocities have increased on its east and west edges, and decreased on the north and south,
resulting in decreased relative vorticity and circulation. The GRS’s color changes from 2014 to 2017 may be
explained by changes in stretching vorticity or divergence acting to balance the decrease in relative vorticity.
Key words: planets and satellites: atmospheres – planets and satellites: gaseous planets
Supporting material: data behind figures
1. Introduction
Jupiter’s Great Red Spot (GRS) has long fascinated
observers, with detailed historical records of its appearance
and size dating back to the mid 1800s (Peek 1958;
Rogers 1995). Detailed measurements were made of the GRS’s
position and size, using reticulated eyepieces to record timings
of transit crossings with small telescopes, along with notes on
appearance (e.g., Peek 1958). The accuracy of these measure-
ments depended on Earth atmospheric conditions and seeing,
the contrast of GRS with its surroundings, and the skill of the
particular observer. To improve measurement accuracy indivi-
dual observations were often averaged over a full apparition
(the yearly viewing period) and tabulated to show trends in
longitudinal size over time.
In 1974, Pioneer 10/11 Imaging Photopolarimeter measure-
ments did not reveal many details of the GRS’s structure but
did show a striking red color against bland background clouds
(Fimmel et al. 1980). Starting in 1979 with the Voyager 1 and
2 flybys, detailed imagery showed the GRS’s complex inner
workings and velocity fields (Smith et al. 1979; Beebe
et al. 1989). Frequent observations from the Hubble Space
Telescope (HST), interspersed with high-resolution views
from Galileo, Cassini, New Horizons, and now Juno, have
established a long-term monitoring record, confirming that the
GRS is shrinking and evolving with time (Simon-Miller
et al. 2002, Asay-Davis et al. 2009, Shetty & Marcus 2010;
Simon et al. 2014). It has proven especially interesting in recent
years as it has intensified in color, becoming a striking deep
orange (Simon et al. 2014, 2015a, 2015b).
Two HST monitoring programs, the Outer Planet Atmo-
spheres Legacy (OPAL) and Wide Field Coverage for Juno
(WFCJ), now give frequent, at least yearly, views of the GRS
with the UV-optical channel (UVIS) of the Wide Field Camera
3 (WFC3). This wealth of new data allows us to analyze trends
in the recent behavior and characteristics of the GRS, further
constraining the mechanisms powering and sustaining this
long-lived storm. In this paper, we examine the GRS’s long-
term drift rate, size and shape, color, and wind fields changes
over the full range of available data sets (1878 to present), with
a focus on recent data sets (1996–2017).
2. Data Sets and Measurement Methods
2.1. Data Sets
Careful historical records exist with consistent yearly
measurements of the GRS dating back to 1878 (Peek 1958).
Several measurements also exist, with no regular cadence,
between 1831 and 1878. Prior to this, Cassini’s (or Hooke’s)
Spot was recorded in the mid 1660s, but it remains unclear if
that was the same storm due to its size and location. There was
a lack of detailed measurements in the intervening years with
only sporadic measurements until the early 1700s (Peek 1958;
Hooke 1665; Cassini 1666; Reese & Solberg 1966; Reese
1971); the definitive first measurement of the GRS in the
historical record came from Schwabe in 1831 (Denning 1898).
From these detailed historical reports, the longitudinal size and
average drift rate were tabulated and are included in our
analyses.
The spacecraft record includes imagery from a number of
missions, including Voyager (1979), Galileo (1995–2003),
Cassini (2000/2001), and the HST (1994 to present). Due to
observing limitations, these data are not regularly spaced but
provide very accurate measures of size and shape, location, and
in some cases, internal wind fields. The two most recent HST
programs, OPAL and WFCJ, now provide at least yearly
imaging data (2015 to present). Figure 1 shows a compilation
The Astronomical Journal, 155:151 (13pp), 2018 April https://doi.org/10.3847/1538-3881/aaae01
© 2018. The American Astronomical Society. All rights reserved.
1
Figure 1. GRS appearance at blue/violet wavelengths from 1979 (lower left) to 2017 (upper right). Data from: Voyager 1979, Hubble WFPC2 1994–2008, Cassini
2000, Hubble WFC3 2009-present. There is no common contrast scale between images. These maps span ±20° of longitude and planetographic latitude; the Cassini
image was mapped in planetocentric latitude and is slightly compressed.
2
The Astronomical Journal, 155:151 (13pp), 2018 April Simon et al.
of HST and Voyager images at blue/violet wavelengths,
showing the obvious GRS change in color and size over time.
2.2. Methods
Prior to any analysis, all spacecraft images were navigated
using iterative ellipsoid limb fitting software, based on the
camera’s characteristics, range to Jupiter, and limb/terminator
brightness as done in all previous studies (e.g., Simon
et al. 2015b). This yields a planet center fit, usually to better
than 0.05 pixels. The ephemerides are generated using the
Planetary Data System Rings node ephemeris generator tools
(https://pds-rings.seti.org/tools/ephem2_jup.html) and pro-
vide the absolute coordinate system on the planet for each
date and time.
For measuring GRS dimensions, most observers typically
use the boundaries of the colored area and filters at blue
wavelengths that offer the greatest contrast, see Figure 1.
Although dynamical size measurements, using the location of
the highest velocity region, may be more robust (Asay-Davis
et al. 2009; Shetty & Marcus 2010), wind fields are not
available as often as single images. Thus, for consistency, this
paper examines size using the historical method, with the
caveat that colored edges are not always well-defined. If it is
wispy, or blue wavelengths were not available, other
wavelengths can be used to further delineate size. In our
analyzed data set, only 2012 lacked blue-filtered images, so a
combination of red and UV filters was used for that
date.Measurement uncertainties in the HST data are less
<0°.1, with the above disclaimers on actual edge locations.
Errors in individual measurements are random, so uncertainty
in the derived long-term drift rates is well characterized by the
scatter in the individual measurements.
For drift rate measurements, the GRS’s central longitude is
tracked at each measurement opportunity. Individual positional
measurements of the GRS are affected by the known 90-day
oscillation in its longitudinal motion (Reese 1971). In addition,
the time separations are not constant for the available data
(spans vary from 1 month to 2 years); the date shown for a
given drift rate is the mid-range value. Depending on the phase
of the 90-day oscillation with respect to any individual
measurement, we expect offsets from the mean position of up
to the amplitude of the oscillation, about 0°.76 of longitude as
measured in the 1969–1970 epoch (Reese 1971) or 1°.2 as
measured in the 1990s (Trigo-Rodriguez et al. 2000).
All spectral data were obtained from the HST imagery using
the Wide Field Planetary Camera 2 (WFPC2) prior to 2009 and
WFC3 for 2009 and later. The absolute photometry of each
image is found using the HST pipeline calibration factors for
each filter and converted to reflectance using the solar flux in
each filter and heliocentric range. WFC3 methane-absorption
band images are further defringed, a 1%–2% correction (Simon
et al. 2015b). We convert to I/F for consistency using the solar
spectrum of Colina et al. (1996). WFPC2 absolute photometry
is typically accurate to ∼5% (Gonzaga et al. 2006), and WFC3
photometry has a recently updated accuracy as low as 1% for
full-frame filters (Deustua et al. 2016, 2017). For the WFC3
quad filters, updates have not yet been provided by STScI, so
we estimate a photometric uncertainty of about 3% (see Section
2.1 of Irwin et al. 2017). In addition, long-wavelength
narrowband filters in WFC3 have photometric errors associated
with fringing. We have corrected for this effect using the
approach of Wong (2011), but residual errors of about 0.8%
may remain for the 889 nm WFC3 observations.
3. Analyses
3.1. Size and Drift Rate Trends
Using both the historical data and the spacecraft data, one can
track the longitudinal size (“length”) and drift rate of the GRS
relative to the rotation rate of the planet (System III W. longitude),
Figure 2. Change in longitudinal size (“length”) over time (black), change in System III westward drift rate (red). Historical size measurements from Reese (personal
communication—private records) from a combination of transit timings and photographic plates. Historical drift rates from Peek (1958) (1872–1943), Reese
(1945–1963) and Guitar (1962–1981; Guitar 1984). Peek’s historical transit measurements were converted from recorded rotation periods to System III drift rates. The
data used to create this figure are available.
3
The Astronomical Journal, 155:151 (13pp), 2018 April Simon et al.
Figure 2. For length, the historical record varies, in part because
the true shape of the GRS was not recognized; many early
observations, particularly when the GRS was faint, were really of
the surrounding “hollow” (Peek 1958; Rogers 1995). This is
particularly evident when the drawings indicate a pointed shape to
the spot, especially in the 1910s and 1920s. Thus, these
measurements probably overestimate the size of the GRS, rather
than the spot itself growing and shrinking rapidly, and we cannot
easily assign error bars to the early data. Note that even early
photographic records have uncertainty of a few degrees due to low
resolution and potentially poor observing conditions.
Historically, the GRS was assumed to move at a constant
rate relative to System II longitude, a rotational period based on
the mean motion at the GRS latitude (Peek 1958). However,
that was found to not be the case, and there is circumstantial
evidence of correlation between drift and length in historical
data, but no constant trend with time, Figure 2. In either
longitude system, the motion of the GRS has accelerated in
recent years, since about 2010. Although the early data are
interesting, the scatter in length measurements and drift rate is
dependent on the observer, observing conditions, and GRS
contrast. Thus, it is difficult to use them for analysis, given the
unknowns in what was measured.
However, with the higher-resolution spacecraft data, the
size and shape of the GRS may be examined more closely,
and all using the same method of measurement. Since
1979, there are accurate measurements of both the length
and the latitudinal size, “width,” as well as drift, Figure 3.
Uncertainties from image navigation are <0°.1. As discussed
previously, if an edge is not well-defined in a single image,
other images or wavelengths are used. Thus, overall
uncertainty in the size measurements is small, less than 0°.5.
For drift rates, the uncertainty from size measurements is
<0°.006/day for the shortest time separations and decreases
with longer time separations, smaller than the uncertainty
from the 90-day oscillation, typically 0°.003/day over these
time spans (Trigo-Rodriguez et al. 2000). These size and drift
trends were fit with both linear and quadratic least-squares
fits. In most cases, the quadratic fit produced only a small
improvement in unreduced χ2
(see IDL linfit routine), but are
shown in Figure 3 for reference.
The data fits shown in Figure 3 correspond to the following
equations:
Length (°) = 405.0 − 0.1939 ∗ Year, χ2
= 2.877.
Width (°) = 107.2 − 0.0483 ∗ Year, χ2
= 1.708.
Aspect ratio = 24.1 − 1.123E–2 ∗ Year, χ2
= 0.052.
Drift rate (°/day) = −3.84 + 2.065E–3 ∗ Year, χ2
= 0.005.
The linear decrease in length is 0°.194 yr−1
, higher than the
historical value and that found by Beebe & Youngblood (1979)
of 0°.114 yr−1
over the interval 1943–1979. Width has also
decreased at 0°.048 yr−1
, with possible acceleration in recent
years. The length and width dimensions are highly correlated,
with a correlation coefficient of 0.88 (>0.99 if the fits are
used), and result in a decrease in aspect ratio of ∼0.011 yr−1
.
Lastly, the drift rate also shows an acceleration, and the linear
Figure 3. Expanded view of longitudinal size, drift rate, latitudinal size, and aspect ratio (length/width) since 1979. Least-squares fitting of the data are shown as solid
(quadratic) and dashed (linear) lines.
4
The Astronomical Journal, 155:151 (13pp), 2018 April Simon et al.
best fit from 1979 to 2017 shows about an 0°.002/day per year
increase. The fits for each parameter from 1979 to 2017 were
used to compare drift rate with the other measurements: The
drift rate appears to be anticorrelated with all three measure-
ment fits, with correlation coefficients of −0.91, −0.88, to
−0.92, for length, width and aspect ratio, respectively. This is
unsurprising, given that the length and width are tightly
correlated, and this fails to constrain which parameter or
physical mechanism might control the GRS drift rate.
Another potential diagnostic is the latitudinal location of
the GRS and its corresponding position in the zonal wind
field. Figure 4 plots the change in the northern and southern
colored edge locations with time, as well as the drift of the
GRS central latitude (∼0°.3 from 1979 to 2017). Although it
has decreased in width, the GRS still overfills the wind jet-
defined latitude corridor, bounded by a westward jet peak
at −19°.5 (60–70 m s−1
) and an eastward jet peak at −26°.5
(40–50 m s−1
). This means that the wind jets continue to be
deflected around the GRS, even as it shrinks and drifts slightly
southward. The northern edge has receded twice as fast as the
southern (0°.033 yr−1
versus 0°.015 yr−1
), while the center has
drifted at −0°.008 yr−1
. The corresponding fits for the edges
and center latitude are:
Northern Edge Lat (°) = 49.2 − 3.305E–2 ∗ Year, χ2
= 2.51.
Southern Edge Lat (°) = −58.0 + 1.528E–2 ∗ Year,
χ2
= 1.2.
Central Lat (°) = −4.4 − 8.887E–3 ∗ Year, χ2
= 1.43.
The N. and S. edge locations correlate with the drift rate, as
does the GRS central latitude, all with correlation coefficients
of 0.88. Note that the GRS’s position can also be influenced by
interactions with, or passage by, other storms (Rogers 1995;
Sánchez-Lavega et al. 1998; Sanchez-Lavega et al. 2013). The
regular passages of the White Oval(s) to its south at 33° S
appears to have small effect on its location (Sanchez-Lavega
et al. 2013), while an unusually large oval at the GRS’s latitude
in the 1990s did cause it to move by a few degrees when they
met (Sánchez-Lavega et al. 1998).
The correlation of drift rate and GRS latitudes may imply
there is some interplay between the GRS motion and the wind
field, despite being larger than the wind jet confines. As the
dimensions of the GRS are also correlated with the drift rate, it
is worth comparing the trend of GRS length and width with its
location. The correlation coefficient between the N. edge or S.
edge and the GRS length or width is ∼1.00; it is slightly lower
for the southern edge if quadratic fits are used. The relationship
between GRS dimensions and its edge locations is intriguing
and provides the strongest evidence that the wind field affects
the long-term GRS size and drift rate.
3.2. Color and Spectra
An interesting note in the historical data is that the intensity
of the GRS’s color appeared to be somewhat correlated with its
motion; color was more intense, or it was darkest, when it
accelerated (Peek 1958). Using HST images of the GRS
obtained when it was closest to the central meridian longitude
(CML), the I/F of the central darkest core is plotted in
Figure 5. I/F is calculated by selecting pixels in the central
core region (typically 3×3 pixels), and measuring the data
numbers (DNs). Each value is converted from DN to I/F using
the range-corrected solar flux integrated across each filter
bandpass, and the filter transmission and detector/system
response (from the Hubble pipeline PHOTFLAM keyword).
The I/F value is then plotted against the filter’s central
wavelength. These values are consistent with previous
measurements, but do not appear to match Karkoschka’s
(1998) full disk I/F, because full disk also includes limb
values, which lower the total I/F. For example, if we compute
the full disk I/F for 2017 at 631 nm by averaging across the
entire visible disk, we find I/F=0.47, consistent with
Karkoschka (1998).
From 1995 to 2009, there are no notable reflectance
differences at any wavelength. Beginning in 2014, the color
of the GRS deepened significantly, Figure 1, and the change is
apparent at all wavelengths <600 nm, Figure 5. Although the
Figure 4. GRS central planetographic latitude and latitude span. Solid lines are quadratic best fits to the recent data. Dashed lines indicate the major eastward and
westward wind jets, and the orange area corresponds to the latitudinal coverage of the GRS. The data used to create this figure are available.
5
The Astronomical Journal, 155:151 (13pp), 2018 April Simon et al.
GRS was not centered on the CML in the 2014 and 2015
images, the angle was too small for limb darkening to explain
the variation. It has remained this color since 2014, perhaps
even darkening further in 2016/2017 when the GRS was on the
CML; this is also apparent in true color images, Figure 6.
Previously, work showed that the change in brightness from
400 to 500 nm has an approximately linear offset as the color
deepened, but the slope from 500 to 600 nm also changed
(Simon et al. 2014, 2015a, 2015b). Whiter/lighter visible
features have a shallower slope, while redder features have a
steeper slope, Figure 7. From 2014 to 2017, the internal
coloration of the GRS has changed, and there is no longer a
north–south asymmetry or large darker core at blue wave-
lengths, e.g., Figure 1 1979–2009 (Simon-Miller et al. 2002;
Simon et al. 2015a).
In the strong methane gas absorption band images at 889 nm,
the GRS internal structure does not look remarkably different
in recent years but the reflectance has increased. Figure 8 plots
the brightness with latitude averaged over 0°.3 along the central
longitude in both the 889 nm band and the F275W UV band;
both are sensitive to high-altitude structure. There are several
noticeable changes: first in 889 nm, overall brightness has
increased, while 275 nm brightness has decreased, both
indicating changes in the high-altitude haze/cloud structure.
The GRS brightness at 889 nm has also become more peaked
toward the center, rather than being brighter farther north of the
center, particularly when 2017 is compared with 2014. This is
consistent with the change in red slope, as well.
4. Discussion
To understand the motion of the GRS, we look to terrestrial
analogs. Although likely not powered by the same moist
convection, several factors can similarly affect its drift rate, as
is true for Earth cyclones/anticyclones: the zonal winds (or
steering winds), beta drift (advection of background potential
vorticity), and vertical wind shear. The vertical wind shear has
the smallest effect, primarily pushing a cyclone poleward. With
only limited measurements of background vertical wind shear
on Jupiter at these latitudes, primarily inferred from the thermal
wind equation (e.g., Conrath et al. 1981; Gierasch et al. 1986;
Simon-Miller et al. 2002, 2006), we leave this effect to future
circulation modeling and focus on the first two factors.
First, for a terrestrial northern hemisphere cyclone, the
steering winds have the largest effect as jet streams and other
high- and low-pressure systems push the system. The GRS
central latitude near −22°.3 corresponds to zonal winds of
15–30 m s−1
westward (1°–2°/day), with peripheral jets at
−19°.5 (∼65 m s−1
westward) and −26°.5 (∼40 m s−1
east-
ward). These velocities may change slightly as the GRS center
moves southward, but the edges are still both deflecting the
peripheral jets, so this seems unlikely to be the major driver of
its motion. The zonal winds at these latitudes were generally
very constant from 1979 to 2007 (Simon-Miller & Gierasch
2010, Asay-Davis et al. 2011). However, comparison of zonal
wind profiles from 2008 to 2016 showed there is some
variability in the zonal wind speed near the GRS latitudes
(Tollefson et al. 2017). The magnitude of the jet at −19°.5 is
relatively constant, with some small changes in jet shape on the
equatorward side, Figure 9, left. The jet magnitude at −26°.5
increases from 30 m s−1
in 2008 to ∼35 m s−1
in 2009 to 2015
and 40 m s−1
in 2016 but also appears to have shifted in
latitude. However, if these winds were driving the GRS motion,
it should be decelerating rather than accelerating, as it is pushed
eastward by the stronger winds.
Second, in a terrestrial hurricane, beta drift accounts for a
few m s−1
poleward and westward motion. The GRS is an
anticyclone, so the beta effect is reversed. Thus, a change in
background potential vorticity could also allow the GRS to
accelerate. Figure 9, from left to right, shows smoothed zonal
wind fields, u, smoothed relative vorticity, ∂u/∂y, and
smoothed relative vorticity gradient, uyy, computed for four
years from the Cassini zonal wind field (Porco et al. 2003) and
from HST zonal wind fields (Tollefson et al. 2017). To
calculate uy, the zonal wind profile was smoothed into 0°.5 bins,
Figure 5. Spectral evolution of the dark central core of the GRS from 1995 to 2017. The solid line is the Karkoschka (1998) full disk spectrum, sampled with 1 nm
spacing. Uncertainties are shown for WFPC2 data (1995–2008), WFC3 data (2009–2017) uncertainties are smaller than the symbol size.
6
The Astronomical Journal, 155:151 (13pp), 2018 April Simon et al.
and for uyy, uy was smoothed in 1° bins, using a running
average. For direct comparison with previous work, uyy was
then smoothed in 2° bins (Read et al. 2006a). Smoothing did
not alter the calculation results.
As mentioned above, Figure 9, left, shows slight shifts in the
surrounding wind jet locations, along with small magnitude
changes. This results in variation of the background vorticity,
with a decrease near −19°.5 and reversal near −26°.5 in 2016 as
the jet moved northward. Similar to what Read et al. (2006a)
found, the magnitude of the vorticity gradient of the westward
jet at −19°.5 exceeds the planetary vorticity, β (dash–dot lines
in right panel), violating the Rayleigh–Kuo stability criterion
(Read et al. 2006a), but decreases in 2015/2016. For the
eastward jet at −26°.5, the uyy also exceeds the magnitude of
the planetary vorticity. However, at the GRS’s southern
boundary, in 2016 the vorticity gradient was close to the
planetary vorticity and possibly no longer in violation. While
an individual year’s profiles may not be statistically significant,
the decreasing trend in uyy in the westward jet, and maybe
both jets, may explain the increased GRS drift rate since
2010. Of course, as the GRS deflects the jets, this is difficult
to interpret.
Correlating the GRS color changes with a physical
mechanism is the most challenging task. Historical measure-
ment suggested that color and drift rate were correlated
(Peek 1958; Rogers 1995), in agreement with the 2014–2017
Figure 6. GRS true color montage, generated from images I/F at 631 (R), 502 (G), and 395 (B) nm, over time from 2014 (lower left) to 2017 (upper right). Minnaert
limb darkening corrections were applied before mapping 2014 April and 2015 January, as the GRS was offset from the central meridian by ∼15° in both cases (the
effect is small but reduces a gradient across the images). The Minnaert coefficients are 0.999, 0.95, and 0.85 for 631, 502, and 395 nm, respectively.
7
The Astronomical Journal, 155:151 (13pp), 2018 April Simon et al.
observations of intense coloration and high drift rates.
However, other than perhaps a change in the amount of cloud
ingested, that does not present an obvious physical mechanism
(Simon et al. 2014). However, vortex stretching is a possible
mechanism that explains GRS color variability.
Quasi-geostrophic potential vorticity (QGPV) is the sum of
planetary vorticity, relative vorticity, and stretching vorticity
(e.g., Holton 1992; Read et al. 2006b). Quasi-geostrophic
potential vorticity should be conserved, and any changes in the
GRS’s internal relative vorticity should be balanced by a
change in stretching vorticity, as the planetary vorticity is
constant (Holton 1992). Indeed, previous models assuming
QGPV have been able to reproduce the internal structure of the
GRS, with a high velocity collar and a quiescent core (Cho
et al. 2001).
Under QGPV, a change in size, and therefore location of the
highest velocity winds, would cause a change in the relative
vorticity: ζ≡∂v/∂x–∂u/∂y. This can be balanced by a change
in stretching vorticity, or geopotential height of the GRS:


-


µ -


⎛
⎝
⎜
⎞
⎠
⎟
v
x
u
y
f
S
T
pp
0
where u and v are the east–west and north–south winds, p is
pressure, f0 is Coriolis parameter, T is temperature and Sp is the
static stability (Holton 1992).
Thus, the calculation of vorticity relies on which estimates of
velocity and size are adopted. Prior studies of the GRS’s
internal wind fields gave varying results, depending on the
method used and time separation between image pairs. In
general, correlation and velocimetry methods give the max-
imum numbers of velocity vectors (e.g., Asay-Davis
et al. 2009; Shetty & Marcus 2010). Manual methods are less
subject to image noise, allowing long time separation image
pairs (and therefore, lower uncertainties), but do not provide
as many vectors. Comparison of manual measurements to
Figure 7. Red spectral slope montage, generated from I/F at 631–502 nm, over time from 2014 (lower left) to 2017 (upper right). Slope is calculated by
100 ∗ (I/F631–I/F502)/Δλ.
8
The Astronomical Journal, 155:151 (13pp), 2018 April Simon et al.
automated methods often shows higher individual vector
velocities, but similar averages in the GRS’s high velocity
collar (Vasavada et al. 1998; Asay-Davis et al. 2009). For
example, manual measurements of Voyager 1979 and Galileo
1996 images both found peak east–west velocities of
∼150 m s−1
, while an average of the correlation results was
130 m s−1
(Sada et al. 1996; Vasavada et al. 1998); north–south
velocities were on the order of 100 m s−1
.
As we are concerned with looking for bulk changes in
relative vorticity, we compared the averages generated from the
automated methods in 1996–2017 and use the locations
of the high velocity peaks in each dimension to determine
size and vorticity across the GRS (Asay-Davis et al. 2009). For
2012–2017, we used a correlation method, UVMAT, (Fincham
& Spedding 1997; Fincham & Delerce 2000) on image pairs
with 20–40 minute separations, checked manually with image
pairs with 10 hr separations; as these values were not as
accurate as a full velocimetry mapping, we assume larger error
bars of ±10 m s−1
in later calculations. The measured peak
velocity within the highest velocity collar of the GRS, the
corresponding average semimajor, a, and semiminor, b, axes,
and the collar “halfwidths” are shown in Table 1. The collar
halfwidths are defined as the distance toward the core over
which the velocity goes from a maximum to zero.
Figure 8. Brightness scans at 889 nm, averaged over a 0°.3 longitude swath at the GRS central longitude. Dotted line indicates the central latitude from Figure 4.
Figure 9. Zonal velocity, u, (left), relative vorticity, ∂u/∂y, (center), and its gradient, uyy, (right) for 2000 (black lines), 2012 (blue lines), 2015 (green), and 2016 (red
lines). Black dashed–dotted lines correspond to the planetary vorticity gradient, β(and −β). Dotted lines mark the latitudes of the bounding wind jets. Gray shading
indicates the extent of the GRS from Cassini (left) to 2016 (right), and dashed lines mark the corresponding uyy for 2000 and 2016.
9
The Astronomical Journal, 155:151 (13pp), 2018 April Simon et al.
The measured collar halfwidths (da, db) are shorter than
semimajor axis lengths (a, b), particularly in older measure-
ments. This discrepancy is an indication of the quiet center, or
hollow nature, of the GRS (e.g., Marcus 1993), because it
means that the circulating winds die down well outside the
geometric center of the vortex. No other vortices on Jupiter, or
the other outer planets, are known to have a quiet center like the
GRS (Mitchell et al. 1981). Our measurements suggest that the
quiet center still remains in 2017, but is significantly smaller
than during the Voyager encounters. Higher-density velocity
fields will be instrumental in investigating the vorticity
structure of the GRS at recent times.
Using Voyager 1 and 2 data, Read et al. (2006b) found that
the relative vorticity and stretching vorticity did not change
much in magnitude with altitude in the upper troposphere,
but the overall shape of the field in the troposphere may be
influenced by other atmospheric features, such as the passage
of Oval BA to the south of the GRS, compressing the wind
field. Table 2, first column, shows a direct calculation of
∂v/∂x−∂u/∂y, found by a simple ratio of average maximum
velocities on each axis (Table 1, Columns 2–5) to GRS
dimensions (Columns 6–7).
The magnitude of the vorticity in other mentioned studies
varied, depending on how the calculation was performed and
which velocities and widths are used (Mitchell et al. 1981; Sada
et al. 1996; Choi et al. 2007; Cheng et al. 2008). For best
comparison with previous studies, we compute the vorticity
around the GRS in polar coordinates and assumed conservative
uncertainties on velocity and size measurements (Mitchell
et al. 1981). To calculate the relative vorticity, ζ, on each
location of an elliptical region:
z q
h
h= +( ) ( )a
a
b
v
dv
da
, 1T
T
2 3
where
h
q q
q q
º
+
+
⎡
⎣
⎢
⎤
⎦
⎥
( )
( )
a b
a b
cos sin
cos sin
2 4 2
2 2 2
1 2
vT is the average tangential velocity and θ is the angle
counterclockwise from E. Thus, along the semimajor axis,
θ=0, η=1, and along the semiminor axis θ=90, and
η=a/b. Mitchell et al. (1981) assumed vT to only be a
function of a, and not b, and used the same collar halfwidth in
both dimensions, while Cheng et al. (2008) neglected the
second term (i.e., dvT/da=0 along the semiminor axis). Both
studies fit functions to vT(a). For simplicity, we assumed that vT
decreases linearly over the collar width, as a true fit requires a
full wind vector map with higher accuracy than is possible from
a simple correlation, and this is left to future work.
In Table 2, we calculated the vorticity (column 2) by a
subtracting the average east–west velocity/semiminor axis
from the average north–south velocity/semimajor axis. We
also calculate vorticity on each axis (columns 3 and 4), using
Equation (1), with the appropriate tangential velocity and collar
halfwidth in each axis in Table 1. Shetty & Marcus (2010)
found that the magnitude of the vorticity did not change much
from 1996 to 2006, even as the area decreased. We find an
overall decrease when looking at ∂v/∂x–∂u/∂y, Table 2,
Column 2. By looking at each axis independently, Figure 10,
we also see that the vorticity on the N/S edges (semiminor
axis) has decreased steadily until the past two years. Vorticity
on the E/W edges (semimajor axis) has also decreased, but not
as rapidly, with a small increase beginning in 2012. It is worth
noting that the vorticity was nearly the same on both axes in
2012, and the magnitude of the E/W edge vorticity passing that
of the N/S in 2014. Improved velocities, and future data points,
can reduce the uncertainties of this trend in recent years.
Table 1
Maximum GRS Velocities, Visible Size, and Dynamical Size
Mission Date ∣ ∣uN (m s−1
) ∣ ∣uS (m s−1
) ∣ ∣vE (m s−1
) ∣ ∣vW (m s−1
) a (km) b (km) da (km) db (km) Area (1013
m2
)
Voyager 1979 (1), (2) 150 150 120 120 9000 4667 4115 2917 13.2
Galileo 1996 (3), (5) 140 130 97 100 6461 4988 3292 2334 10.1
Galileo 2000 (4), (5) 120 150 95 105 6173 4988 3704 2917 9.7
HST2006 (5) 120 130 92 102 5391 4883 3704 3500 8.3
HST 2012 Sep 110 120 100 100 4527 4667 3292 4527 6.6
HST 2015 Jan 90 120 100 100 4939 4667 3704 4939 7.2
HST 2016 Feb 100 110 110 100 4650 4201 3704 4650 6.1
HST 2017 Apr 100 120 100 100 4321 4667 3704 4321 6.3
References. (1) Mitchell et al. (1981), (2) Cheng et al. (2008), (3) Vasavada et al. (1998), (4) Choi et al. (2007), (5) Asay-Davis et al. (2009).
Table 2.
Calculated GRS Vorticity, Circulation, and Rossby Numbers
Mission Date D D D D∣ – ∣v a u b ζN/s ζE/w ζavg Circulation=ζavg/Area Circulation=vT,avg ∗ circum. Ro,a Ro,b
Voyager 1979 3.17 10.78 7.87 9.33 12.31 5.94 0.38 0.07
Galileo 1996 2.59 9.11 5.55 7.33 7.42 4.22 0.19 0.12
Galileo 2000 2.29 7.49 5.18 6.34 6.13 4.13 0.19 0.13
HST 2006 1.99 6.04 4.81 5.43 4.49 3.59 0.17 0.16
HST 2012 1.43 5.08 5.12 5.10 3.38 3.11 0.16 0.20
HST 2015 1.19 4.26 4.97 4.61 3.34 3.09 0.17 0.15
HST 2016 1.32 4.54 5.60 5.07 3.11 2.92 0.21 0.16
HST 2017 1.11 5.11 4.68 4.89 3.10 2.97 0.15 0.21
Note: All vorticities are in units of 10−5
s−1
and circulation is in 109
m2
s−1
.
10
The Astronomical Journal, 155:151 (13pp), 2018 April Simon et al.
The significant changes in vorticity magnitude from 1979 to
2017, Figure 10, must be balanced by changes in GRS
divergence (i.e., radial flow), stretching vorticity (vertical
structure), or some other dissipation mechanism (typically
inertia-gravity waves). Divergence is best measured with more
accurate wind retrievals. It should be noted that the dynamical
area of the GRS has also decreased Figure 10, bottom, along
with the width of the high velocity collar on the semimajor
axis; the width along the semiminor axis has remained nearly
constant. This indicates a smaller region of stagnant flow in the
center, consistent with the changed structure shown in Figure 1.
The circulation can be calculated either as the integral of the
velocity around the circumference or by the vorticity multiplied
by area. Without a closed contour, the integral cannot be
computed, but a sum of the tangential velocities divided by the
circumference is shown in Table 2 (Column 7). To calculate by
vorticity (Column 6), we used the average vorticity over both
axes (Column 5) multiplied by the area in Table 1. In either
case, it has steadily decreased over time. Previous work found
differences between sizes measured using velocity fields,
compared to measurements using color and cloud boundaries
(Simon et al. 2014). The most recent measurements (Table 1
and Figure 3) show dynamical and cloud-based sizes more
closely in agreement than ever before, especially in the
latitudinal direction.
Stretching vorticity can also be calculated directly from the
full velocity and temperature fields with the assumption of
quasi-geostrophic balance (Read et al. 2006b). Comparisons
from Voyager and Cassini did show small variations in ∂p/∂T
(Simon-Miller et al. 2002). Ground-based studies from 2006 to
2008 (Fletcher et al. 2010) also showed some small temper-
ature variations, but further analysis requires more high-
resolution temperature data, in particular since 2012. Determin-
ing the vertical structure requires radiative transfer retrievals
from images at multiple wavelengths and emission angles, and
such a detailed analysis is currently underway for HST data to
compare with retrievals from Galileo data. However, pre-
liminary assessment of brightness changes at altitude sensitive
wavelengths, Figure 8, indicate that such a change in cloud or
haze structure may have occurred. Previous models found that
the internal velocity structure of the GRS was highly dependent
on the vertical structure radius, and in some cases, the quiescent
core disappears (Cho et al. 2001)
Lastly, the Rossby number, Ro=vTa/(b2
η3
f ) can be
calculated along the semimajor and semiminor axes, Table 2,
and is an indication of the validity of assuming geostrophic
balance (Holton 1992). Our Ro values from Voyager match
previous studies (Mitchell et al. 1981) but are lower than Cheng
et al. (2008) for 1996 and 2000, because of the lower average
velocities used in our calculation. We also find the maximum
Ro on the semimajor axis has decreased while it has increased
on the semiminor axis, Table 2. These values are now both
consistent with geostrophic balance, while the 1979 value
along the semiminor axis was more consistent with gradient
balance, where centrifugal force balances Coriolis and pressure
gradients (Mitchell et al. 1981; Holton 1992). However,
changes in Ro can indicate a change in divergence within the
GRS or can result in the generation of inertia-gravity waves
during geostrophic adjustment (Holton 1992). Observing these
Figure 10. Changing GRS vorticity (top), and dynamical area and circulation (bottom). The relative vorticity is calculated at the maximum velocity semimajor (E/W)
and semiminor (N/S) distances (top, red squares and black Xs, respectively) with approximate uncertainties. The dynamical area (bottom, black diamonds) is defined
by the maximum velocity collar’s semimajor and semiminor axes. The circulation is the average relative vorticity multiplied by the area (bottom, blue triangles).
11
The Astronomical Journal, 155:151 (13pp), 2018 April Simon et al.
waves (300 km or smaller) requires spatial resolution higher
than is possible from HST.
However, Juno’s JunoCam images have revealed very
small-scale waves, prominent in highly processed observations
of the GRS made near the Juno spacecraft’s closest approach
on its seventh scientific orbit on 2017 July 11 (https://www.
missionjuno.swri.edu/Vault/VaultOutput?VaultID=10409&t
=1508962497), although their wave type and dispersion has
not yet been determined. They are found just inside the
northern boundary of the GRS around −17.9 to −18°.1, at the
northern edge of where the relative vorticity gradient is near
or exceeds the planetary vorticity gradient (Figure 9, right
panel). Recorded in near-simultaneous broad-band red, green
and blue filters in each image, they are prominent in three
independent images and are not processing artifacts (Hansen
et al. 2017). Separate trains of waves stretch for 2500 km in
the east–west direction and subtend as much as 700 km in the
north–south direction. Individual waves are 35 km in size on
average and are spaced approximately every 70 km. The
image scale per pixel in these images is approximately 11 km.
Comparison with Galileo data sets at similar resolution is
difficult, as those images often had compression artifacts at
highest resolution. Voyager 1 closest approach images, with a
pixel scale of <5 km, did not reveal any wave features of this
scale inside the GRS.
5. Conclusions
Reanalysis of historical data, in concert with the most recent
spacecraft data, shows continued change within Jupiter’s GRS:
1. As measured by color and cloud patterns in optical
images, the longitudinal length has continued to decrease,
as has the latitudinal width, with the GRS becoming
rounder over time.
2. The westward drift rate, relative to the planetary rotation,
has increased steadily since ∼2005.
3. Since 2014, the GRS is darker at wavelengths shorter
than 650 nm and shows less N/S asymmetry over time.
High-altitude structure may have also changed over that
time, causing it to be bright at methane-absorption
wavelengths and darker in the UV.
4. The internal relative vorticity has decreased on both the
semimajor and semiminor axes until 2012, when they
were of the same magnitude.
5. Changing size and internal wind speeds from 1979 to
2017 result in a decreased circulation within the spot,
even as its dynamical areas shrinks.
6. Rossby numbers on the semimajor and semiminor axes
differed by almost an order of magnitude in 1979 but are
now similar.
We find that the size and drift rate of the GRS are tightly
correlated with its location in the wind field and possibly with
changes in background relative vorticity, as it deflects the
surrounding zonal winds. The most recent (2014–2017)
changes in internal cloud morphology and color may be due
to changes in divergence, internal vorticity, and vortex
stretching rather than being correlated to its drift rate. Future
detailed analyses of the vertical cloud structure, temperature
profile, and wind fields will allow better mapping of these
quantities to look for a definitive change in structure tied to one
of these mechanisms. Continued data from the OPAL, and
other HST programs, are crucial to monitoring such changes
within the GRS and understanding its dynamical balance in
Jupiter’s wind field.
This work used data from the NASA/ESA Hubble Space
Telescope, and was supported by grants from the Space
Telescope Science Institute, which is operated by the Associa-
tion of Universities for Research in Astronomy, Inc., under
NASA contract NAS 5-26555. These observations are associated
with programs GO5313, GO5642, GO6009, GO6141, GO6452,
GO11096, GO11102, GO11498, GO12003, GO12045,
GO13067, GO13631, GO13937/14334/14756, and GO14661.
Jupiter maps are available athttps://archive.stsci.edu/prepds/
opal/ andhttps://archive.stsci.edu/prepds/wfcj/. We thank
Kelly Beatty for discussing recent trends in drift rate, prompting
some of this investigation, and Gerald Eichstaedt for his rapid
processing of JunoCam images to enhance important details. We
thank Agustin Sanchez-Lavega for a detailed and thorough
review of this manuscript.
ORCID iDs
Amy A. Simon https://orcid.org/0000-0003-4641-6186
Michael H. Wong https://orcid.org/0000-0003-2804-5086
References
Asay-Davis, X. S., Marcus, P., Wong, M. H., & de Pater, I. 2009, Icar,
203, 164
Asay-Davis, X. S., Marcus, P., Wong, M. H., & de Pater, I. 2011, Icar,
211, 1215
Beebe, R. F., Orton, G. S., & West, R. A. 1989, Time Variable Phenomenon in
the Jovian System, NASA SP-494, 245
Beebe, R. F., & Youngblood, L. A. 1979, Natur, 280, 771
Cassini, C. F. 1666, Philos. Trans. R. Soc. London, 1, 143
Cheng, A. F., Simon-Miller, A. A., Weaver, H. A., et al. 2008, AJ, 135, 2446
Cho, J. Y.-K., de la Torre Juarez, M., Ingersoll, A. P., & Dritschel, D. G. 2001,
JGR, 106, 5099
Choi, D. S., Banfield, D., Gierasch, P., & Showman, A. P. 2007, Icar, 188, 35
Colina, L., Bohlin, R. C., & Castelli, F. 1996, AJ, 112, 307
Conrath, B. J., Flasar, F. M., Pirraglia, J., Gierasch, P., & Hunt, G. 1981, JGR,
86, 8769
Denning, W. F. 1898, MNRAS, 58, 480
Deustua, S. E., Mack, J., Bajaj, V., & Khandrika, H. 2017, WFC3/UVIS
Updated 2017 Chip-Dependent Inverse Sensitivity Values (WFC3 ISR
2017-14) (Baltimore, MD: STScI)
Deustua, S. E., Mack, J., Bowers, A. S., et al. 2016, UVIS 2.0 Chip-dependent
Inverse Sensitivity Values (WFC3 ISR 2016-03) (Baltimore, MD: STScI)
Fimmel, R. O., Van Allen, J., & Burgess, E. 1980, Pioneer: First to Jupiter,
Saturn and Beyond, NASA SP-446, 26
Fincham, A., & Delerce, G. 2000, ExFl, 29, S013
Fincham, A. M., & Spedding, G. R. 1997, ExFl, 23, 449
Fletcher, L. N., Orton, G. S., Mousis, O., et al. 2010, Icar, 208, 306
Gierasch, P. J., Conrath, B. J., & Magalhaes, J. A. 1986, Icar, 67, 456
Gonzaga, S., Brammer, G., Heyer, I., et al. 2006, WFPC2 Standard Star
Monitoring Memo, STScI Tech. Rep., http://www.stsci.edu/hst/wfpc2/
analysis/wfpc2_stdstar_phot3.html
Guitar, H. 1984, PhD dissertation, New Mexico State Univ.
Hansen, C. J., Caplinger, M. A., Ingersoll, A., et al. 2017, SSRv, 213, 475
Holton, J. R. 1992, An Introduction to Dynamic Meteorology (3rd ed.; New
York: Academic)
Hooke, R. 1665, Philos. Trans. R. Soc. London, 1, 3
Irwin, P. G. J., Wong, M. H., Simon, A. A., Orton, G. S., & Toledo, D. 2017,
Icar, 288, 99
Karkoschka, E. 1998, Icar, 133, 134
Marcus, P. S. 1993, ARA&A, 31, 523
Mitchell, J. L., Beebe, R. F., Ingersoll, A. P., & Garneau, G. W. 1981, JGR,
86, 8751
Peek, B. M. 1958, The Planet Jupiter (London: Faber and Faber)
Porco, C. C., West, R. A., McEwen, A., et al. 2003, Sci, 299, 1541
Read, P. L., Gierasch, P. J., Conrath, B. J., et al. 2006a, QJRMS, 132, 1577
Read, P. L., Gierasch, P. J., & Conrath, B. J. 2006b, QJRMS, 132, 1605
12
The Astronomical Journal, 155:151 (13pp), 2018 April Simon et al.
Reese, E. J. 1971, Icar, 14, 343
Reese, E. J., & Solberg, H. G., Jr. 1966, Icar, 5, 266
Rogers, J. H. 1995, The Giant Planet Jupiter (Cambridge: Cambridge Univ.
Press)
Sada, P. V., Beebe, R. F., & Conrath, B. J. 1996, Icar, 119, 311
Sánchez-Lavega, A., Hueso, R., Lecacheux, J., et al. 1998, Icar, 136, 14
Sanchez-Lavega, A., Legarreta, J., Garcia-Melendo, E., et al. 2013, JGRE,
118, 1
Shetty, S., & Marcus, P. S. 2010, Icar, 210, 182
Simon, A. A., Sanchez-Lavega, A., Legarreta, J., et al. 2015a, JGRE, 120, 483
Simon, A. A., Wong, M. H., & Orton, G. S. 2015b, ApJ, 812, 55
Simon, A. A., Wong, M. H., Rogers, J. H., et al. 2014, ApJL, 797, L31
Simon-Miller, A. A., Conrath, B. J., Gierasch, P. J., et al. 2006, Icar, 180, 98
Simon-Miller, A. A., & Gierasch, P. J. 2010, Icar, 210, 258
Simon-Miller, A. A., Gierasch, P. J., Beebe, R. F., et al. 2002, Icar, 158, 249
Smith, B. A., Soderblom, L. A., Beebe, R. F., et al. 1979, Sci, 206, 927
Tollefson, J., Wong, M. H., de Pater, I., et al. 2017, Icar, 296, 163
Trigo-Rodriguez, J. M., Sanchez-Lavega, A., Gomez, J. M., et al. 2000, P&SS,
48, 331
Vasavada, A. R., Ingersoll, A. P., Banfield, D., et al. 1998, Icar, 135, 265
Wong, M. H. 2011, in Proc. 2010, Fringing in the WFC3/UVIS Detector
(Baltimore, MD: STScI Calibration Workshop)
13
The Astronomical Journal, 155:151 (13pp), 2018 April Simon et al.

More Related Content

What's hot

On the possibility of through passage of asteroid bodies across the Earth’s a...
On the possibility of through passage of asteroid bodies across the Earth’s a...On the possibility of through passage of asteroid bodies across the Earth’s a...
On the possibility of through passage of asteroid bodies across the Earth’s a...Sérgio Sacani
 
Surface and soil moisture monitoring, estimations, variations, and retrievals
Surface and soil moisture monitoring, estimations, variations, and retrievalsSurface and soil moisture monitoring, estimations, variations, and retrievals
Surface and soil moisture monitoring, estimations, variations, and retrievalsJenkins Macedo
 
Pages from AAS_ST55-Sep-Oct_Final-for-AAS-Website_pages_4-16
Pages from AAS_ST55-Sep-Oct_Final-for-AAS-Website_pages_4-16Pages from AAS_ST55-Sep-Oct_Final-for-AAS-Website_pages_4-16
Pages from AAS_ST55-Sep-Oct_Final-for-AAS-Website_pages_4-16Michelangelo Ambrosini
 
Gps geodetic cors
Gps geodetic corsGps geodetic cors
Gps geodetic corsAlam survey
 
Presentation thesis
Presentation thesisPresentation thesis
Presentation thesiss1150048
 
Gravity Predictions for Earthquakes
Gravity Predictions for EarthquakesGravity Predictions for Earthquakes
Gravity Predictions for EarthquakesProfDrAliOsmanncel
 
IGARSS11_HongboSu_ver3.ppt
IGARSS11_HongboSu_ver3.pptIGARSS11_HongboSu_ver3.ppt
IGARSS11_HongboSu_ver3.pptgrssieee
 
Solaro_IGARSS_2011.ppt
Solaro_IGARSS_2011.pptSolaro_IGARSS_2011.ppt
Solaro_IGARSS_2011.pptgrssieee
 
Modification and Climate Change Analysis of surrounding Environment using Rem...
Modification and Climate Change Analysis of surrounding Environment using Rem...Modification and Climate Change Analysis of surrounding Environment using Rem...
Modification and Climate Change Analysis of surrounding Environment using Rem...iosrjce
 
Sakkas.ppt
Sakkas.pptSakkas.ppt
Sakkas.pptgrssieee
 
AGUposter2014floesizedist
AGUposter2014floesizedistAGUposter2014floesizedist
AGUposter2014floesizedistMargaret Stark
 
PROBING FOR EVIDENCE OF PLUMES ON EUROPA WITH HST/STIS
PROBING FOR EVIDENCE OF PLUMES ON EUROPA WITH HST/STISPROBING FOR EVIDENCE OF PLUMES ON EUROPA WITH HST/STIS
PROBING FOR EVIDENCE OF PLUMES ON EUROPA WITH HST/STISSérgio Sacani
 
On some structural_features_of_the_metagalaxy
On some structural_features_of_the_metagalaxyOn some structural_features_of_the_metagalaxy
On some structural_features_of_the_metagalaxySérgio Sacani
 
A global reference model of the lithosphere and upper mantle from joint inver...
A global reference model of the lithosphere and upper mantle from joint inver...A global reference model of the lithosphere and upper mantle from joint inver...
A global reference model of the lithosphere and upper mantle from joint inver...Sérgio Sacani
 
The muse 3_d_view_of_the_hubble_deep_field_south
The muse 3_d_view_of_the_hubble_deep_field_southThe muse 3_d_view_of_the_hubble_deep_field_south
The muse 3_d_view_of_the_hubble_deep_field_southSérgio Sacani
 
Galaxy dynamics and the mass density of the universe
Galaxy dynamics and the mass density of the universeGalaxy dynamics and the mass density of the universe
Galaxy dynamics and the mass density of the universeSérgio Sacani
 
A highly magnetized twin-jet base pinpoints a supermassive black hole
A highly magnetized twin-jet base pinpoints a supermassive black holeA highly magnetized twin-jet base pinpoints a supermassive black hole
A highly magnetized twin-jet base pinpoints a supermassive black holeSérgio Sacani
 

What's hot (20)

ESPL1351
ESPL1351ESPL1351
ESPL1351
 
Seismic Risk in Turkey
Seismic Risk in TurkeySeismic Risk in Turkey
Seismic Risk in Turkey
 
On the possibility of through passage of asteroid bodies across the Earth’s a...
On the possibility of through passage of asteroid bodies across the Earth’s a...On the possibility of through passage of asteroid bodies across the Earth’s a...
On the possibility of through passage of asteroid bodies across the Earth’s a...
 
Surface and soil moisture monitoring, estimations, variations, and retrievals
Surface and soil moisture monitoring, estimations, variations, and retrievalsSurface and soil moisture monitoring, estimations, variations, and retrievals
Surface and soil moisture monitoring, estimations, variations, and retrievals
 
Pages from AAS_ST55-Sep-Oct_Final-for-AAS-Website_pages_4-16
Pages from AAS_ST55-Sep-Oct_Final-for-AAS-Website_pages_4-16Pages from AAS_ST55-Sep-Oct_Final-for-AAS-Website_pages_4-16
Pages from AAS_ST55-Sep-Oct_Final-for-AAS-Website_pages_4-16
 
Gps geodetic cors
Gps geodetic corsGps geodetic cors
Gps geodetic cors
 
Presentation thesis
Presentation thesisPresentation thesis
Presentation thesis
 
Gravity Predictions for Earthquakes
Gravity Predictions for EarthquakesGravity Predictions for Earthquakes
Gravity Predictions for Earthquakes
 
IGARSS11_HongboSu_ver3.ppt
IGARSS11_HongboSu_ver3.pptIGARSS11_HongboSu_ver3.ppt
IGARSS11_HongboSu_ver3.ppt
 
Solaro_IGARSS_2011.ppt
Solaro_IGARSS_2011.pptSolaro_IGARSS_2011.ppt
Solaro_IGARSS_2011.ppt
 
Mercator Ocean newsletter 25
Mercator Ocean newsletter 25Mercator Ocean newsletter 25
Mercator Ocean newsletter 25
 
Modification and Climate Change Analysis of surrounding Environment using Rem...
Modification and Climate Change Analysis of surrounding Environment using Rem...Modification and Climate Change Analysis of surrounding Environment using Rem...
Modification and Climate Change Analysis of surrounding Environment using Rem...
 
Sakkas.ppt
Sakkas.pptSakkas.ppt
Sakkas.ppt
 
AGUposter2014floesizedist
AGUposter2014floesizedistAGUposter2014floesizedist
AGUposter2014floesizedist
 
PROBING FOR EVIDENCE OF PLUMES ON EUROPA WITH HST/STIS
PROBING FOR EVIDENCE OF PLUMES ON EUROPA WITH HST/STISPROBING FOR EVIDENCE OF PLUMES ON EUROPA WITH HST/STIS
PROBING FOR EVIDENCE OF PLUMES ON EUROPA WITH HST/STIS
 
On some structural_features_of_the_metagalaxy
On some structural_features_of_the_metagalaxyOn some structural_features_of_the_metagalaxy
On some structural_features_of_the_metagalaxy
 
A global reference model of the lithosphere and upper mantle from joint inver...
A global reference model of the lithosphere and upper mantle from joint inver...A global reference model of the lithosphere and upper mantle from joint inver...
A global reference model of the lithosphere and upper mantle from joint inver...
 
The muse 3_d_view_of_the_hubble_deep_field_south
The muse 3_d_view_of_the_hubble_deep_field_southThe muse 3_d_view_of_the_hubble_deep_field_south
The muse 3_d_view_of_the_hubble_deep_field_south
 
Galaxy dynamics and the mass density of the universe
Galaxy dynamics and the mass density of the universeGalaxy dynamics and the mass density of the universe
Galaxy dynamics and the mass density of the universe
 
A highly magnetized twin-jet base pinpoints a supermassive black hole
A highly magnetized twin-jet base pinpoints a supermassive black holeA highly magnetized twin-jet base pinpoints a supermassive black hole
A highly magnetized twin-jet base pinpoints a supermassive black hole
 

Similar to Historical and Contemporary Trends in the Size, Drift, and Color of Jupiterʼs Great Red Spot

High-resolution UV/Optical/IR Imaging of Jupiter in 2016–2019
High-resolution UV/Optical/IR Imaging of Jupiter in 2016–2019High-resolution UV/Optical/IR Imaging of Jupiter in 2016–2019
High-resolution UV/Optical/IR Imaging of Jupiter in 2016–2019Sérgio Sacani
 
A precise water_abundance_measurement_for_the_hot_jupiter_wasp_43b
A precise water_abundance_measurement_for_the_hot_jupiter_wasp_43bA precise water_abundance_measurement_for_the_hot_jupiter_wasp_43b
A precise water_abundance_measurement_for_the_hot_jupiter_wasp_43bSérgio Sacani
 
Imaging the Milky Way with Millihertz Gravitational Waves
Imaging the Milky Way with Millihertz Gravitational WavesImaging the Milky Way with Millihertz Gravitational Waves
Imaging the Milky Way with Millihertz Gravitational WavesSérgio Sacani
 
Exoplanet transit spectroscopy_using_wfc3
Exoplanet transit spectroscopy_using_wfc3Exoplanet transit spectroscopy_using_wfc3
Exoplanet transit spectroscopy_using_wfc3Sérgio Sacani
 
Application+of+deep+learning+to+estimate+stratospheric+gravity+wave+potential...
Application+of+deep+learning+to+estimate+stratospheric+gravity+wave+potential...Application+of+deep+learning+to+estimate+stratospheric+gravity+wave+potential...
Application+of+deep+learning+to+estimate+stratospheric+gravity+wave+potential...TundeAyorinde
 
First Observation of the Earth’s Permanent FreeOscillation s on Ocean Bottom ...
First Observation of the Earth’s Permanent FreeOscillation s on Ocean Bottom ...First Observation of the Earth’s Permanent FreeOscillation s on Ocean Bottom ...
First Observation of the Earth’s Permanent FreeOscillation s on Ocean Bottom ...Sérgio Sacani
 
Mapping the Skies of Ultracool Worlds: Detecting Storms and Spots with Extrem...
Mapping the Skies of Ultracool Worlds: Detecting Storms and Spots with Extrem...Mapping the Skies of Ultracool Worlds: Detecting Storms and Spots with Extrem...
Mapping the Skies of Ultracool Worlds: Detecting Storms and Spots with Extrem...Sérgio Sacani
 
Two super-Earths at the edge of the habitable zone of the nearby M dwarf TOI-...
Two super-Earths at the edge of the habitable zone of the nearby M dwarf TOI-...Two super-Earths at the edge of the habitable zone of the nearby M dwarf TOI-...
Two super-Earths at the edge of the habitable zone of the nearby M dwarf TOI-...Sérgio Sacani
 
08 gray mass motions in the photosphere of betelgeuse
08 gray mass motions in the photosphere of betelgeuse08 gray mass motions in the photosphere of betelgeuse
08 gray mass motions in the photosphere of betelgeuseLeonardo García
 
Multicomponent Seismic - A Measure_of_Full-wave_Motion
Multicomponent Seismic - A Measure_of_Full-wave_MotionMulticomponent Seismic - A Measure_of_Full-wave_Motion
Multicomponent Seismic - A Measure_of_Full-wave_MotionRobert Stewart
 
Final Year Project - Observation and Characterisation of Exoplanets
Final Year Project - Observation and Characterisation of ExoplanetsFinal Year Project - Observation and Characterisation of Exoplanets
Final Year Project - Observation and Characterisation of ExoplanetsLucy Stickland
 
The parkes hi zone of avoidance survey
The parkes hi zone of avoidance surveyThe parkes hi zone of avoidance survey
The parkes hi zone of avoidance surveySérgio Sacani
 
Change detection process and techniques
Change detection process and techniquesChange detection process and techniques
Change detection process and techniquesAlexander Decker
 
Infrared transmission spectroscopy_of_the_exoplanets
Infrared transmission spectroscopy_of_the_exoplanetsInfrared transmission spectroscopy_of_the_exoplanets
Infrared transmission spectroscopy_of_the_exoplanetsSérgio Sacani
 
A candidate super-Earth planet orbiting near the snow line of Barnard’s star
A candidate super-Earth planet orbiting near the snow line of Barnard’s starA candidate super-Earth planet orbiting near the snow line of Barnard’s star
A candidate super-Earth planet orbiting near the snow line of Barnard’s starSérgio Sacani
 
Fifteen years of_xmm_newton_and_chandra_monitoring_of_sgr_a_evidence_for_a_re...
Fifteen years of_xmm_newton_and_chandra_monitoring_of_sgr_a_evidence_for_a_re...Fifteen years of_xmm_newton_and_chandra_monitoring_of_sgr_a_evidence_for_a_re...
Fifteen years of_xmm_newton_and_chandra_monitoring_of_sgr_a_evidence_for_a_re...Sérgio Sacani
 

Similar to Historical and Contemporary Trends in the Size, Drift, and Color of Jupiterʼs Great Red Spot (20)

High-resolution UV/Optical/IR Imaging of Jupiter in 2016–2019
High-resolution UV/Optical/IR Imaging of Jupiter in 2016–2019High-resolution UV/Optical/IR Imaging of Jupiter in 2016–2019
High-resolution UV/Optical/IR Imaging of Jupiter in 2016–2019
 
A precise water_abundance_measurement_for_the_hot_jupiter_wasp_43b
A precise water_abundance_measurement_for_the_hot_jupiter_wasp_43bA precise water_abundance_measurement_for_the_hot_jupiter_wasp_43b
A precise water_abundance_measurement_for_the_hot_jupiter_wasp_43b
 
Imaging the Milky Way with Millihertz Gravitational Waves
Imaging the Milky Way with Millihertz Gravitational WavesImaging the Milky Way with Millihertz Gravitational Waves
Imaging the Milky Way with Millihertz Gravitational Waves
 
Exoplanet transit spectroscopy_using_wfc3
Exoplanet transit spectroscopy_using_wfc3Exoplanet transit spectroscopy_using_wfc3
Exoplanet transit spectroscopy_using_wfc3
 
Application+of+deep+learning+to+estimate+stratospheric+gravity+wave+potential...
Application+of+deep+learning+to+estimate+stratospheric+gravity+wave+potential...Application+of+deep+learning+to+estimate+stratospheric+gravity+wave+potential...
Application+of+deep+learning+to+estimate+stratospheric+gravity+wave+potential...
 
Poster_jayson_v3
Poster_jayson_v3Poster_jayson_v3
Poster_jayson_v3
 
First Observation of the Earth’s Permanent FreeOscillation s on Ocean Bottom ...
First Observation of the Earth’s Permanent FreeOscillation s on Ocean Bottom ...First Observation of the Earth’s Permanent FreeOscillation s on Ocean Bottom ...
First Observation of the Earth’s Permanent FreeOscillation s on Ocean Bottom ...
 
Mapping the Skies of Ultracool Worlds: Detecting Storms and Spots with Extrem...
Mapping the Skies of Ultracool Worlds: Detecting Storms and Spots with Extrem...Mapping the Skies of Ultracool Worlds: Detecting Storms and Spots with Extrem...
Mapping the Skies of Ultracool Worlds: Detecting Storms and Spots with Extrem...
 
Two super-Earths at the edge of the habitable zone of the nearby M dwarf TOI-...
Two super-Earths at the edge of the habitable zone of the nearby M dwarf TOI-...Two super-Earths at the edge of the habitable zone of the nearby M dwarf TOI-...
Two super-Earths at the edge of the habitable zone of the nearby M dwarf TOI-...
 
08 gray mass motions in the photosphere of betelgeuse
08 gray mass motions in the photosphere of betelgeuse08 gray mass motions in the photosphere of betelgeuse
08 gray mass motions in the photosphere of betelgeuse
 
Multicomponent Seismic - A Measure_of_Full-wave_Motion
Multicomponent Seismic - A Measure_of_Full-wave_MotionMulticomponent Seismic - A Measure_of_Full-wave_Motion
Multicomponent Seismic - A Measure_of_Full-wave_Motion
 
Final Year Project - Observation and Characterisation of Exoplanets
Final Year Project - Observation and Characterisation of ExoplanetsFinal Year Project - Observation and Characterisation of Exoplanets
Final Year Project - Observation and Characterisation of Exoplanets
 
CEDAR2014-McMurdo
CEDAR2014-McMurdoCEDAR2014-McMurdo
CEDAR2014-McMurdo
 
The parkes hi zone of avoidance survey
The parkes hi zone of avoidance surveyThe parkes hi zone of avoidance survey
The parkes hi zone of avoidance survey
 
WHO - V Filotev.ppt
WHO - V Filotev.pptWHO - V Filotev.ppt
WHO - V Filotev.ppt
 
apj_825_1_40
apj_825_1_40apj_825_1_40
apj_825_1_40
 
Change detection process and techniques
Change detection process and techniquesChange detection process and techniques
Change detection process and techniques
 
Infrared transmission spectroscopy_of_the_exoplanets
Infrared transmission spectroscopy_of_the_exoplanetsInfrared transmission spectroscopy_of_the_exoplanets
Infrared transmission spectroscopy_of_the_exoplanets
 
A candidate super-Earth planet orbiting near the snow line of Barnard’s star
A candidate super-Earth planet orbiting near the snow line of Barnard’s starA candidate super-Earth planet orbiting near the snow line of Barnard’s star
A candidate super-Earth planet orbiting near the snow line of Barnard’s star
 
Fifteen years of_xmm_newton_and_chandra_monitoring_of_sgr_a_evidence_for_a_re...
Fifteen years of_xmm_newton_and_chandra_monitoring_of_sgr_a_evidence_for_a_re...Fifteen years of_xmm_newton_and_chandra_monitoring_of_sgr_a_evidence_for_a_re...
Fifteen years of_xmm_newton_and_chandra_monitoring_of_sgr_a_evidence_for_a_re...
 

More from Sérgio Sacani

Formation of low mass protostars and their circumstellar disks
Formation of low mass protostars and their circumstellar disksFormation of low mass protostars and their circumstellar disks
Formation of low mass protostars and their circumstellar disksSérgio Sacani
 
Nightside clouds and disequilibrium chemistry on the hot Jupiter WASP-43b
Nightside clouds and disequilibrium chemistry on the hot Jupiter WASP-43bNightside clouds and disequilibrium chemistry on the hot Jupiter WASP-43b
Nightside clouds and disequilibrium chemistry on the hot Jupiter WASP-43bSérgio Sacani
 
Discovery of an Accretion Streamer and a Slow Wide-angle Outflow around FUOri...
Discovery of an Accretion Streamer and a Slow Wide-angle Outflow around FUOri...Discovery of an Accretion Streamer and a Slow Wide-angle Outflow around FUOri...
Discovery of an Accretion Streamer and a Slow Wide-angle Outflow around FUOri...Sérgio Sacani
 
Disentangling the origin of chemical differences using GHOST
Disentangling the origin of chemical differences using GHOSTDisentangling the origin of chemical differences using GHOST
Disentangling the origin of chemical differences using GHOSTSérgio Sacani
 
All-domain Anomaly Resolution Office U.S. Department of Defense (U) Case: “Eg...
All-domain Anomaly Resolution Office U.S. Department of Defense (U) Case: “Eg...All-domain Anomaly Resolution Office U.S. Department of Defense (U) Case: “Eg...
All-domain Anomaly Resolution Office U.S. Department of Defense (U) Case: “Eg...Sérgio Sacani
 
PossibleEoarcheanRecordsoftheGeomagneticFieldPreservedintheIsuaSupracrustalBe...
PossibleEoarcheanRecordsoftheGeomagneticFieldPreservedintheIsuaSupracrustalBe...PossibleEoarcheanRecordsoftheGeomagneticFieldPreservedintheIsuaSupracrustalBe...
PossibleEoarcheanRecordsoftheGeomagneticFieldPreservedintheIsuaSupracrustalBe...Sérgio Sacani
 
Isotopic evidence of long-lived volcanism on Io
Isotopic evidence of long-lived volcanism on IoIsotopic evidence of long-lived volcanism on Io
Isotopic evidence of long-lived volcanism on IoSérgio Sacani
 
Hubble Asteroid Hunter III. Physical properties of newly found asteroids
Hubble Asteroid Hunter III. Physical properties of newly found asteroidsHubble Asteroid Hunter III. Physical properties of newly found asteroids
Hubble Asteroid Hunter III. Physical properties of newly found asteroidsSérgio Sacani
 
Observational constraints on mergers creating magnetism in massive stars
Observational constraints on mergers creating magnetism in massive starsObservational constraints on mergers creating magnetism in massive stars
Observational constraints on mergers creating magnetism in massive starsSérgio Sacani
 
Observation of Gravitational Waves from the Coalescence of a 2.5–4.5 M⊙ Compa...
Observation of Gravitational Waves from the Coalescence of a 2.5–4.5 M⊙ Compa...Observation of Gravitational Waves from the Coalescence of a 2.5–4.5 M⊙ Compa...
Observation of Gravitational Waves from the Coalescence of a 2.5–4.5 M⊙ Compa...Sérgio Sacani
 
The SAMI Galaxy Sur v ey: galaxy spin is more strongly correlated with stella...
The SAMI Galaxy Sur v ey: galaxy spin is more strongly correlated with stella...The SAMI Galaxy Sur v ey: galaxy spin is more strongly correlated with stella...
The SAMI Galaxy Sur v ey: galaxy spin is more strongly correlated with stella...Sérgio Sacani
 
Is Betelgeuse Really Rotating? Synthetic ALMA Observations of Large-scale Con...
Is Betelgeuse Really Rotating? Synthetic ALMA Observations of Large-scale Con...Is Betelgeuse Really Rotating? Synthetic ALMA Observations of Large-scale Con...
Is Betelgeuse Really Rotating? Synthetic ALMA Observations of Large-scale Con...Sérgio Sacani
 
First Direct Imaging of a Kelvin–Helmholtz Instability by PSP/WISPR
First Direct Imaging of a Kelvin–Helmholtz Instability by PSP/WISPRFirst Direct Imaging of a Kelvin–Helmholtz Instability by PSP/WISPR
First Direct Imaging of a Kelvin–Helmholtz Instability by PSP/WISPRSérgio Sacani
 
The Sun’s differential rotation is controlled by high- latitude baroclinicall...
The Sun’s differential rotation is controlled by high- latitude baroclinicall...The Sun’s differential rotation is controlled by high- latitude baroclinicall...
The Sun’s differential rotation is controlled by high- latitude baroclinicall...Sérgio Sacani
 
Hydrogen Column Density Variability in a Sample of Local Compton-Thin AGN
Hydrogen Column Density Variability in a Sample of Local Compton-Thin AGNHydrogen Column Density Variability in a Sample of Local Compton-Thin AGN
Hydrogen Column Density Variability in a Sample of Local Compton-Thin AGNSérgio Sacani
 
Huygens - Exploring Titan A Mysterious World
Huygens - Exploring Titan A Mysterious WorldHuygens - Exploring Titan A Mysterious World
Huygens - Exploring Titan A Mysterious WorldSérgio Sacani
 
The Radcliffe Wave Of Milk Way is oscillating
The Radcliffe Wave Of Milk Way  is oscillatingThe Radcliffe Wave Of Milk Way  is oscillating
The Radcliffe Wave Of Milk Way is oscillatingSérgio Sacani
 
Thermonuclear explosions on neutron stars reveal the speed of their jets
Thermonuclear explosions on neutron stars reveal the speed of their jetsThermonuclear explosions on neutron stars reveal the speed of their jets
Thermonuclear explosions on neutron stars reveal the speed of their jetsSérgio Sacani
 
Identification of Superclusters and Their Properties in the Sloan Digital Sky...
Identification of Superclusters and Their Properties in the Sloan Digital Sky...Identification of Superclusters and Their Properties in the Sloan Digital Sky...
Identification of Superclusters and Their Properties in the Sloan Digital Sky...Sérgio Sacani
 
Digitized Continuous Magnetic Recordings for the August/September 1859 Storms...
Digitized Continuous Magnetic Recordings for the August/September 1859 Storms...Digitized Continuous Magnetic Recordings for the August/September 1859 Storms...
Digitized Continuous Magnetic Recordings for the August/September 1859 Storms...Sérgio Sacani
 

More from Sérgio Sacani (20)

Formation of low mass protostars and their circumstellar disks
Formation of low mass protostars and their circumstellar disksFormation of low mass protostars and their circumstellar disks
Formation of low mass protostars and their circumstellar disks
 
Nightside clouds and disequilibrium chemistry on the hot Jupiter WASP-43b
Nightside clouds and disequilibrium chemistry on the hot Jupiter WASP-43bNightside clouds and disequilibrium chemistry on the hot Jupiter WASP-43b
Nightside clouds and disequilibrium chemistry on the hot Jupiter WASP-43b
 
Discovery of an Accretion Streamer and a Slow Wide-angle Outflow around FUOri...
Discovery of an Accretion Streamer and a Slow Wide-angle Outflow around FUOri...Discovery of an Accretion Streamer and a Slow Wide-angle Outflow around FUOri...
Discovery of an Accretion Streamer and a Slow Wide-angle Outflow around FUOri...
 
Disentangling the origin of chemical differences using GHOST
Disentangling the origin of chemical differences using GHOSTDisentangling the origin of chemical differences using GHOST
Disentangling the origin of chemical differences using GHOST
 
All-domain Anomaly Resolution Office U.S. Department of Defense (U) Case: “Eg...
All-domain Anomaly Resolution Office U.S. Department of Defense (U) Case: “Eg...All-domain Anomaly Resolution Office U.S. Department of Defense (U) Case: “Eg...
All-domain Anomaly Resolution Office U.S. Department of Defense (U) Case: “Eg...
 
PossibleEoarcheanRecordsoftheGeomagneticFieldPreservedintheIsuaSupracrustalBe...
PossibleEoarcheanRecordsoftheGeomagneticFieldPreservedintheIsuaSupracrustalBe...PossibleEoarcheanRecordsoftheGeomagneticFieldPreservedintheIsuaSupracrustalBe...
PossibleEoarcheanRecordsoftheGeomagneticFieldPreservedintheIsuaSupracrustalBe...
 
Isotopic evidence of long-lived volcanism on Io
Isotopic evidence of long-lived volcanism on IoIsotopic evidence of long-lived volcanism on Io
Isotopic evidence of long-lived volcanism on Io
 
Hubble Asteroid Hunter III. Physical properties of newly found asteroids
Hubble Asteroid Hunter III. Physical properties of newly found asteroidsHubble Asteroid Hunter III. Physical properties of newly found asteroids
Hubble Asteroid Hunter III. Physical properties of newly found asteroids
 
Observational constraints on mergers creating magnetism in massive stars
Observational constraints on mergers creating magnetism in massive starsObservational constraints on mergers creating magnetism in massive stars
Observational constraints on mergers creating magnetism in massive stars
 
Observation of Gravitational Waves from the Coalescence of a 2.5–4.5 M⊙ Compa...
Observation of Gravitational Waves from the Coalescence of a 2.5–4.5 M⊙ Compa...Observation of Gravitational Waves from the Coalescence of a 2.5–4.5 M⊙ Compa...
Observation of Gravitational Waves from the Coalescence of a 2.5–4.5 M⊙ Compa...
 
The SAMI Galaxy Sur v ey: galaxy spin is more strongly correlated with stella...
The SAMI Galaxy Sur v ey: galaxy spin is more strongly correlated with stella...The SAMI Galaxy Sur v ey: galaxy spin is more strongly correlated with stella...
The SAMI Galaxy Sur v ey: galaxy spin is more strongly correlated with stella...
 
Is Betelgeuse Really Rotating? Synthetic ALMA Observations of Large-scale Con...
Is Betelgeuse Really Rotating? Synthetic ALMA Observations of Large-scale Con...Is Betelgeuse Really Rotating? Synthetic ALMA Observations of Large-scale Con...
Is Betelgeuse Really Rotating? Synthetic ALMA Observations of Large-scale Con...
 
First Direct Imaging of a Kelvin–Helmholtz Instability by PSP/WISPR
First Direct Imaging of a Kelvin–Helmholtz Instability by PSP/WISPRFirst Direct Imaging of a Kelvin–Helmholtz Instability by PSP/WISPR
First Direct Imaging of a Kelvin–Helmholtz Instability by PSP/WISPR
 
The Sun’s differential rotation is controlled by high- latitude baroclinicall...
The Sun’s differential rotation is controlled by high- latitude baroclinicall...The Sun’s differential rotation is controlled by high- latitude baroclinicall...
The Sun’s differential rotation is controlled by high- latitude baroclinicall...
 
Hydrogen Column Density Variability in a Sample of Local Compton-Thin AGN
Hydrogen Column Density Variability in a Sample of Local Compton-Thin AGNHydrogen Column Density Variability in a Sample of Local Compton-Thin AGN
Hydrogen Column Density Variability in a Sample of Local Compton-Thin AGN
 
Huygens - Exploring Titan A Mysterious World
Huygens - Exploring Titan A Mysterious WorldHuygens - Exploring Titan A Mysterious World
Huygens - Exploring Titan A Mysterious World
 
The Radcliffe Wave Of Milk Way is oscillating
The Radcliffe Wave Of Milk Way  is oscillatingThe Radcliffe Wave Of Milk Way  is oscillating
The Radcliffe Wave Of Milk Way is oscillating
 
Thermonuclear explosions on neutron stars reveal the speed of their jets
Thermonuclear explosions on neutron stars reveal the speed of their jetsThermonuclear explosions on neutron stars reveal the speed of their jets
Thermonuclear explosions on neutron stars reveal the speed of their jets
 
Identification of Superclusters and Their Properties in the Sloan Digital Sky...
Identification of Superclusters and Their Properties in the Sloan Digital Sky...Identification of Superclusters and Their Properties in the Sloan Digital Sky...
Identification of Superclusters and Their Properties in the Sloan Digital Sky...
 
Digitized Continuous Magnetic Recordings for the August/September 1859 Storms...
Digitized Continuous Magnetic Recordings for the August/September 1859 Storms...Digitized Continuous Magnetic Recordings for the August/September 1859 Storms...
Digitized Continuous Magnetic Recordings for the August/September 1859 Storms...
 

Recently uploaded

Biological Classification BioHack (3).pdf
Biological Classification BioHack (3).pdfBiological Classification BioHack (3).pdf
Biological Classification BioHack (3).pdfmuntazimhurra
 
Spermiogenesis or Spermateleosis or metamorphosis of spermatid
Spermiogenesis or Spermateleosis or metamorphosis of spermatidSpermiogenesis or Spermateleosis or metamorphosis of spermatid
Spermiogenesis or Spermateleosis or metamorphosis of spermatidSarthak Sekhar Mondal
 
Analytical Profile of Coleus Forskohlii | Forskolin .pptx
Analytical Profile of Coleus Forskohlii | Forskolin .pptxAnalytical Profile of Coleus Forskohlii | Forskolin .pptx
Analytical Profile of Coleus Forskohlii | Forskolin .pptxSwapnil Therkar
 
G9 Science Q4- Week 1-2 Projectile Motion.ppt
G9 Science Q4- Week 1-2 Projectile Motion.pptG9 Science Q4- Week 1-2 Projectile Motion.ppt
G9 Science Q4- Week 1-2 Projectile Motion.pptMAESTRELLAMesa2
 
Stunning ➥8448380779▻ Call Girls In Panchshil Enclave Delhi NCR
Stunning ➥8448380779▻ Call Girls In Panchshil Enclave Delhi NCRStunning ➥8448380779▻ Call Girls In Panchshil Enclave Delhi NCR
Stunning ➥8448380779▻ Call Girls In Panchshil Enclave Delhi NCRDelhi Call girls
 
Recombinant DNA technology (Immunological screening)
Recombinant DNA technology (Immunological screening)Recombinant DNA technology (Immunological screening)
Recombinant DNA technology (Immunological screening)PraveenaKalaiselvan1
 
Lucknow 💋 Russian Call Girls Lucknow Finest Escorts Service 8923113531 Availa...
Lucknow 💋 Russian Call Girls Lucknow Finest Escorts Service 8923113531 Availa...Lucknow 💋 Russian Call Girls Lucknow Finest Escorts Service 8923113531 Availa...
Lucknow 💋 Russian Call Girls Lucknow Finest Escorts Service 8923113531 Availa...anilsa9823
 
Animal Communication- Auditory and Visual.pptx
Animal Communication- Auditory and Visual.pptxAnimal Communication- Auditory and Visual.pptx
Animal Communication- Auditory and Visual.pptxUmerFayaz5
 
Bentham & Hooker's Classification. along with the merits and demerits of the ...
Bentham & Hooker's Classification. along with the merits and demerits of the ...Bentham & Hooker's Classification. along with the merits and demerits of the ...
Bentham & Hooker's Classification. along with the merits and demerits of the ...Nistarini College, Purulia (W.B) India
 
Call Girls in Munirka Delhi 💯Call Us 🔝9953322196🔝 💯Escort.
Call Girls in Munirka Delhi 💯Call Us 🔝9953322196🔝 💯Escort.Call Girls in Munirka Delhi 💯Call Us 🔝9953322196🔝 💯Escort.
Call Girls in Munirka Delhi 💯Call Us 🔝9953322196🔝 💯Escort.aasikanpl
 
Physiochemical properties of nanomaterials and its nanotoxicity.pptx
Physiochemical properties of nanomaterials and its nanotoxicity.pptxPhysiochemical properties of nanomaterials and its nanotoxicity.pptx
Physiochemical properties of nanomaterials and its nanotoxicity.pptxAArockiyaNisha
 
Biopesticide (2).pptx .This slides helps to know the different types of biop...
Biopesticide (2).pptx  .This slides helps to know the different types of biop...Biopesticide (2).pptx  .This slides helps to know the different types of biop...
Biopesticide (2).pptx .This slides helps to know the different types of biop...RohitNehra6
 
Unlocking the Potential: Deep dive into ocean of Ceramic Magnets.pptx
Unlocking  the Potential: Deep dive into ocean of Ceramic Magnets.pptxUnlocking  the Potential: Deep dive into ocean of Ceramic Magnets.pptx
Unlocking the Potential: Deep dive into ocean of Ceramic Magnets.pptxanandsmhk
 
Artificial Intelligence In Microbiology by Dr. Prince C P
Artificial Intelligence In Microbiology by Dr. Prince C PArtificial Intelligence In Microbiology by Dr. Prince C P
Artificial Intelligence In Microbiology by Dr. Prince C PPRINCE C P
 
Labelling Requirements and Label Claims for Dietary Supplements and Recommend...
Labelling Requirements and Label Claims for Dietary Supplements and Recommend...Labelling Requirements and Label Claims for Dietary Supplements and Recommend...
Labelling Requirements and Label Claims for Dietary Supplements and Recommend...Lokesh Kothari
 
Traditional Agroforestry System in India- Shifting Cultivation, Taungya, Home...
Traditional Agroforestry System in India- Shifting Cultivation, Taungya, Home...Traditional Agroforestry System in India- Shifting Cultivation, Taungya, Home...
Traditional Agroforestry System in India- Shifting Cultivation, Taungya, Home...jana861314
 
Grafana in space: Monitoring Japan's SLIM moon lander in real time
Grafana in space: Monitoring Japan's SLIM moon lander  in real timeGrafana in space: Monitoring Japan's SLIM moon lander  in real time
Grafana in space: Monitoring Japan's SLIM moon lander in real timeSatoshi NAKAHIRA
 
Raman spectroscopy.pptx M Pharm, M Sc, Advanced Spectral Analysis
Raman spectroscopy.pptx M Pharm, M Sc, Advanced Spectral AnalysisRaman spectroscopy.pptx M Pharm, M Sc, Advanced Spectral Analysis
Raman spectroscopy.pptx M Pharm, M Sc, Advanced Spectral AnalysisDiwakar Mishra
 
Nanoparticles synthesis and characterization​ ​
Nanoparticles synthesis and characterization​  ​Nanoparticles synthesis and characterization​  ​
Nanoparticles synthesis and characterization​ ​kaibalyasahoo82800
 

Recently uploaded (20)

Biological Classification BioHack (3).pdf
Biological Classification BioHack (3).pdfBiological Classification BioHack (3).pdf
Biological Classification BioHack (3).pdf
 
Spermiogenesis or Spermateleosis or metamorphosis of spermatid
Spermiogenesis or Spermateleosis or metamorphosis of spermatidSpermiogenesis or Spermateleosis or metamorphosis of spermatid
Spermiogenesis or Spermateleosis or metamorphosis of spermatid
 
Analytical Profile of Coleus Forskohlii | Forskolin .pptx
Analytical Profile of Coleus Forskohlii | Forskolin .pptxAnalytical Profile of Coleus Forskohlii | Forskolin .pptx
Analytical Profile of Coleus Forskohlii | Forskolin .pptx
 
G9 Science Q4- Week 1-2 Projectile Motion.ppt
G9 Science Q4- Week 1-2 Projectile Motion.pptG9 Science Q4- Week 1-2 Projectile Motion.ppt
G9 Science Q4- Week 1-2 Projectile Motion.ppt
 
The Philosophy of Science
The Philosophy of ScienceThe Philosophy of Science
The Philosophy of Science
 
Stunning ➥8448380779▻ Call Girls In Panchshil Enclave Delhi NCR
Stunning ➥8448380779▻ Call Girls In Panchshil Enclave Delhi NCRStunning ➥8448380779▻ Call Girls In Panchshil Enclave Delhi NCR
Stunning ➥8448380779▻ Call Girls In Panchshil Enclave Delhi NCR
 
Recombinant DNA technology (Immunological screening)
Recombinant DNA technology (Immunological screening)Recombinant DNA technology (Immunological screening)
Recombinant DNA technology (Immunological screening)
 
Lucknow 💋 Russian Call Girls Lucknow Finest Escorts Service 8923113531 Availa...
Lucknow 💋 Russian Call Girls Lucknow Finest Escorts Service 8923113531 Availa...Lucknow 💋 Russian Call Girls Lucknow Finest Escorts Service 8923113531 Availa...
Lucknow 💋 Russian Call Girls Lucknow Finest Escorts Service 8923113531 Availa...
 
Animal Communication- Auditory and Visual.pptx
Animal Communication- Auditory and Visual.pptxAnimal Communication- Auditory and Visual.pptx
Animal Communication- Auditory and Visual.pptx
 
Bentham & Hooker's Classification. along with the merits and demerits of the ...
Bentham & Hooker's Classification. along with the merits and demerits of the ...Bentham & Hooker's Classification. along with the merits and demerits of the ...
Bentham & Hooker's Classification. along with the merits and demerits of the ...
 
Call Girls in Munirka Delhi 💯Call Us 🔝9953322196🔝 💯Escort.
Call Girls in Munirka Delhi 💯Call Us 🔝9953322196🔝 💯Escort.Call Girls in Munirka Delhi 💯Call Us 🔝9953322196🔝 💯Escort.
Call Girls in Munirka Delhi 💯Call Us 🔝9953322196🔝 💯Escort.
 
Physiochemical properties of nanomaterials and its nanotoxicity.pptx
Physiochemical properties of nanomaterials and its nanotoxicity.pptxPhysiochemical properties of nanomaterials and its nanotoxicity.pptx
Physiochemical properties of nanomaterials and its nanotoxicity.pptx
 
Biopesticide (2).pptx .This slides helps to know the different types of biop...
Biopesticide (2).pptx  .This slides helps to know the different types of biop...Biopesticide (2).pptx  .This slides helps to know the different types of biop...
Biopesticide (2).pptx .This slides helps to know the different types of biop...
 
Unlocking the Potential: Deep dive into ocean of Ceramic Magnets.pptx
Unlocking  the Potential: Deep dive into ocean of Ceramic Magnets.pptxUnlocking  the Potential: Deep dive into ocean of Ceramic Magnets.pptx
Unlocking the Potential: Deep dive into ocean of Ceramic Magnets.pptx
 
Artificial Intelligence In Microbiology by Dr. Prince C P
Artificial Intelligence In Microbiology by Dr. Prince C PArtificial Intelligence In Microbiology by Dr. Prince C P
Artificial Intelligence In Microbiology by Dr. Prince C P
 
Labelling Requirements and Label Claims for Dietary Supplements and Recommend...
Labelling Requirements and Label Claims for Dietary Supplements and Recommend...Labelling Requirements and Label Claims for Dietary Supplements and Recommend...
Labelling Requirements and Label Claims for Dietary Supplements and Recommend...
 
Traditional Agroforestry System in India- Shifting Cultivation, Taungya, Home...
Traditional Agroforestry System in India- Shifting Cultivation, Taungya, Home...Traditional Agroforestry System in India- Shifting Cultivation, Taungya, Home...
Traditional Agroforestry System in India- Shifting Cultivation, Taungya, Home...
 
Grafana in space: Monitoring Japan's SLIM moon lander in real time
Grafana in space: Monitoring Japan's SLIM moon lander  in real timeGrafana in space: Monitoring Japan's SLIM moon lander  in real time
Grafana in space: Monitoring Japan's SLIM moon lander in real time
 
Raman spectroscopy.pptx M Pharm, M Sc, Advanced Spectral Analysis
Raman spectroscopy.pptx M Pharm, M Sc, Advanced Spectral AnalysisRaman spectroscopy.pptx M Pharm, M Sc, Advanced Spectral Analysis
Raman spectroscopy.pptx M Pharm, M Sc, Advanced Spectral Analysis
 
Nanoparticles synthesis and characterization​ ​
Nanoparticles synthesis and characterization​  ​Nanoparticles synthesis and characterization​  ​
Nanoparticles synthesis and characterization​ ​
 

Historical and Contemporary Trends in the Size, Drift, and Color of Jupiterʼs Great Red Spot

  • 1. Historical and Contemporary Trends in the Size, Drift, and Color of Jupiterʼs Great Red Spot Amy A. Simon1 , Fachreddin Tabataba-Vakili2 , Richard Cosentino3 , Reta F. Beebe4 , Michael H. Wong5 , and Glenn S. Orton2 1 NASA Goddard Space Flight Center 8800 Greenbelt Road Greenbelt, MD 20771, USA; Amy.simon@nasa.gov 2 Jet Propulsion Laboratory California Institute of Technology 4800 Oak Grove DrivePasadena, CA 91109, USA 3 USRA/NASA Goddard Space Flight Center 8800 Greenbelt Road Greenbelt, MD 20771, USA 4 New Mexico State University Astronomy Department P.O. Box 30001, MSC 4500 Las Cruces, NM 88001, USA 5 University of California, Berkeley Astronomy Department Berkeley, CA 94720-3411, USA Received 2017 December 29; revised 2018 January 30; accepted 2018 February 6; published 2018 March 13 Abstract Observations of Jupiter’s Great Red Spot (GRS) span more than 150 years. This allows for careful measurements of its size and drift rate. High spatial resolution spacecraft data also allow tracking of its spectral characteristics and internal dynamics and structure. The GRS continues to shrink in longitudinal length at an approximately linear rate of 0°.194 yr−1 and in latitudinal width at 0°.048 yr−1 . Its westward drift rate (relative to System III W. longitude) has increased from ∼0°.26/day in the 1980s to ∼0°.36/day currently. Since 2014, the GRS’s short wavelength (<650 nm) reflectance has continued to decrease, while it has become brighter at 890 nm, indicating a change in clouds/haze at high altitudes. In addition, its north–south color asymmetry has decreased, and the dark core has become smaller. Internal velocities have increased on its east and west edges, and decreased on the north and south, resulting in decreased relative vorticity and circulation. The GRS’s color changes from 2014 to 2017 may be explained by changes in stretching vorticity or divergence acting to balance the decrease in relative vorticity. Key words: planets and satellites: atmospheres – planets and satellites: gaseous planets Supporting material: data behind figures 1. Introduction Jupiter’s Great Red Spot (GRS) has long fascinated observers, with detailed historical records of its appearance and size dating back to the mid 1800s (Peek 1958; Rogers 1995). Detailed measurements were made of the GRS’s position and size, using reticulated eyepieces to record timings of transit crossings with small telescopes, along with notes on appearance (e.g., Peek 1958). The accuracy of these measure- ments depended on Earth atmospheric conditions and seeing, the contrast of GRS with its surroundings, and the skill of the particular observer. To improve measurement accuracy indivi- dual observations were often averaged over a full apparition (the yearly viewing period) and tabulated to show trends in longitudinal size over time. In 1974, Pioneer 10/11 Imaging Photopolarimeter measure- ments did not reveal many details of the GRS’s structure but did show a striking red color against bland background clouds (Fimmel et al. 1980). Starting in 1979 with the Voyager 1 and 2 flybys, detailed imagery showed the GRS’s complex inner workings and velocity fields (Smith et al. 1979; Beebe et al. 1989). Frequent observations from the Hubble Space Telescope (HST), interspersed with high-resolution views from Galileo, Cassini, New Horizons, and now Juno, have established a long-term monitoring record, confirming that the GRS is shrinking and evolving with time (Simon-Miller et al. 2002, Asay-Davis et al. 2009, Shetty & Marcus 2010; Simon et al. 2014). It has proven especially interesting in recent years as it has intensified in color, becoming a striking deep orange (Simon et al. 2014, 2015a, 2015b). Two HST monitoring programs, the Outer Planet Atmo- spheres Legacy (OPAL) and Wide Field Coverage for Juno (WFCJ), now give frequent, at least yearly, views of the GRS with the UV-optical channel (UVIS) of the Wide Field Camera 3 (WFC3). This wealth of new data allows us to analyze trends in the recent behavior and characteristics of the GRS, further constraining the mechanisms powering and sustaining this long-lived storm. In this paper, we examine the GRS’s long- term drift rate, size and shape, color, and wind fields changes over the full range of available data sets (1878 to present), with a focus on recent data sets (1996–2017). 2. Data Sets and Measurement Methods 2.1. Data Sets Careful historical records exist with consistent yearly measurements of the GRS dating back to 1878 (Peek 1958). Several measurements also exist, with no regular cadence, between 1831 and 1878. Prior to this, Cassini’s (or Hooke’s) Spot was recorded in the mid 1660s, but it remains unclear if that was the same storm due to its size and location. There was a lack of detailed measurements in the intervening years with only sporadic measurements until the early 1700s (Peek 1958; Hooke 1665; Cassini 1666; Reese & Solberg 1966; Reese 1971); the definitive first measurement of the GRS in the historical record came from Schwabe in 1831 (Denning 1898). From these detailed historical reports, the longitudinal size and average drift rate were tabulated and are included in our analyses. The spacecraft record includes imagery from a number of missions, including Voyager (1979), Galileo (1995–2003), Cassini (2000/2001), and the HST (1994 to present). Due to observing limitations, these data are not regularly spaced but provide very accurate measures of size and shape, location, and in some cases, internal wind fields. The two most recent HST programs, OPAL and WFCJ, now provide at least yearly imaging data (2015 to present). Figure 1 shows a compilation The Astronomical Journal, 155:151 (13pp), 2018 April https://doi.org/10.3847/1538-3881/aaae01 © 2018. The American Astronomical Society. All rights reserved. 1
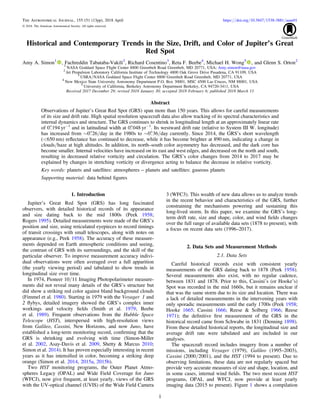
  • 2. Figure 1. GRS appearance at blue/violet wavelengths from 1979 (lower left) to 2017 (upper right). Data from: Voyager 1979, Hubble WFPC2 1994–2008, Cassini 2000, Hubble WFC3 2009-present. There is no common contrast scale between images. These maps span ±20° of longitude and planetographic latitude; the Cassini image was mapped in planetocentric latitude and is slightly compressed. 2 The Astronomical Journal, 155:151 (13pp), 2018 April Simon et al.
  • 3. of HST and Voyager images at blue/violet wavelengths, showing the obvious GRS change in color and size over time. 2.2. Methods Prior to any analysis, all spacecraft images were navigated using iterative ellipsoid limb fitting software, based on the camera’s characteristics, range to Jupiter, and limb/terminator brightness as done in all previous studies (e.g., Simon et al. 2015b). This yields a planet center fit, usually to better than 0.05 pixels. The ephemerides are generated using the Planetary Data System Rings node ephemeris generator tools (https://pds-rings.seti.org/tools/ephem2_jup.html) and pro- vide the absolute coordinate system on the planet for each date and time. For measuring GRS dimensions, most observers typically use the boundaries of the colored area and filters at blue wavelengths that offer the greatest contrast, see Figure 1. Although dynamical size measurements, using the location of the highest velocity region, may be more robust (Asay-Davis et al. 2009; Shetty & Marcus 2010), wind fields are not available as often as single images. Thus, for consistency, this paper examines size using the historical method, with the caveat that colored edges are not always well-defined. If it is wispy, or blue wavelengths were not available, other wavelengths can be used to further delineate size. In our analyzed data set, only 2012 lacked blue-filtered images, so a combination of red and UV filters was used for that date.Measurement uncertainties in the HST data are less <0°.1, with the above disclaimers on actual edge locations. Errors in individual measurements are random, so uncertainty in the derived long-term drift rates is well characterized by the scatter in the individual measurements. For drift rate measurements, the GRS’s central longitude is tracked at each measurement opportunity. Individual positional measurements of the GRS are affected by the known 90-day oscillation in its longitudinal motion (Reese 1971). In addition, the time separations are not constant for the available data (spans vary from 1 month to 2 years); the date shown for a given drift rate is the mid-range value. Depending on the phase of the 90-day oscillation with respect to any individual measurement, we expect offsets from the mean position of up to the amplitude of the oscillation, about 0°.76 of longitude as measured in the 1969–1970 epoch (Reese 1971) or 1°.2 as measured in the 1990s (Trigo-Rodriguez et al. 2000). All spectral data were obtained from the HST imagery using the Wide Field Planetary Camera 2 (WFPC2) prior to 2009 and WFC3 for 2009 and later. The absolute photometry of each image is found using the HST pipeline calibration factors for each filter and converted to reflectance using the solar flux in each filter and heliocentric range. WFC3 methane-absorption band images are further defringed, a 1%–2% correction (Simon et al. 2015b). We convert to I/F for consistency using the solar spectrum of Colina et al. (1996). WFPC2 absolute photometry is typically accurate to ∼5% (Gonzaga et al. 2006), and WFC3 photometry has a recently updated accuracy as low as 1% for full-frame filters (Deustua et al. 2016, 2017). For the WFC3 quad filters, updates have not yet been provided by STScI, so we estimate a photometric uncertainty of about 3% (see Section 2.1 of Irwin et al. 2017). In addition, long-wavelength narrowband filters in WFC3 have photometric errors associated with fringing. We have corrected for this effect using the approach of Wong (2011), but residual errors of about 0.8% may remain for the 889 nm WFC3 observations. 3. Analyses 3.1. Size and Drift Rate Trends Using both the historical data and the spacecraft data, one can track the longitudinal size (“length”) and drift rate of the GRS relative to the rotation rate of the planet (System III W. longitude), Figure 2. Change in longitudinal size (“length”) over time (black), change in System III westward drift rate (red). Historical size measurements from Reese (personal communication—private records) from a combination of transit timings and photographic plates. Historical drift rates from Peek (1958) (1872–1943), Reese (1945–1963) and Guitar (1962–1981; Guitar 1984). Peek’s historical transit measurements were converted from recorded rotation periods to System III drift rates. The data used to create this figure are available. 3 The Astronomical Journal, 155:151 (13pp), 2018 April Simon et al.
  • 4. Figure 2. For length, the historical record varies, in part because the true shape of the GRS was not recognized; many early observations, particularly when the GRS was faint, were really of the surrounding “hollow” (Peek 1958; Rogers 1995). This is particularly evident when the drawings indicate a pointed shape to the spot, especially in the 1910s and 1920s. Thus, these measurements probably overestimate the size of the GRS, rather than the spot itself growing and shrinking rapidly, and we cannot easily assign error bars to the early data. Note that even early photographic records have uncertainty of a few degrees due to low resolution and potentially poor observing conditions. Historically, the GRS was assumed to move at a constant rate relative to System II longitude, a rotational period based on the mean motion at the GRS latitude (Peek 1958). However, that was found to not be the case, and there is circumstantial evidence of correlation between drift and length in historical data, but no constant trend with time, Figure 2. In either longitude system, the motion of the GRS has accelerated in recent years, since about 2010. Although the early data are interesting, the scatter in length measurements and drift rate is dependent on the observer, observing conditions, and GRS contrast. Thus, it is difficult to use them for analysis, given the unknowns in what was measured. However, with the higher-resolution spacecraft data, the size and shape of the GRS may be examined more closely, and all using the same method of measurement. Since 1979, there are accurate measurements of both the length and the latitudinal size, “width,” as well as drift, Figure 3. Uncertainties from image navigation are <0°.1. As discussed previously, if an edge is not well-defined in a single image, other images or wavelengths are used. Thus, overall uncertainty in the size measurements is small, less than 0°.5. For drift rates, the uncertainty from size measurements is <0°.006/day for the shortest time separations and decreases with longer time separations, smaller than the uncertainty from the 90-day oscillation, typically 0°.003/day over these time spans (Trigo-Rodriguez et al. 2000). These size and drift trends were fit with both linear and quadratic least-squares fits. In most cases, the quadratic fit produced only a small improvement in unreduced χ2 (see IDL linfit routine), but are shown in Figure 3 for reference. The data fits shown in Figure 3 correspond to the following equations: Length (°) = 405.0 − 0.1939 ∗ Year, χ2 = 2.877. Width (°) = 107.2 − 0.0483 ∗ Year, χ2 = 1.708. Aspect ratio = 24.1 − 1.123E–2 ∗ Year, χ2 = 0.052. Drift rate (°/day) = −3.84 + 2.065E–3 ∗ Year, χ2 = 0.005. The linear decrease in length is 0°.194 yr−1 , higher than the historical value and that found by Beebe & Youngblood (1979) of 0°.114 yr−1 over the interval 1943–1979. Width has also decreased at 0°.048 yr−1 , with possible acceleration in recent years. The length and width dimensions are highly correlated, with a correlation coefficient of 0.88 (>0.99 if the fits are used), and result in a decrease in aspect ratio of ∼0.011 yr−1 . Lastly, the drift rate also shows an acceleration, and the linear Figure 3. Expanded view of longitudinal size, drift rate, latitudinal size, and aspect ratio (length/width) since 1979. Least-squares fitting of the data are shown as solid (quadratic) and dashed (linear) lines. 4 The Astronomical Journal, 155:151 (13pp), 2018 April Simon et al.
  • 5. best fit from 1979 to 2017 shows about an 0°.002/day per year increase. The fits for each parameter from 1979 to 2017 were used to compare drift rate with the other measurements: The drift rate appears to be anticorrelated with all three measure- ment fits, with correlation coefficients of −0.91, −0.88, to −0.92, for length, width and aspect ratio, respectively. This is unsurprising, given that the length and width are tightly correlated, and this fails to constrain which parameter or physical mechanism might control the GRS drift rate. Another potential diagnostic is the latitudinal location of the GRS and its corresponding position in the zonal wind field. Figure 4 plots the change in the northern and southern colored edge locations with time, as well as the drift of the GRS central latitude (∼0°.3 from 1979 to 2017). Although it has decreased in width, the GRS still overfills the wind jet- defined latitude corridor, bounded by a westward jet peak at −19°.5 (60–70 m s−1 ) and an eastward jet peak at −26°.5 (40–50 m s−1 ). This means that the wind jets continue to be deflected around the GRS, even as it shrinks and drifts slightly southward. The northern edge has receded twice as fast as the southern (0°.033 yr−1 versus 0°.015 yr−1 ), while the center has drifted at −0°.008 yr−1 . The corresponding fits for the edges and center latitude are: Northern Edge Lat (°) = 49.2 − 3.305E–2 ∗ Year, χ2 = 2.51. Southern Edge Lat (°) = −58.0 + 1.528E–2 ∗ Year, χ2 = 1.2. Central Lat (°) = −4.4 − 8.887E–3 ∗ Year, χ2 = 1.43. The N. and S. edge locations correlate with the drift rate, as does the GRS central latitude, all with correlation coefficients of 0.88. Note that the GRS’s position can also be influenced by interactions with, or passage by, other storms (Rogers 1995; Sánchez-Lavega et al. 1998; Sanchez-Lavega et al. 2013). The regular passages of the White Oval(s) to its south at 33° S appears to have small effect on its location (Sanchez-Lavega et al. 2013), while an unusually large oval at the GRS’s latitude in the 1990s did cause it to move by a few degrees when they met (Sánchez-Lavega et al. 1998). The correlation of drift rate and GRS latitudes may imply there is some interplay between the GRS motion and the wind field, despite being larger than the wind jet confines. As the dimensions of the GRS are also correlated with the drift rate, it is worth comparing the trend of GRS length and width with its location. The correlation coefficient between the N. edge or S. edge and the GRS length or width is ∼1.00; it is slightly lower for the southern edge if quadratic fits are used. The relationship between GRS dimensions and its edge locations is intriguing and provides the strongest evidence that the wind field affects the long-term GRS size and drift rate. 3.2. Color and Spectra An interesting note in the historical data is that the intensity of the GRS’s color appeared to be somewhat correlated with its motion; color was more intense, or it was darkest, when it accelerated (Peek 1958). Using HST images of the GRS obtained when it was closest to the central meridian longitude (CML), the I/F of the central darkest core is plotted in Figure 5. I/F is calculated by selecting pixels in the central core region (typically 3×3 pixels), and measuring the data numbers (DNs). Each value is converted from DN to I/F using the range-corrected solar flux integrated across each filter bandpass, and the filter transmission and detector/system response (from the Hubble pipeline PHOTFLAM keyword). The I/F value is then plotted against the filter’s central wavelength. These values are consistent with previous measurements, but do not appear to match Karkoschka’s (1998) full disk I/F, because full disk also includes limb values, which lower the total I/F. For example, if we compute the full disk I/F for 2017 at 631 nm by averaging across the entire visible disk, we find I/F=0.47, consistent with Karkoschka (1998). From 1995 to 2009, there are no notable reflectance differences at any wavelength. Beginning in 2014, the color of the GRS deepened significantly, Figure 1, and the change is apparent at all wavelengths <600 nm, Figure 5. Although the Figure 4. GRS central planetographic latitude and latitude span. Solid lines are quadratic best fits to the recent data. Dashed lines indicate the major eastward and westward wind jets, and the orange area corresponds to the latitudinal coverage of the GRS. The data used to create this figure are available. 5 The Astronomical Journal, 155:151 (13pp), 2018 April Simon et al.
  • 6. GRS was not centered on the CML in the 2014 and 2015 images, the angle was too small for limb darkening to explain the variation. It has remained this color since 2014, perhaps even darkening further in 2016/2017 when the GRS was on the CML; this is also apparent in true color images, Figure 6. Previously, work showed that the change in brightness from 400 to 500 nm has an approximately linear offset as the color deepened, but the slope from 500 to 600 nm also changed (Simon et al. 2014, 2015a, 2015b). Whiter/lighter visible features have a shallower slope, while redder features have a steeper slope, Figure 7. From 2014 to 2017, the internal coloration of the GRS has changed, and there is no longer a north–south asymmetry or large darker core at blue wave- lengths, e.g., Figure 1 1979–2009 (Simon-Miller et al. 2002; Simon et al. 2015a). In the strong methane gas absorption band images at 889 nm, the GRS internal structure does not look remarkably different in recent years but the reflectance has increased. Figure 8 plots the brightness with latitude averaged over 0°.3 along the central longitude in both the 889 nm band and the F275W UV band; both are sensitive to high-altitude structure. There are several noticeable changes: first in 889 nm, overall brightness has increased, while 275 nm brightness has decreased, both indicating changes in the high-altitude haze/cloud structure. The GRS brightness at 889 nm has also become more peaked toward the center, rather than being brighter farther north of the center, particularly when 2017 is compared with 2014. This is consistent with the change in red slope, as well. 4. Discussion To understand the motion of the GRS, we look to terrestrial analogs. Although likely not powered by the same moist convection, several factors can similarly affect its drift rate, as is true for Earth cyclones/anticyclones: the zonal winds (or steering winds), beta drift (advection of background potential vorticity), and vertical wind shear. The vertical wind shear has the smallest effect, primarily pushing a cyclone poleward. With only limited measurements of background vertical wind shear on Jupiter at these latitudes, primarily inferred from the thermal wind equation (e.g., Conrath et al. 1981; Gierasch et al. 1986; Simon-Miller et al. 2002, 2006), we leave this effect to future circulation modeling and focus on the first two factors. First, for a terrestrial northern hemisphere cyclone, the steering winds have the largest effect as jet streams and other high- and low-pressure systems push the system. The GRS central latitude near −22°.3 corresponds to zonal winds of 15–30 m s−1 westward (1°–2°/day), with peripheral jets at −19°.5 (∼65 m s−1 westward) and −26°.5 (∼40 m s−1 east- ward). These velocities may change slightly as the GRS center moves southward, but the edges are still both deflecting the peripheral jets, so this seems unlikely to be the major driver of its motion. The zonal winds at these latitudes were generally very constant from 1979 to 2007 (Simon-Miller & Gierasch 2010, Asay-Davis et al. 2011). However, comparison of zonal wind profiles from 2008 to 2016 showed there is some variability in the zonal wind speed near the GRS latitudes (Tollefson et al. 2017). The magnitude of the jet at −19°.5 is relatively constant, with some small changes in jet shape on the equatorward side, Figure 9, left. The jet magnitude at −26°.5 increases from 30 m s−1 in 2008 to ∼35 m s−1 in 2009 to 2015 and 40 m s−1 in 2016 but also appears to have shifted in latitude. However, if these winds were driving the GRS motion, it should be decelerating rather than accelerating, as it is pushed eastward by the stronger winds. Second, in a terrestrial hurricane, beta drift accounts for a few m s−1 poleward and westward motion. The GRS is an anticyclone, so the beta effect is reversed. Thus, a change in background potential vorticity could also allow the GRS to accelerate. Figure 9, from left to right, shows smoothed zonal wind fields, u, smoothed relative vorticity, ∂u/∂y, and smoothed relative vorticity gradient, uyy, computed for four years from the Cassini zonal wind field (Porco et al. 2003) and from HST zonal wind fields (Tollefson et al. 2017). To calculate uy, the zonal wind profile was smoothed into 0°.5 bins, Figure 5. Spectral evolution of the dark central core of the GRS from 1995 to 2017. The solid line is the Karkoschka (1998) full disk spectrum, sampled with 1 nm spacing. Uncertainties are shown for WFPC2 data (1995–2008), WFC3 data (2009–2017) uncertainties are smaller than the symbol size. 6 The Astronomical Journal, 155:151 (13pp), 2018 April Simon et al.
  • 7. and for uyy, uy was smoothed in 1° bins, using a running average. For direct comparison with previous work, uyy was then smoothed in 2° bins (Read et al. 2006a). Smoothing did not alter the calculation results. As mentioned above, Figure 9, left, shows slight shifts in the surrounding wind jet locations, along with small magnitude changes. This results in variation of the background vorticity, with a decrease near −19°.5 and reversal near −26°.5 in 2016 as the jet moved northward. Similar to what Read et al. (2006a) found, the magnitude of the vorticity gradient of the westward jet at −19°.5 exceeds the planetary vorticity, β (dash–dot lines in right panel), violating the Rayleigh–Kuo stability criterion (Read et al. 2006a), but decreases in 2015/2016. For the eastward jet at −26°.5, the uyy also exceeds the magnitude of the planetary vorticity. However, at the GRS’s southern boundary, in 2016 the vorticity gradient was close to the planetary vorticity and possibly no longer in violation. While an individual year’s profiles may not be statistically significant, the decreasing trend in uyy in the westward jet, and maybe both jets, may explain the increased GRS drift rate since 2010. Of course, as the GRS deflects the jets, this is difficult to interpret. Correlating the GRS color changes with a physical mechanism is the most challenging task. Historical measure- ment suggested that color and drift rate were correlated (Peek 1958; Rogers 1995), in agreement with the 2014–2017 Figure 6. GRS true color montage, generated from images I/F at 631 (R), 502 (G), and 395 (B) nm, over time from 2014 (lower left) to 2017 (upper right). Minnaert limb darkening corrections were applied before mapping 2014 April and 2015 January, as the GRS was offset from the central meridian by ∼15° in both cases (the effect is small but reduces a gradient across the images). The Minnaert coefficients are 0.999, 0.95, and 0.85 for 631, 502, and 395 nm, respectively. 7 The Astronomical Journal, 155:151 (13pp), 2018 April Simon et al.
  • 8. observations of intense coloration and high drift rates. However, other than perhaps a change in the amount of cloud ingested, that does not present an obvious physical mechanism (Simon et al. 2014). However, vortex stretching is a possible mechanism that explains GRS color variability. Quasi-geostrophic potential vorticity (QGPV) is the sum of planetary vorticity, relative vorticity, and stretching vorticity (e.g., Holton 1992; Read et al. 2006b). Quasi-geostrophic potential vorticity should be conserved, and any changes in the GRS’s internal relative vorticity should be balanced by a change in stretching vorticity, as the planetary vorticity is constant (Holton 1992). Indeed, previous models assuming QGPV have been able to reproduce the internal structure of the GRS, with a high velocity collar and a quiescent core (Cho et al. 2001). Under QGPV, a change in size, and therefore location of the highest velocity winds, would cause a change in the relative vorticity: ζ≡∂v/∂x–∂u/∂y. This can be balanced by a change in stretching vorticity, or geopotential height of the GRS: ¶ ¶ - ¶ ¶ µ - ¶ ¶ ⎛ ⎝ ⎜ ⎞ ⎠ ⎟ v x u y f S T pp 0 where u and v are the east–west and north–south winds, p is pressure, f0 is Coriolis parameter, T is temperature and Sp is the static stability (Holton 1992). Thus, the calculation of vorticity relies on which estimates of velocity and size are adopted. Prior studies of the GRS’s internal wind fields gave varying results, depending on the method used and time separation between image pairs. In general, correlation and velocimetry methods give the max- imum numbers of velocity vectors (e.g., Asay-Davis et al. 2009; Shetty & Marcus 2010). Manual methods are less subject to image noise, allowing long time separation image pairs (and therefore, lower uncertainties), but do not provide as many vectors. Comparison of manual measurements to Figure 7. Red spectral slope montage, generated from I/F at 631–502 nm, over time from 2014 (lower left) to 2017 (upper right). Slope is calculated by 100 ∗ (I/F631–I/F502)/Δλ. 8 The Astronomical Journal, 155:151 (13pp), 2018 April Simon et al.
  • 9. automated methods often shows higher individual vector velocities, but similar averages in the GRS’s high velocity collar (Vasavada et al. 1998; Asay-Davis et al. 2009). For example, manual measurements of Voyager 1979 and Galileo 1996 images both found peak east–west velocities of ∼150 m s−1 , while an average of the correlation results was 130 m s−1 (Sada et al. 1996; Vasavada et al. 1998); north–south velocities were on the order of 100 m s−1 . As we are concerned with looking for bulk changes in relative vorticity, we compared the averages generated from the automated methods in 1996–2017 and use the locations of the high velocity peaks in each dimension to determine size and vorticity across the GRS (Asay-Davis et al. 2009). For 2012–2017, we used a correlation method, UVMAT, (Fincham & Spedding 1997; Fincham & Delerce 2000) on image pairs with 20–40 minute separations, checked manually with image pairs with 10 hr separations; as these values were not as accurate as a full velocimetry mapping, we assume larger error bars of ±10 m s−1 in later calculations. The measured peak velocity within the highest velocity collar of the GRS, the corresponding average semimajor, a, and semiminor, b, axes, and the collar “halfwidths” are shown in Table 1. The collar halfwidths are defined as the distance toward the core over which the velocity goes from a maximum to zero. Figure 8. Brightness scans at 889 nm, averaged over a 0°.3 longitude swath at the GRS central longitude. Dotted line indicates the central latitude from Figure 4. Figure 9. Zonal velocity, u, (left), relative vorticity, ∂u/∂y, (center), and its gradient, uyy, (right) for 2000 (black lines), 2012 (blue lines), 2015 (green), and 2016 (red lines). Black dashed–dotted lines correspond to the planetary vorticity gradient, β(and −β). Dotted lines mark the latitudes of the bounding wind jets. Gray shading indicates the extent of the GRS from Cassini (left) to 2016 (right), and dashed lines mark the corresponding uyy for 2000 and 2016. 9 The Astronomical Journal, 155:151 (13pp), 2018 April Simon et al.
  • 10. The measured collar halfwidths (da, db) are shorter than semimajor axis lengths (a, b), particularly in older measure- ments. This discrepancy is an indication of the quiet center, or hollow nature, of the GRS (e.g., Marcus 1993), because it means that the circulating winds die down well outside the geometric center of the vortex. No other vortices on Jupiter, or the other outer planets, are known to have a quiet center like the GRS (Mitchell et al. 1981). Our measurements suggest that the quiet center still remains in 2017, but is significantly smaller than during the Voyager encounters. Higher-density velocity fields will be instrumental in investigating the vorticity structure of the GRS at recent times. Using Voyager 1 and 2 data, Read et al. (2006b) found that the relative vorticity and stretching vorticity did not change much in magnitude with altitude in the upper troposphere, but the overall shape of the field in the troposphere may be influenced by other atmospheric features, such as the passage of Oval BA to the south of the GRS, compressing the wind field. Table 2, first column, shows a direct calculation of ∂v/∂x−∂u/∂y, found by a simple ratio of average maximum velocities on each axis (Table 1, Columns 2–5) to GRS dimensions (Columns 6–7). The magnitude of the vorticity in other mentioned studies varied, depending on how the calculation was performed and which velocities and widths are used (Mitchell et al. 1981; Sada et al. 1996; Choi et al. 2007; Cheng et al. 2008). For best comparison with previous studies, we compute the vorticity around the GRS in polar coordinates and assumed conservative uncertainties on velocity and size measurements (Mitchell et al. 1981). To calculate the relative vorticity, ζ, on each location of an elliptical region: z q h h= +( ) ( )a a b v dv da , 1T T 2 3 where h q q q q º + + ⎡ ⎣ ⎢ ⎤ ⎦ ⎥ ( ) ( ) a b a b cos sin cos sin 2 4 2 2 2 2 1 2 vT is the average tangential velocity and θ is the angle counterclockwise from E. Thus, along the semimajor axis, θ=0, η=1, and along the semiminor axis θ=90, and η=a/b. Mitchell et al. (1981) assumed vT to only be a function of a, and not b, and used the same collar halfwidth in both dimensions, while Cheng et al. (2008) neglected the second term (i.e., dvT/da=0 along the semiminor axis). Both studies fit functions to vT(a). For simplicity, we assumed that vT decreases linearly over the collar width, as a true fit requires a full wind vector map with higher accuracy than is possible from a simple correlation, and this is left to future work. In Table 2, we calculated the vorticity (column 2) by a subtracting the average east–west velocity/semiminor axis from the average north–south velocity/semimajor axis. We also calculate vorticity on each axis (columns 3 and 4), using Equation (1), with the appropriate tangential velocity and collar halfwidth in each axis in Table 1. Shetty & Marcus (2010) found that the magnitude of the vorticity did not change much from 1996 to 2006, even as the area decreased. We find an overall decrease when looking at ∂v/∂x–∂u/∂y, Table 2, Column 2. By looking at each axis independently, Figure 10, we also see that the vorticity on the N/S edges (semiminor axis) has decreased steadily until the past two years. Vorticity on the E/W edges (semimajor axis) has also decreased, but not as rapidly, with a small increase beginning in 2012. It is worth noting that the vorticity was nearly the same on both axes in 2012, and the magnitude of the E/W edge vorticity passing that of the N/S in 2014. Improved velocities, and future data points, can reduce the uncertainties of this trend in recent years. Table 1 Maximum GRS Velocities, Visible Size, and Dynamical Size Mission Date ∣ ∣uN (m s−1 ) ∣ ∣uS (m s−1 ) ∣ ∣vE (m s−1 ) ∣ ∣vW (m s−1 ) a (km) b (km) da (km) db (km) Area (1013 m2 ) Voyager 1979 (1), (2) 150 150 120 120 9000 4667 4115 2917 13.2 Galileo 1996 (3), (5) 140 130 97 100 6461 4988 3292 2334 10.1 Galileo 2000 (4), (5) 120 150 95 105 6173 4988 3704 2917 9.7 HST2006 (5) 120 130 92 102 5391 4883 3704 3500 8.3 HST 2012 Sep 110 120 100 100 4527 4667 3292 4527 6.6 HST 2015 Jan 90 120 100 100 4939 4667 3704 4939 7.2 HST 2016 Feb 100 110 110 100 4650 4201 3704 4650 6.1 HST 2017 Apr 100 120 100 100 4321 4667 3704 4321 6.3 References. (1) Mitchell et al. (1981), (2) Cheng et al. (2008), (3) Vasavada et al. (1998), (4) Choi et al. (2007), (5) Asay-Davis et al. (2009). Table 2. Calculated GRS Vorticity, Circulation, and Rossby Numbers Mission Date D D D D∣ – ∣v a u b ζN/s ζE/w ζavg Circulation=ζavg/Area Circulation=vT,avg ∗ circum. Ro,a Ro,b Voyager 1979 3.17 10.78 7.87 9.33 12.31 5.94 0.38 0.07 Galileo 1996 2.59 9.11 5.55 7.33 7.42 4.22 0.19 0.12 Galileo 2000 2.29 7.49 5.18 6.34 6.13 4.13 0.19 0.13 HST 2006 1.99 6.04 4.81 5.43 4.49 3.59 0.17 0.16 HST 2012 1.43 5.08 5.12 5.10 3.38 3.11 0.16 0.20 HST 2015 1.19 4.26 4.97 4.61 3.34 3.09 0.17 0.15 HST 2016 1.32 4.54 5.60 5.07 3.11 2.92 0.21 0.16 HST 2017 1.11 5.11 4.68 4.89 3.10 2.97 0.15 0.21 Note: All vorticities are in units of 10−5 s−1 and circulation is in 109 m2 s−1 . 10 The Astronomical Journal, 155:151 (13pp), 2018 April Simon et al.
  • 11. The significant changes in vorticity magnitude from 1979 to 2017, Figure 10, must be balanced by changes in GRS divergence (i.e., radial flow), stretching vorticity (vertical structure), or some other dissipation mechanism (typically inertia-gravity waves). Divergence is best measured with more accurate wind retrievals. It should be noted that the dynamical area of the GRS has also decreased Figure 10, bottom, along with the width of the high velocity collar on the semimajor axis; the width along the semiminor axis has remained nearly constant. This indicates a smaller region of stagnant flow in the center, consistent with the changed structure shown in Figure 1. The circulation can be calculated either as the integral of the velocity around the circumference or by the vorticity multiplied by area. Without a closed contour, the integral cannot be computed, but a sum of the tangential velocities divided by the circumference is shown in Table 2 (Column 7). To calculate by vorticity (Column 6), we used the average vorticity over both axes (Column 5) multiplied by the area in Table 1. In either case, it has steadily decreased over time. Previous work found differences between sizes measured using velocity fields, compared to measurements using color and cloud boundaries (Simon et al. 2014). The most recent measurements (Table 1 and Figure 3) show dynamical and cloud-based sizes more closely in agreement than ever before, especially in the latitudinal direction. Stretching vorticity can also be calculated directly from the full velocity and temperature fields with the assumption of quasi-geostrophic balance (Read et al. 2006b). Comparisons from Voyager and Cassini did show small variations in ∂p/∂T (Simon-Miller et al. 2002). Ground-based studies from 2006 to 2008 (Fletcher et al. 2010) also showed some small temper- ature variations, but further analysis requires more high- resolution temperature data, in particular since 2012. Determin- ing the vertical structure requires radiative transfer retrievals from images at multiple wavelengths and emission angles, and such a detailed analysis is currently underway for HST data to compare with retrievals from Galileo data. However, pre- liminary assessment of brightness changes at altitude sensitive wavelengths, Figure 8, indicate that such a change in cloud or haze structure may have occurred. Previous models found that the internal velocity structure of the GRS was highly dependent on the vertical structure radius, and in some cases, the quiescent core disappears (Cho et al. 2001) Lastly, the Rossby number, Ro=vTa/(b2 η3 f ) can be calculated along the semimajor and semiminor axes, Table 2, and is an indication of the validity of assuming geostrophic balance (Holton 1992). Our Ro values from Voyager match previous studies (Mitchell et al. 1981) but are lower than Cheng et al. (2008) for 1996 and 2000, because of the lower average velocities used in our calculation. We also find the maximum Ro on the semimajor axis has decreased while it has increased on the semiminor axis, Table 2. These values are now both consistent with geostrophic balance, while the 1979 value along the semiminor axis was more consistent with gradient balance, where centrifugal force balances Coriolis and pressure gradients (Mitchell et al. 1981; Holton 1992). However, changes in Ro can indicate a change in divergence within the GRS or can result in the generation of inertia-gravity waves during geostrophic adjustment (Holton 1992). Observing these Figure 10. Changing GRS vorticity (top), and dynamical area and circulation (bottom). The relative vorticity is calculated at the maximum velocity semimajor (E/W) and semiminor (N/S) distances (top, red squares and black Xs, respectively) with approximate uncertainties. The dynamical area (bottom, black diamonds) is defined by the maximum velocity collar’s semimajor and semiminor axes. The circulation is the average relative vorticity multiplied by the area (bottom, blue triangles). 11 The Astronomical Journal, 155:151 (13pp), 2018 April Simon et al.
  • 12. waves (300 km or smaller) requires spatial resolution higher than is possible from HST. However, Juno’s JunoCam images have revealed very small-scale waves, prominent in highly processed observations of the GRS made near the Juno spacecraft’s closest approach on its seventh scientific orbit on 2017 July 11 (https://www. missionjuno.swri.edu/Vault/VaultOutput?VaultID=10409&t =1508962497), although their wave type and dispersion has not yet been determined. They are found just inside the northern boundary of the GRS around −17.9 to −18°.1, at the northern edge of where the relative vorticity gradient is near or exceeds the planetary vorticity gradient (Figure 9, right panel). Recorded in near-simultaneous broad-band red, green and blue filters in each image, they are prominent in three independent images and are not processing artifacts (Hansen et al. 2017). Separate trains of waves stretch for 2500 km in the east–west direction and subtend as much as 700 km in the north–south direction. Individual waves are 35 km in size on average and are spaced approximately every 70 km. The image scale per pixel in these images is approximately 11 km. Comparison with Galileo data sets at similar resolution is difficult, as those images often had compression artifacts at highest resolution. Voyager 1 closest approach images, with a pixel scale of <5 km, did not reveal any wave features of this scale inside the GRS. 5. Conclusions Reanalysis of historical data, in concert with the most recent spacecraft data, shows continued change within Jupiter’s GRS: 1. As measured by color and cloud patterns in optical images, the longitudinal length has continued to decrease, as has the latitudinal width, with the GRS becoming rounder over time. 2. The westward drift rate, relative to the planetary rotation, has increased steadily since ∼2005. 3. Since 2014, the GRS is darker at wavelengths shorter than 650 nm and shows less N/S asymmetry over time. High-altitude structure may have also changed over that time, causing it to be bright at methane-absorption wavelengths and darker in the UV. 4. The internal relative vorticity has decreased on both the semimajor and semiminor axes until 2012, when they were of the same magnitude. 5. Changing size and internal wind speeds from 1979 to 2017 result in a decreased circulation within the spot, even as its dynamical areas shrinks. 6. Rossby numbers on the semimajor and semiminor axes differed by almost an order of magnitude in 1979 but are now similar. We find that the size and drift rate of the GRS are tightly correlated with its location in the wind field and possibly with changes in background relative vorticity, as it deflects the surrounding zonal winds. The most recent (2014–2017) changes in internal cloud morphology and color may be due to changes in divergence, internal vorticity, and vortex stretching rather than being correlated to its drift rate. Future detailed analyses of the vertical cloud structure, temperature profile, and wind fields will allow better mapping of these quantities to look for a definitive change in structure tied to one of these mechanisms. Continued data from the OPAL, and other HST programs, are crucial to monitoring such changes within the GRS and understanding its dynamical balance in Jupiter’s wind field. This work used data from the NASA/ESA Hubble Space Telescope, and was supported by grants from the Space Telescope Science Institute, which is operated by the Associa- tion of Universities for Research in Astronomy, Inc., under NASA contract NAS 5-26555. These observations are associated with programs GO5313, GO5642, GO6009, GO6141, GO6452, GO11096, GO11102, GO11498, GO12003, GO12045, GO13067, GO13631, GO13937/14334/14756, and GO14661. Jupiter maps are available athttps://archive.stsci.edu/prepds/ opal/ andhttps://archive.stsci.edu/prepds/wfcj/. We thank Kelly Beatty for discussing recent trends in drift rate, prompting some of this investigation, and Gerald Eichstaedt for his rapid processing of JunoCam images to enhance important details. We thank Agustin Sanchez-Lavega for a detailed and thorough review of this manuscript. ORCID iDs Amy A. Simon https://orcid.org/0000-0003-4641-6186 Michael H. Wong https://orcid.org/0000-0003-2804-5086 References Asay-Davis, X. S., Marcus, P., Wong, M. H., & de Pater, I. 2009, Icar, 203, 164 Asay-Davis, X. S., Marcus, P., Wong, M. H., & de Pater, I. 2011, Icar, 211, 1215 Beebe, R. F., Orton, G. S., & West, R. A. 1989, Time Variable Phenomenon in the Jovian System, NASA SP-494, 245 Beebe, R. F., & Youngblood, L. A. 1979, Natur, 280, 771 Cassini, C. F. 1666, Philos. Trans. R. Soc. London, 1, 143 Cheng, A. F., Simon-Miller, A. A., Weaver, H. A., et al. 2008, AJ, 135, 2446 Cho, J. Y.-K., de la Torre Juarez, M., Ingersoll, A. P., & Dritschel, D. G. 2001, JGR, 106, 5099 Choi, D. S., Banfield, D., Gierasch, P., & Showman, A. P. 2007, Icar, 188, 35 Colina, L., Bohlin, R. C., & Castelli, F. 1996, AJ, 112, 307 Conrath, B. J., Flasar, F. M., Pirraglia, J., Gierasch, P., & Hunt, G. 1981, JGR, 86, 8769 Denning, W. F. 1898, MNRAS, 58, 480 Deustua, S. E., Mack, J., Bajaj, V., & Khandrika, H. 2017, WFC3/UVIS Updated 2017 Chip-Dependent Inverse Sensitivity Values (WFC3 ISR 2017-14) (Baltimore, MD: STScI) Deustua, S. E., Mack, J., Bowers, A. S., et al. 2016, UVIS 2.0 Chip-dependent Inverse Sensitivity Values (WFC3 ISR 2016-03) (Baltimore, MD: STScI) Fimmel, R. O., Van Allen, J., & Burgess, E. 1980, Pioneer: First to Jupiter, Saturn and Beyond, NASA SP-446, 26 Fincham, A., & Delerce, G. 2000, ExFl, 29, S013 Fincham, A. M., & Spedding, G. R. 1997, ExFl, 23, 449 Fletcher, L. N., Orton, G. S., Mousis, O., et al. 2010, Icar, 208, 306 Gierasch, P. J., Conrath, B. J., & Magalhaes, J. A. 1986, Icar, 67, 456 Gonzaga, S., Brammer, G., Heyer, I., et al. 2006, WFPC2 Standard Star Monitoring Memo, STScI Tech. Rep., http://www.stsci.edu/hst/wfpc2/ analysis/wfpc2_stdstar_phot3.html Guitar, H. 1984, PhD dissertation, New Mexico State Univ. Hansen, C. J., Caplinger, M. A., Ingersoll, A., et al. 2017, SSRv, 213, 475 Holton, J. R. 1992, An Introduction to Dynamic Meteorology (3rd ed.; New York: Academic) Hooke, R. 1665, Philos. Trans. R. Soc. London, 1, 3 Irwin, P. G. J., Wong, M. H., Simon, A. A., Orton, G. S., & Toledo, D. 2017, Icar, 288, 99 Karkoschka, E. 1998, Icar, 133, 134 Marcus, P. S. 1993, ARA&A, 31, 523 Mitchell, J. L., Beebe, R. F., Ingersoll, A. P., & Garneau, G. W. 1981, JGR, 86, 8751 Peek, B. M. 1958, The Planet Jupiter (London: Faber and Faber) Porco, C. C., West, R. A., McEwen, A., et al. 2003, Sci, 299, 1541 Read, P. L., Gierasch, P. J., Conrath, B. J., et al. 2006a, QJRMS, 132, 1577 Read, P. L., Gierasch, P. J., & Conrath, B. J. 2006b, QJRMS, 132, 1605 12 The Astronomical Journal, 155:151 (13pp), 2018 April Simon et al.
  • 13. Reese, E. J. 1971, Icar, 14, 343 Reese, E. J., & Solberg, H. G., Jr. 1966, Icar, 5, 266 Rogers, J. H. 1995, The Giant Planet Jupiter (Cambridge: Cambridge Univ. Press) Sada, P. V., Beebe, R. F., & Conrath, B. J. 1996, Icar, 119, 311 Sánchez-Lavega, A., Hueso, R., Lecacheux, J., et al. 1998, Icar, 136, 14 Sanchez-Lavega, A., Legarreta, J., Garcia-Melendo, E., et al. 2013, JGRE, 118, 1 Shetty, S., & Marcus, P. S. 2010, Icar, 210, 182 Simon, A. A., Sanchez-Lavega, A., Legarreta, J., et al. 2015a, JGRE, 120, 483 Simon, A. A., Wong, M. H., & Orton, G. S. 2015b, ApJ, 812, 55 Simon, A. A., Wong, M. H., Rogers, J. H., et al. 2014, ApJL, 797, L31 Simon-Miller, A. A., Conrath, B. J., Gierasch, P. J., et al. 2006, Icar, 180, 98 Simon-Miller, A. A., & Gierasch, P. J. 2010, Icar, 210, 258 Simon-Miller, A. A., Gierasch, P. J., Beebe, R. F., et al. 2002, Icar, 158, 249 Smith, B. A., Soderblom, L. A., Beebe, R. F., et al. 1979, Sci, 206, 927 Tollefson, J., Wong, M. H., de Pater, I., et al. 2017, Icar, 296, 163 Trigo-Rodriguez, J. M., Sanchez-Lavega, A., Gomez, J. M., et al. 2000, P&SS, 48, 331 Vasavada, A. R., Ingersoll, A. P., Banfield, D., et al. 1998, Icar, 135, 265 Wong, M. H. 2011, in Proc. 2010, Fringing in the WFC3/UVIS Detector (Baltimore, MD: STScI Calibration Workshop) 13 The Astronomical Journal, 155:151 (13pp), 2018 April Simon et al.