This document describes the development of Intensity-Duration-Frequency (IDF) relationships for rainfall in Abha City, Saudi Arabia. The author analyzed 34 years of rainfall data from an Abha station to generate IDF curves using three statistical distributions - Gumbel, Log normal, and Log Pearson Type III. IDF curves were developed for eight durations from 10 to 720 minutes and six return periods from 2 to 100 years. Equations to calculate rainfall intensity based on duration and return period were derived for Abha using the three statistical techniques. The results from the techniques showed good agreement. The document also provides background on IDF relationships and reviews several previous related studies conducted in other regions.
Regional Rainfall Frequency Analysis By L-Moments Approach For Madina Region,...IJERDJOURNAL
ABSTRACT:- In arid regions, extreme rainfall event frequency predictions are still a challenging problem, because of the rain gauge stations scarcity and the record length limitation, which are usually short to insure reliable quantile estimates. Regional frequency analysis is one of the popular approaches used to compensate the data limitation. In this paper, regional frequency analysis of maximum daily rainfall is investigated for Madinah province in the Western Kingdom of Saudi Arabia (KSA). The observed maximum daily rainfall records of 20 rainfall stations are selected from 1968 to 2015. The rainfall data is evaluated using four tests, namely, Discordance test (Di), Homogeneity test (H), Goodness of fit test (Zdist) and L-moment ratios diagram (LMRD). The Di of L-moments shows that all the sites belong to one group (Di <3.0).><1). Finally, the Zdist is used to evaluate five probability distribution functions (PDFs) including generalized logistic (GLO), generalized extreme value (GEV), generalized normal (GNO), generalized Pareto (GPA), and Pearson Type III (PE3). Zdist and LMRD both showed that PE3 distribution is the best among the other PDFs. The regional parameters of the candidate PDF are computed using L-moments approach and accordingly the regional dimensionless growth curve is developed. The results enhance the accuracy of extreme rainfall prediction at-sites and also they can be used for ungauged catchment in the region.
Flood frequency analysis of river kosi, uttarakhand, india using statistical ...eSAT Journals
Abstract In the present study, flood frequency analysis has been applied for river Kosi in Uttarakhand. The river Kosi is an important tributary of Ganga river system, which arising from Koshimool near Kausani, Almora district flows on the western side of the study area and to meet at Ramganga River. The annual flood series analysis has been carried out to estimate the flood quantiles at different return period at Kosi barrage site of river Kosi. The statistical approach provided a significant advantage of estimation of flood at any sites in the homogenous region with very less or no data. In the at –site analysis of annual flood series the Normal, Log normal, Pearson type III, Log Pearson type III, Gumbel and Log Gumbel distribution were applied using method of moments . From the analysis of different goodness of fit tests, it has been found that the Log Gumbel distribution with method of moment as parameters estimation found to be the best-fit distribution for Kosi River and other sites in the region. It is recommended that the regional parameters for Kosi Basin may be used only for primary estimation of flood and should be reviewed when more regional data available. Keywords: Flood Frequency Analysis, River Kosi, Annual Peak Flood discharge, Return Period, Goodness of fit Test.
Intensity-Duration-Frequency Curves and RegionalisationAM Publications
Storm sewers make up a large percentage of drainage system in an urban setup. The design of these
components are based on rainfall intensities of a specific design period for that location. These can be derived from
intensity-duration-frequency (IDF) relationship. These IDF relationships are derived from historical rainfall, using
an extreme value distribution for maximum rainfall intensity. In the present study the IDF curves and parameter
regionalisation were studied for various kinds of basins. These equation parameters can be then used to understand
the spatial variation of rainfall intensity in the study area. The parameter contour maps subsequently generated using
various interpolation method are then used for plotting IDF curves for any ungauged station in the basin.
On March 11, 2016, ICLR held a Friday Forum workshop entitled 'Mapping extreme rainfall statistics for Canada', led by Dr. Slobodan Simonovic of Western University.
Climate change is expected to increase the frequency and intensity of extreme rainfall events, affecting rainfall intensity-duration-frequency (IDF) curve information used in the design, maintenance and operation of water infrastructure in Canada. Presented in this lecture are analyses of precipitation data from 567 Environment Canada hydro-meteorological stations using the IDF_CC tool. Results for the year 2100 based on Canadian climate model and an ensemble of 22 GCMs have been generated. A spatial interpolation method was used to produce Canadian precipitation maps for events of various return periods. Results based on the Canadian climate model indicate a reduction in extreme precipitation in central regions of Canada and increases in other regions. Relative to the ensemble approach, the Canadian climate model results (a) suggest more spatial variability in change of IDFs, and (b) the ensemble approach generated generally lower values than the Canadian climate model.
Dr. Simonovic has extensive research, teaching and consulting experience in water resources systems engineering. He teaches courses in water resources and civil engineering systems. He actively works for national and international professional organizations. Dr. Simonovic’s primary research interest focuses on the application of systems approach to management of complex water and environmental systems. Most of his work is related to the integration of risk, reliability, and uncertainty in hydrology and water resources management. He has received a number of awards for excellence in teaching, research and outreach. He has published over 450 professional publications and three major textbooks. He was inducted to the Canadian Academy of Engineering in June of 2013.
It is based on Journal Paper named
"Mukherjee, M.K.2013, ’Flood Frequency Analysis of River Subernarekha, India, Using Gumbel’s extreme Value Distribution’, IJCER,Vol-3,Issue-7,pp-12-18."
I have studied the journal and make a PPT in the following.
I
Derivation Of Intensity Duration Frequency Curves Using Short Duration Rainfa...Mohammed Badiuddin Parvez
The estimation of rainfall intensity is commonly required for the design of hydraulic and water resources engineering control structures. The intensity-duration-frequency (IDF) relationship is a mathematical relationship between the rainfall intensity, the duration and the return period. The present study aimed the derivation of IDF curves of Yermarus Raingauge Station of Raichur District with 19 years of rainfall data (1998 to 2016). The Normal Distribution, Log Normal Distribution, Gumbel distribution, Pearson Type III Distribution and Log Pearsons Type III Distribution techniques are used to Find the rainfall intensity values of 2, 5, 10, 15, 30, 60, 120, 720, 1440 minutes of rainfall duration with different return period. Chi Square test was conducted to find the goodness of fit the short duration IDF using daily rainfall data are presented, which is input for water resources projects.
Projection of future Temperature and Precipitation for Jhelum river basin in ...IJERA Editor
In this paper, downscaling models are developed using a Multiple Linear Regression (MLR) for obtaining projections of mean monthly temperature and precipitation for Jhelum river basin. Precipitation and temperature data are the most frequently used forcing terms in hydrological models. However, the available General Circulation Models (GCMs), which are widely used nowadays to simulate future climate scenarios, do not provide those variables to the need of the models. The purpose of this study is therefore, to apply a statistical downscaling method and assess its strength in reproducing current climate and project future climate. Regression based downscaling technique was usedtodownscaletheCGCM3, HadCM3 and Echam5 GCMpredictionsoftheA1B scenario for the Jhelum river basin located in India. The Multiple Linear Regression (MLR) model shows an increasing trend in temperature in the study area until the end of the 21st century. The average annual temperature showed an increase of 2.37°, 1.50°C and 2.02°C respectively for CGCM3, HadCM3 and Echam5 models over 21st century under A1B scenario. The total annual precipitation decreased by 30.27%, 30.58°C and 36.53% respectively for CGCM3, HadCM3 and Echam5 models over 21st century in A1B scenario using MLR technique. The performance of the linear multiple regression models was evaluated based on several statistical performance indicators.
ASSESSING THE EFFECTS OF SPATIAL INTERPOLATION OF RAINFALL ON THE STREAMFLOW ...civej
Precipitation within a river basin varies spatially and temporally and hence, is the most relevant input for
hydrologic modelling. Various interpolation methods exist to distribute rainfall spatially within a basin.
The sparse distribution of raingauge stations within a river basin and the differences in interpolation
methods can potentially impact the streamflow simulated using a hydrologic model. The present study
focuses on assessing the effect of spatial interpolation of rainfall using Theissen polygon, Inverse distance
weighted (IDW) method and Ordinary Kriging on the streamflow simulated using a physically based
spatially distributed model-SHETRAN in Vamanapuram river basin in Southern Kerala, India. The
SHETRAN model in the present study utilises rainfall data from the available rain gauge stations within the
basin and potential evapo-transpiration calculated using Penman-Monteith method, along with other input
parameters like soil and landuse. Four years of rainfall and evapo-transpiration data on a daily scale is
used for model calibration and one year data for validation. The performance of the different spatial
interpolation methods were assessed based on the Mean Annual flow and statistical parameters like NashSutcliffe
Efficiency, coefficient of determination. The ordinary kriging and IDW methods were found to be
satisfactory in the spatial interpolation of rainfall.
A rainfall-runoff model for Chew and Kinder Reservoirs, Peak District; utilising the Flood Studies Report to find whether the dams at Chew and Kinder could withstand a 1-in-10,000 year storm (UK recommended safety limit)
Grade: 91%
Empirical equations for flood analysis in arid zonesAmro Elfeki
Mohammad Albishi, Jarbou Bahrawi, and Amro Elfeki (2016). Empirical Equations for Flood Analysis in Arid Zones. Published in the book of abstracts at IWC 2016 International Water Conference 2016 on Water Resources in Arid Areas: the Way Forward.
Determining The Coefficient Of Tr, Α And River Length (L) Of Flood Runoff Mod...iosrjce
IOSR Journal of Mechanical and Civil Engineering (IOSR-JMCE) is a double blind peer reviewed International Journal that provides rapid publication (within a month) of articles in all areas of mechanical and civil engineering and its applications. The journal welcomes publications of high quality papers on theoretical developments and practical applications in mechanical and civil engineering. Original research papers, state-of-the-art reviews, and high quality technical notes are invited for publications.
A study confined to the lower tapi basin in Gujarat, India to find out the primary causes for 2006 floods in Surat city. The study involves collection of topographical data from the local geological survey organization, rainfall data from meteorological department of india and the application of HEC-HMS software from US Army corps of engineers to identify the primary cause of the runoff.
Rainfall-Runoff Modelling using Modified NRCS-CN,RS and GIS -A Case StudyIJERA Editor
Study of rainfall and runoff for any area and modeling it, is one of the important aspects for planning and
development of water resources. The development of water resources and its effective management plays a vital
role in development of any country more particularly in India, which is an agricultural based economy. Hence it
is intended to develop a model of Rainfall and runoff to a river basin and also apply the methodology to Sarada
River Basin which has drainage area of 1252.99 Sq.km. The basin is situated in Vishakhapatnam district of
Andhra Pradesh, India. The rainfall and runoff data has been collected from the gauging stations of the basin
apart from rainfall data from nearby stations. MNRCS-CN method has been adopted to calculate runoff. Various
hydrological parameters like soil information, rainfall, land use and land cover (LU/LC) were considered to use
in MNRCS-CN method. The depth of runoff has been computed for different land use patterns using, IRS-P4-
LISS IV data for the study area. Based on the analysis, land use/land cover pattern of Sarada River Basin has
been prepared. The land use/land cover patterns were also visually interpreted and digitized using ERDAS
IMAGINE software. The raster data was processed in ERDAS and geo-referenced and various maps viz. LU/LC
maps, drainage map, contour map, DEM (Digital elevation model) have been generated apart from rainfall
potential map using GIS tool. The estimated runoff using MNRCS-CN model has been simulated and compared
with that of actual runoff. The performance of the model is found to be good for the data considered. The
coefficient of determination R2
value for the observed runoff and that of the computed runoff is found to be
more than 0.72 for the selected watershed basin.
An Attempt To Use Interpolation to Predict Rainfall Intensities tor Crash Ana...IJMERJOURNAL
ABSTRACT: This study uses different interpolation techniques to predict rainfall intensity at locationsthat are not directly located near a rainfall gauges. The goal of being able to interpolate the rainfall intensity is to study its impact on traffic crashes. To perform the study, a collection of rainfall gauges in Alabama were used as subject locations where rainfall intensity was predicted from surrounding gauges, while also providing validation data to compare the predictions. Essentially, the actual rainfall intensities at existing gauges were interpolated using nearby gauges and the results were analyzed.The interpolation techniques used in the study included proximal, averaging and a distance weighted average. The results of the study indicated that none of the interpolation methodologies were sufficient to accurately predict the rainfall intensity values any significant distance from the actual gauges.
Scale-dependency and Sensitivity of Hydrological Estimations to Land Use and ...Beniamino Murgante
Scale-dependency and Sensitivity of Hydrological Estimations to Land Use and Topography for a Coastal Watershed in Mississippi - Vladimir J. Alarcon and Charles G. O’Hara
DESIGN A HYDRAULIC STRUCTURE USING THE RAINFALL INTENSITY- DURATION- FREQUENC...IAEME Publication
A hydrologic analysis is an essential prerequisite for any project, is used to the evaluation of the watershed area for a stream and is used to determine the design discharge or the amount of runoff the culvert should be designed to convey. In this paper the relationship between the intensity duration-
and frequency of rainfall are used to obtain the value of discharge to design a pipe culvert for Najaf station in Iraq, from the relationship between Intensity-duration-frequency (IDF) curves, the values of intensity for 10, 100 years return periods with 15, 30, and 60 min. durations are obtained and discharge values are obtained from multiplied the catchment area for Najaf station by the values of intensity for obtaining.
Islamic Finance: An Effective & Reasonable Optioniosrjce
In Islamic finance - financial institutions, products and services designed to comply with the central
tenets of Sharia (Islamic law) – is one of the most rapidly growing segments in global financial services. Islamic
finance starts from one basic concept that is to avoid trading directly present for future money. Finance is
provided in the form of money in return for either equity or rights to share proportionately in future business
profits. It is also provided in the form of goods and services delivered in return for commitment to repay their
value at a future date. This is an obvious option in addition to the conventional practices of interest-based
finance through which people borrow money and pay it back in the future in addition to interest. This paper
addresses itself to four questions: (1) Why all the fuss about the rate of interest? (2) Is Islamic finance, as an
alternative to interest based debt finance viable and effective? (3) What Islamic finance implies for the whole
economy? (4) Given that Islamic finance is really viable, why it has not been adopted at a larger scale?
Honour Lee Kuan Yew By Sharing One Lesson You Learnt From His Life & If It's Good, We Will Publish It! : nextsingaporestory.sg
A Poem written by Mike Ang(Nextsingaporestory.sg) to honour Mr Lee Kuan Yew.
A Dynamic Analysis of the Impact of Capital Flight on Real Exchange Rate in N...iosrjce
This study examines the dynamic effect of capital flight on the real exchange rate of the naira.
Specifically this study seeks to investigate if a long-run relationship exists between real exchange rate and
capital flight in Nigeria. This will be done using quarterly time series data covering the period 1981 to 2009. In
this process the short-run dynamics of the interactions between the two variables will be analyzed.
GENERATION OF IDF CURVES IN ARID AND SEMI-ARID AREAS: CASE STUDY HURGHADA, EGYPTIAEME Publication
Intensity-Duration-Frequency (IDF) curves are commonly used in water resources projects and hydrological analyses. One of the most important requirements for creating IDF curves is the actual distribution of rainfall intensity during the period of rainfall, but usually short-duration rainfall records are rare in arid regions while daily rainfall data are available. Hydrologists can generate short-duration rainfall data from daily rainfall data through using the Natural Resources Conservation Service (NRCS) standard synthetic rainfall distributions. The main purpose of this paper is to show the procedure to be followed in developing the IDF curves using the daily rainfall data recorded at the Hurghada weather station. Frequency analysis of the observed rainfall records was performed using HyfranPlus software. The gamma distribution is the most widely accepted probability distribution in this research.
DELINEATION OF FLOOD-PRONE AREAS THROUGH THE PERSPECTIVE OF RIVER HYDRAULICSDasapta Erwin Irawan
Flash floods in the Saka River (part of the KUSW) struck Muara Dua District with a population of 177.47 people/km2 on May 8th, 2020, due to increased rainfall intensity and land cover changes upstream. Based on this incident, this research will examine hydraulic parameters that directly implications for potential flooding. The rainfall intensity analysis was based on calculations from the Gumbel-Sherman equation in the baseline period 2011-2020. Then the parameters of the runoff coefficient consisting of the slope, land cover, and type of lithology are analyzed by the Hassing method. The results of the rainfall intensity analysis showed that the lowest intensity occurred in August while the highest power occurred in November and April. The runoff coefficient of 53% has implications for peak flow discharge which has an average increase of 11.6%. Flood simulation in KUSW modeled with Hydrologic Engineering Center-River Analysis System (HEC-RAS) software shows 174.4 km2 potential flooding in the five years of the return period and 200 km2 in the ten years of the return period. This analysis model is used as a preventive effort and reduces the negative impact around KUSW.
Streamflow simulation using radar-based precipitation applied to the Illinois...Alireza Safari
This paper describes the application of a spatially distributed hydrological model WetSpa (Water and Energy Transfer between Soil, Plants and Atmosphere) using radar-based rainfall data provide by the United States Hydrology Laboratory of NOAA's National Weather Service for a distributed model intercomparison project. The model is applied to the
river basin above Tahlequah hydrometry station with 30-m spatial resolution and one hour time--step for a total simulation period of 6 years. Rainfall inputs are derived from radar. The distributed model parameters are based on an extensive database of watershed characteristics available for the region, including digital maps of DEM, soil type, and land use. The model is calibrated and validated on part of the river flow records. The simulated hydrograph shows a good correspondence with observation (Nash efficiency coeffiecient >80%, indicating that the model is able to simulate the relevant hydrologic processes in the basin accurately.
ESTIMATION OF NRCS CURVE NUMBER FROM WATERSHED MORPHOMETRIC PARAMETERS: A CAS...IAEME Publication
The NRCS-CN equation for flood predictions relies on the value of the Curve Number and the amount of rainfall event to determine the corresponding runoff. Usually, the curve number value (CN value) is extracted from the tables that follow United State land features classification which might not be applicable to the land features in Saudi Arabia. This research paper doesn’t use NRCS-CN table values form of the US for estimating the curve number value, rather, the CN values have been estimated from the data of rainfall and runoff events of some gauged watersheds in the western region of Saudi Arabia (Yiba watershed and its sub-basins).
Revision of the Rainfall Intensity Duration Frequency Curves for the City of ...theijes
This work involves the revision of the Rainfall Intensity Duration Frequency (IDF) Curves for the city of Kumasi. Annual Maximum Rainfall depths of various durations over twenty-two years were obtained from the Ghana Meteorological Services. The data set was then subjected to frequency analysis to determine the distribution of which best characterize the data set. The annual maximum series were found to be drawn from the Gumbel distribution whose parameters were computed by fitting the statistics to the data. The Chi-square test and the Kolmogorov-Smirnov test prove the appropriateness of the fitting. Since the data available was only 22 years, IDF values for return periods higher than 22 years were obtained using frequency factors. The IDF estimates resulting from this work have been compared with the existing IDF curves prepared by J.B Danquah. The results show that for shorter durations (12 min and 24 min), the new IDF Curves give higher intensities for the same return period; the percentage increase ranges between 2% and 25%, whiles for longer durations (42min, 1 hr, 2hr, 3hr, 6hr, 12hr and 24 hr), the new IDF Curves give lower intensities for the same return period with the percentage decrease ranging between 3% and 49% when compared with the existing J.B Danquah IDF Curves. This might be as a result of low precipitation trends for shorter durations and high precipitation trends for longer durations in 1970s and before. These therefore call for the revision and updating of the existing IDF Curves for all the major cities and towns in Ghana to take into account the effect of climate change
The surface soil moisture content (SSMC) is of great importance to the discipline of hydrology as well as to the other relevant studies and applications. Pioneer studies have pointed out that the most promising technique to retrieve SSMC regarding to accuracy and cost-effective belongs to the micro-wave remote sensing. By means of field observed SSMC dataset collected from the Yihe watershed located on the Linyi district, Shangdong province, China, we analyzed and validated the daily AMER-E SSMC products for the year of 2006 with the focus to examine the products quality of AMER-E SSMC for further studies by using the products. The results suggested that the temporal variation trend of AMER-E remotely sensed SSMC is reasonably consistent to the field observed, but is systematic lower than the ground truth in value in the whole year. The correspondence of AMSR-E SSMC product is significant enough compared with the field observed for the whole year except of the month of July and August.
Revision of the Rainfall Intensity Duration Frequency Curves for the City of ...theijes
This work involves the revision of the Rainfall Intensity Duration Frequency (IDF) Curves for the city of Kumasi. Annual Maximum Rainfall depths of various durations over twenty-two years were obtained from the Ghana Meteorological Services. The data set was then subjected to frequency analysis to determine the distribution of which best characterize the data set. The annual maximum series were found to be drawn from the Gumbel distribution whose parameters were computed by fitting the statistics to the data. The Chi-square test and the Kolmogorov-Smirnov test prove the appropriateness of the fitting. Since the data available was only 22 years, IDF values for return periods higher than 22 years were obtained using frequency factors. The IDF estimates resulting from this work have been compared with the existing IDF curves prepared by J.B Danquah. The results show that for shorter durations (12 min and 24 min), the new IDF Curves give higher intensities for the same return period; the percentage increase ranges between 2% and 25%, whiles for longer durations (42min, 1 hr, 2hr, 3hr, 6hr, 12hr and 24 hr), the new IDF Curves give lower intensities for the same return period with the percentage decrease ranging between 3% and 49% when compared with the existing J.B Danquah IDF Curves. This might be as a result of low precipitation trends for shorter durations and high precipitation trends for longer durations in 1970s and before. These therefore call for the revision and updating of the existing IDF Curves for all the major cities and towns in Ghana to take into account the effect of climate change
Best Fit and Selection of Probability Distribution Models for Frequency Analy...IJERD Editor
Frequency analysis of extreme low mean annual rainfall events is important to water resource planners at catchment level because mean annual rainfall is an important parameter in determining mean annual runoff. Mean annual runoff is an important input in determining surface water available for water resource infrastructure development. In order to carry out frequency analysis of extreme low mean annual rainfall events, it is necessary to identify the best fit probability distribution models (PDMs) for the frequency analysis. The primary objective of the study was to develop two model identification criteria. The first criterion was developed to identify candidate probability distribution models from which the best fit probability distribution models were identified. The second criterion was applied to select the best fit probability distribution models from the candidate models. The secondary objectives were:
Presentation of Four Centennial-long Global Gridded Datasets of the Standardi...Agriculture Journal IJOEAR
Abstract— In this article four global gridded datasets of the Standardized Precipitation Index (SPI) are presented. They are computed from four different data sources: UDEL/GEOG/CCR v3.02, GPCC/ v7.0, NOAA-CIRES 20CR v2c and ECMWF ERA-20C each covering more than a century-long period. The SPI is calculated for the most frequently used time windows of 1, 3, 6, and 12 months. UDEL/GEOG/CCR v3.02 and GPCC/ v7.0 are used in the highest native resolution of 0.5×0.5° whilst NOAA-CIRES 20CR v2c and ECMWF ERA-20C are interpolated at 1.5×1.5° and 0.5×0.5° correspondingly. In contrast to some other indices, for example the popular Palmer Drought Severity Index (PDSI), SPI has significant advantages such as simplicity, suitability on variable time scales and robustness rooted in a solid theoretical development. SPI has been selected by the World Meteorological Organization (WMO) as a key indicator for monitoring drought ('Lincoln declaration'). As a result, drought monitoring centres worldwide are effectively exploiting this index and the National Meteorological and Hydrological Services (NMHSs) are encouraged to use it for monitoring meteorological droughts. These facts and the strong conviction of the authors that the free exchange of data and software services are а basis of effective scientific collaboration, are the main motivators to provide these datasets free of charge at ftp://xeo.cfd.meteo.bg/SPI/. The paper briefly presents some possible applications of the SPI data, revealing its suitability for various objective long-term drought studies at any geographical location.
Geostatistical analysis of rainfall variability on the plateau of Allada in S...IJERA Editor
The goal of this survey is to contribute to a better understanding of the distribution of the rainfall on the plateau
of Allada in Benin. The plateau of Allada is the garner ofCotonou and vicinities. The food production is over
62% rainfed.Then, it imports to analyze the way how rains are spatially distributed on the area in order to deduct
the potential rainfall. To achieve this goal, rainfall data of 28 stations have been used. Three sub-periods have
been identified: 1996-2000, 2001-2005 and 2006-2010. The distribution of rainfall has been established with
Thiessen and kriging methods. On average, 1117mm of rain fell on the study area per year. But three tendencies
were shown: the less rainy zones, the fairly rainy zones, and the greatly rainy zones. All the rainfall zones knew
an increase of the precipitations except Abomey-Calavi and Niaouli. But the variations are not significant. While
analyzing the spatial structure for the kriging of precipitations, it was revealed a power model of variogram. The
direction of the rainfall gradient is oriented southeast - northwest during the three sub-periods. Abomey-Calavi
recorded the weakest precipitations. The strongest values are interchanged between Toffo and Sékou, OuidahNorth
and Ouidah-City.
Fitting Probability Distribution Functions To Discharge Variability Of Kaduna...IJMER
International Journal of Modern Engineering Research (IJMER) is Peer reviewed, online Journal. It serves as an international archival forum of scholarly research related to engineering and science education.
International Journal of Engineering Research and Development (IJERD)IJERD Editor
journal publishing, how to publish research paper, Call For research paper, international journal, publishing a paper, IJERD, journal of science and technology, how to get a research paper published, publishing a paper, publishing of journal, publishing of research paper, reserach and review articles, IJERD Journal, How to publish your research paper, publish research paper, open access engineering journal, Engineering journal, Mathemetics journal, Physics journal, Chemistry journal, Computer Engineering, Computer Science journal, how to submit your paper, peer reviw journal, indexed journal, reserach and review articles, engineering journal, www.ijerd.com, research journals,
yahoo journals, bing journals, International Journal of Engineering Research and Development, google journals, hard copy of journal
Dev Dives: Train smarter, not harder – active learning and UiPath LLMs for do...UiPathCommunity
💥 Speed, accuracy, and scaling – discover the superpowers of GenAI in action with UiPath Document Understanding and Communications Mining™:
See how to accelerate model training and optimize model performance with active learning
Learn about the latest enhancements to out-of-the-box document processing – with little to no training required
Get an exclusive demo of the new family of UiPath LLMs – GenAI models specialized for processing different types of documents and messages
This is a hands-on session specifically designed for automation developers and AI enthusiasts seeking to enhance their knowledge in leveraging the latest intelligent document processing capabilities offered by UiPath.
Speakers:
👨🏫 Andras Palfi, Senior Product Manager, UiPath
👩🏫 Lenka Dulovicova, Product Program Manager, UiPath
LF Energy Webinar: Electrical Grid Modelling and Simulation Through PowSyBl -...DanBrown980551
Do you want to learn how to model and simulate an electrical network from scratch in under an hour?
Then welcome to this PowSyBl workshop, hosted by Rte, the French Transmission System Operator (TSO)!
During the webinar, you will discover the PowSyBl ecosystem as well as handle and study an electrical network through an interactive Python notebook.
PowSyBl is an open source project hosted by LF Energy, which offers a comprehensive set of features for electrical grid modelling and simulation. Among other advanced features, PowSyBl provides:
- A fully editable and extendable library for grid component modelling;
- Visualization tools to display your network;
- Grid simulation tools, such as power flows, security analyses (with or without remedial actions) and sensitivity analyses;
The framework is mostly written in Java, with a Python binding so that Python developers can access PowSyBl functionalities as well.
What you will learn during the webinar:
- For beginners: discover PowSyBl's functionalities through a quick general presentation and the notebook, without needing any expert coding skills;
- For advanced developers: master the skills to efficiently apply PowSyBl functionalities to your real-world scenarios.
Software Delivery At the Speed of AI: Inflectra Invests In AI-Powered QualityInflectra
In this insightful webinar, Inflectra explores how artificial intelligence (AI) is transforming software development and testing. Discover how AI-powered tools are revolutionizing every stage of the software development lifecycle (SDLC), from design and prototyping to testing, deployment, and monitoring.
Learn about:
• The Future of Testing: How AI is shifting testing towards verification, analysis, and higher-level skills, while reducing repetitive tasks.
• Test Automation: How AI-powered test case generation, optimization, and self-healing tests are making testing more efficient and effective.
• Visual Testing: Explore the emerging capabilities of AI in visual testing and how it's set to revolutionize UI verification.
• Inflectra's AI Solutions: See demonstrations of Inflectra's cutting-edge AI tools like the ChatGPT plugin and Azure Open AI platform, designed to streamline your testing process.
Whether you're a developer, tester, or QA professional, this webinar will give you valuable insights into how AI is shaping the future of software delivery.
Key Trends Shaping the Future of Infrastructure.pdfCheryl Hung
Keynote at DIGIT West Expo, Glasgow on 29 May 2024.
Cheryl Hung, ochery.com
Sr Director, Infrastructure Ecosystem, Arm.
The key trends across hardware, cloud and open-source; exploring how these areas are likely to mature and develop over the short and long-term, and then considering how organisations can position themselves to adapt and thrive.
Essentials of Automations: Optimizing FME Workflows with ParametersSafe Software
Are you looking to streamline your workflows and boost your projects’ efficiency? Do you find yourself searching for ways to add flexibility and control over your FME workflows? If so, you’re in the right place.
Join us for an insightful dive into the world of FME parameters, a critical element in optimizing workflow efficiency. This webinar marks the beginning of our three-part “Essentials of Automation” series. This first webinar is designed to equip you with the knowledge and skills to utilize parameters effectively: enhancing the flexibility, maintainability, and user control of your FME projects.
Here’s what you’ll gain:
- Essentials of FME Parameters: Understand the pivotal role of parameters, including Reader/Writer, Transformer, User, and FME Flow categories. Discover how they are the key to unlocking automation and optimization within your workflows.
- Practical Applications in FME Form: Delve into key user parameter types including choice, connections, and file URLs. Allow users to control how a workflow runs, making your workflows more reusable. Learn to import values and deliver the best user experience for your workflows while enhancing accuracy.
- Optimization Strategies in FME Flow: Explore the creation and strategic deployment of parameters in FME Flow, including the use of deployment and geometry parameters, to maximize workflow efficiency.
- Pro Tips for Success: Gain insights on parameterizing connections and leveraging new features like Conditional Visibility for clarity and simplicity.
We’ll wrap up with a glimpse into future webinars, followed by a Q&A session to address your specific questions surrounding this topic.
Don’t miss this opportunity to elevate your FME expertise and drive your projects to new heights of efficiency.
Transcript: Selling digital books in 2024: Insights from industry leaders - T...BookNet Canada
The publishing industry has been selling digital audiobooks and ebooks for over a decade and has found its groove. What’s changed? What has stayed the same? Where do we go from here? Join a group of leading sales peers from across the industry for a conversation about the lessons learned since the popularization of digital books, best practices, digital book supply chain management, and more.
Link to video recording: https://bnctechforum.ca/sessions/selling-digital-books-in-2024-insights-from-industry-leaders/
Presented by BookNet Canada on May 28, 2024, with support from the Department of Canadian Heritage.
UiPath Test Automation using UiPath Test Suite series, part 4DianaGray10
Welcome to UiPath Test Automation using UiPath Test Suite series part 4. In this session, we will cover Test Manager overview along with SAP heatmap.
The UiPath Test Manager overview with SAP heatmap webinar offers a concise yet comprehensive exploration of the role of a Test Manager within SAP environments, coupled with the utilization of heatmaps for effective testing strategies.
Participants will gain insights into the responsibilities, challenges, and best practices associated with test management in SAP projects. Additionally, the webinar delves into the significance of heatmaps as a visual aid for identifying testing priorities, areas of risk, and resource allocation within SAP landscapes. Through this session, attendees can expect to enhance their understanding of test management principles while learning practical approaches to optimize testing processes in SAP environments using heatmap visualization techniques
What will you get from this session?
1. Insights into SAP testing best practices
2. Heatmap utilization for testing
3. Optimization of testing processes
4. Demo
Topics covered:
Execution from the test manager
Orchestrator execution result
Defect reporting
SAP heatmap example with demo
Speaker:
Deepak Rai, Automation Practice Lead, Boundaryless Group and UiPath MVP
"Impact of front-end architecture on development cost", Viktor TurskyiFwdays
I have heard many times that architecture is not important for the front-end. Also, many times I have seen how developers implement features on the front-end just following the standard rules for a framework and think that this is enough to successfully launch the project, and then the project fails. How to prevent this and what approach to choose? I have launched dozens of complex projects and during the talk we will analyze which approaches have worked for me and which have not.
Let's dive deeper into the world of ODC! Ricardo Alves (OutSystems) will join us to tell all about the new Data Fabric. After that, Sezen de Bruijn (OutSystems) will get into the details on how to best design a sturdy architecture within ODC.
State of ICS and IoT Cyber Threat Landscape Report 2024 previewPrayukth K V
The IoT and OT threat landscape report has been prepared by the Threat Research Team at Sectrio using data from Sectrio, cyber threat intelligence farming facilities spread across over 85 cities around the world. In addition, Sectrio also runs AI-based advanced threat and payload engagement facilities that serve as sinks to attract and engage sophisticated threat actors, and newer malware including new variants and latent threats that are at an earlier stage of development.
The latest edition of the OT/ICS and IoT security Threat Landscape Report 2024 also covers:
State of global ICS asset and network exposure
Sectoral targets and attacks as well as the cost of ransom
Global APT activity, AI usage, actor and tactic profiles, and implications
Rise in volumes of AI-powered cyberattacks
Major cyber events in 2024
Malware and malicious payload trends
Cyberattack types and targets
Vulnerability exploit attempts on CVEs
Attacks on counties – USA
Expansion of bot farms – how, where, and why
In-depth analysis of the cyber threat landscape across North America, South America, Europe, APAC, and the Middle East
Why are attacks on smart factories rising?
Cyber risk predictions
Axis of attacks – Europe
Systemic attacks in the Middle East
Download the full report from here:
https://sectrio.com/resources/ot-threat-landscape-reports/sectrio-releases-ot-ics-and-iot-security-threat-landscape-report-2024/
PHP Frameworks: I want to break free (IPC Berlin 2024)Ralf Eggert
In this presentation, we examine the challenges and limitations of relying too heavily on PHP frameworks in web development. We discuss the history of PHP and its frameworks to understand how this dependence has evolved. The focus will be on providing concrete tips and strategies to reduce reliance on these frameworks, based on real-world examples and practical considerations. The goal is to equip developers with the skills and knowledge to create more flexible and future-proof web applications. We'll explore the importance of maintaining autonomy in a rapidly changing tech landscape and how to make informed decisions in PHP development.
This talk is aimed at encouraging a more independent approach to using PHP frameworks, moving towards a more flexible and future-proof approach to PHP development.
GraphRAG is All You need? LLM & Knowledge GraphGuy Korland
Guy Korland, CEO and Co-founder of FalkorDB, will review two articles on the integration of language models with knowledge graphs.
1. Unifying Large Language Models and Knowledge Graphs: A Roadmap.
https://arxiv.org/abs/2306.08302
2. Microsoft Research's GraphRAG paper and a review paper on various uses of knowledge graphs:
https://www.microsoft.com/en-us/research/blog/graphrag-unlocking-llm-discovery-on-narrative-private-data/
International Journal of Computational Engineering Research(IJCER)
1. International Journal of Computational Engineering Research||Vol, 03||Issue, 10||
Development of Intensity-Duration-Frequency Relationships for
Abha City in Saudi Arabia
Khalid K. Al-anazi1, Dr.Ibrahim H. El-Sebaie2
Master'student, Dept.of Civil Engineering, King Saud University, College of Engineer, Saudi Arabia 1
Doctor, Dept.of Civil Engineering, King Saud University, College of Engineer, Saudi Arabia 2
ABSTRACT:
Intensity-Duration-Frequency (IDF) relationship of rainfall amount is one of the most
commonly used tools in water recourses engineering. The IDF relationships are used as an aid when
designing drainage works for any engineering project, and allow the engineer to design safe and
economical flood control measures. The main objective of this paper is to develop the rainfall
intensity-duration-frequency relationships (IDF) curves and to derive a relationship between
intensities and durations for a number of recurrence intervals through regression of generated IDF
curves for Abha city in the Kingdom of Saudi Arabia. These curves have been generated from a 34year recorded rainfall data for Abah region. Different frequency analysis techniques have been used
to develop the relationship from rainfall data between the rainfall intensity, storm duration, and
return periods from rainfall data for Abha region. These techniques are: Gumble, Log normal and
Log Pearson Type III distribution. In order to do that, good record of the rainfall data was obtained
for different durations. These methods were used to obtain the IDF curves for eight different
durations (10, 20, 30, 60, 120, 180, 360, 720 mints) and six frequency periods (2, 5, 10, 25, 50, 100
years). It was shown that there were small differences between the results obtained from the three
methods. Rainfall intensities obtained from three methods showed good agreement of the study
area. Derived equations for calculating rainfall intensity for Abha region was obtained using three
techniques based on the results obtained from IDF data. Estimation of the parameters of the IDF
equations for different return periods was performed by using linear regression analysis. One of the
goodness-of-fit tests (chi-square test) was used to choose the best statistical distribution among
them.
1. INTRODUCTION
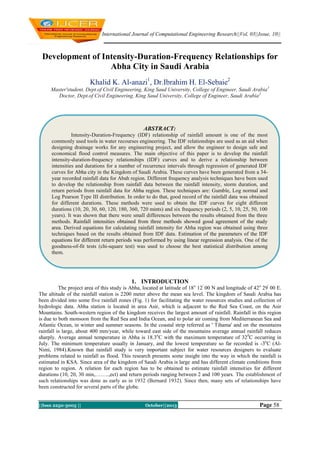
The project area of this study is Abha, located at latitude of 18 o 12' 00 N and longitude of 42o 29' 00 E.
The altitude of the rainfall station is 2200 meter above the mean sea level. The kingdom of Saudi Arabia has
been divided into some five rainfall zones (Fig. 1) for facilitating the water resources studies and collection of
hydrologic data. Abha station is located in area Asir, which is adjacent to the Red Sea Coast, on the Asir
Mountains. South-western region of the kingdom receives the largest amount of rainfall. Rainfall in this region
is due to both monsoon from the Red Sea and India Ocean, and to polar air coming from Mediterranean Sea and
Atlantic Ocean, in winter and summer seasons. In the coastal strip referred as ' Tihama' and on the mountains
rainfall is large, about 400 mm/year, while toward east side of the mountains average annual rainfall reduces
sharply. Average annual temperature in Abha is 18.3oC with the maximum temperature of 320C occurring in
July. The minimum temperature usually in January, and the lowest temperature so far recorded is -3oC (AlNimi, 1984).Known that rainfall study is very important subject for water resources designers to evaluate
problems related to rainfall as flood. This research presents some insight into the way in which the rainfall is
estimated in KSA. Since area of the kingdom of Saudi Arabia is large and has different climate conditions from
region to region. A relation for each region has to be obtained to estimate rainfall intensities for different
durations (10, 20, 30 min,……..,ect) and return periods ranging between 2 and 100 years. The establishment of
such relationships was done as early as in 1932 (Bernard 1932). Since then, many sets of relationships have
been constructed for several parts of the globe.
||Issn 2250-3005 ||
October||2013 ||
2013
Page 58
2. Development Of Intensity-Duration-Frequency…
Many previous studies have been done on rainfall analysis in various regions of the world.
Koutsoyiannis et al.,(1998) and Koutsoyiannis( 2003) cited that the IDF relationship is a mathematical
relationship between the rainfall intensity i, the duration d, and the return period T (or, equivalently, the annual
frequency of exceedance, typically referred to as "frequency" only).Lekan oyebande (1982), studied " Deriving
rainfall intensity-duration-frequency relationship and estimates for regions with inadequate data" used type 1
extreme- value distribution (Gumbel) was applied to the annual extreme rainfall data sets generated by 11
rainfall zones to estimate the parameters and hence the intensity-duration-frequency (IDF) rainfall. The chisquare test confirmed the appropriateness of the fitted distribution. Gumbel graphical plots and the computed
confidence limits also showed that the Gumbel EV-1 function fits well the empirical distributionIn 1998, a study
performed in Texas, “Regionalization of Precipitation Maxima for Texas” (Asquith, 1998) determined that the
annual maxima for the 12-hour and less durations were best fit using the generalized logistic distribution (GLO).
However, Asquith found that the generalized extreme value (GEV) distribution best fit his longer durations.
Mohammad Samawi and Najib Sabbagh (2004), studied application of motheds for analysis of rainfall
intensity in areas of Israeli, Jordanian, and Palestinian Interest. The purpose of that study was to describe the
meteorological conditions and precipitation data for a selected study area within the region, methods developed
to analyze precipitation data in the region, and results of a pilot application of the methods to analyze
precipitation data for selected precipitation stations in the study area. The methods included computer software
developed specifically for rainfall data compilation and analysis by the core parties, the management and
analysis of precipitation data. Naidal A. Hadadin, (2005), studied Rainfall Intensity–Duration–Frequency
Relationship in the Mujib Basin in Jordan. IDF equations were developed for each of the 8 rainfall recording
station in the basin. The 8 IDF equations obtained were compared with the curves obtained by Gumble method
and Water Authority of Jordan (WAJ). The results predicted by the writer were close to the measured values.
J.P.Raiford et al., (2007) developed Rainfall Depth-Duration-Frequency Relationships for South Carolina, North
Carolina, and Georgia using the available rainfall data. In this study, the product moment method and the Lmoment method with regional analysis were investigated for developing iospluvial maps and IDF curves for the
regions under study. The L-moment method with X-10 test was used to search for homogeneous regions within
the study area. The Map series was obtained at each site and fitted to the normal, lognormal, generalized
extreme value, Pearson type III, and log Pearson type III distribution for each duration. The distribution selected
based on the chi-square test was then used to find depth-duration-frequency (DDF) values at 2,10,25,50,and 100
years.
Marta bara et al, (2009), studied the estimation of IDF curves of extreme rainfall by simple scaling
theory to the intensity-duration-frequency (IDF) characteristics of short duration rainfall in Slovakia. The
rainfall data for the analysis consists of rainfall intensities of the durations ranging from 5 minutes to 180
minutes and daily rainfall amounts for 55 stations from the whole territory of Slovakia, taken from the historical
database. Al-Shaikh.A(1985) performed a study on the rainfall frequency for Saudi Arabia ,the purpose of the
study was to derive rainfall depth-duration-frequency relationship (DDF) for Saudi Arabia through analysis of
available rainfall intensity data for individual stations by using the EV1 (Gumble) distribution with the
application of maximum likelihood method. He divided Saudi Arabia to four regions by specifying certain
criteria, with curves and equations for each region by using EV1 (Gumble) distribution with application of
maximum likelihood method.
Jebreen M.Al-jebreen(1985) studied flood frequency analysis and a regional analysis for three basins in
South-Western region of the Kingdom. The magnitudes of floods for different return periods, 5,10,25,50 and
100 years, were calculated using the analytical and graphical extreme value Type I distribution and Log-Pearson
Type III distribution. The results obtained from the two distribution showed that the extreme value type I
distribution is the most suitable distribution for this region. And almost there is no difference between the results
of graphical and analytical solution. The Log Person Type III distribution gives inconsistent results, sometimes
over predicting magnitudes of floods, and in some cases the differences between say the 50 and 100 years floods
are very small.Al-Saleh.M(1994), studied frequency analysis of rainfall in al-auwayiyah area, Saudi Arabia. The
aim of this study was to identify the recurrence of the annual rainfall and the highest daily amount of rain per
year in the region. He used the probability distribution of the values of the maximum, and the method of "chi"
square (Goodness fit) to choose a good match for this distribution. He found that distribution is compatible with
the rainfall data at the level of 0.10, indicating that this distribution is compatible to a satisfactory degree. He
found also that the annual rainfall and the highest daily amount of rain per year follow the probability
distribution of the maximum values (EV1) at the significance level 0.10.
||Issn 2250-3005 ||
October||2013 ||
2013
Page 59
3. Development Of Intensity-Duration-Frequency…
S.A. AlHassoun, 2011 developed empirical formulae to estimate rainfall intensity in Riyadh region. He
found that there is no much difference in results of rainfall analysis of IDF curves in Riyadh area between
Gumbel and LPT III methods. He attributed this to that Riyadh region has semi-arid climate and flat topography
where variations of precipitation from is not big. Awadallah A.G. et al., 2011 presented a methodology to
overcome the lack of ground stations rainfall by the joint use of the available ground data with TRMM satellite
data to develop IDF curves and he used a method to develop ratios between 24-hr rainfall depth and shorter
duration depths. Elsebaie, I.H., 2011 conducted a study for the formulation and construction of IDF curves using
data from recording station in KSA by using two distribution methods (Gumbel and Log Pearson type III
Distribution). He found that Gumbel method gave some larger rainfall intensities estimates compared to Log
Pearson type III Distribution. Also, He derived IDF equations for the two regions (Najran and Central & Eastern
province) for duration varying from 10 to 1440 min and return period from 2 to 100 years. In general, the results
obtained using the two approaches is very close at most of the return periods and have the same trend.
Fig. 1 Rainfall zones in Saudi Arabia.
II. DATA COLLECTION
Rainfall intensity data are important for civil engineering works, because they are the basis on which
designs will be made. Data gathering are perhaps, the most difficult part of the paper. Historical rainfall
intensity data from different climatological stations were available from the Ministry of Water and Electricity
(MOWAE) in Riyadh, hydrology department (KSA), Abha station No.A-005. These data have been collected
since 1969 till 2003. So we have 34 years of record, which relatively a good record. The station A-005 which
collected the rainfall intensity is located at 18o 12' N and longitude of 42o 29' E and 2200 meter above the mean
sea level. Annual maximum of these data was selected for each duration of (10, 20, 30, 60, 120, 180, 360, 720
minutes) and plotted on logarithmic scale paper to obtain intensity-duration-frequency relationship with few
missing data and the other stations have very few records of the data which are not presentable at all to be
considered in the study.
III. DEVELOPMENT OFINTENSITY DURATIONFREQUENCY CURVES
For many hydrologic analyses, planning or design problems, reliable rainfall intensity estimates are
necessary. Rainfall intensity duration frequency relationship comprises the estimates of rainfall intensities of
different durations and recurrence intervals. There are commonly used theoretical distribution function were
applied in different regions all over the world (e.g. GEV, Gumbel, Log normal, Pearson type III distributions).
Gumbel distribution methodology was applied on different region all over the world. Different commonly
||Issn 2250-3005 ||
October||2013 ||
2013
Page 60
4. Development Of Intensity-Duration-Frequency…
frequency analysis techniques were used to develop the relationship between the rainfall intensity, storm
duration, and return periods from rainfall data for the regions under study. These techniques are: Gumbel
distribution, Log normal distribution, and log Pearson Type III distribution.
A.
Gu
mbel distribution
This distribution was first proposed by Gumble in 1941 for analysis of flood frequencies. Gumble
distribution methodology was selected to perform the flood probability analysis. The Gumble theory of
distribution is the most widely used distribution for relationship intensity duration frequency (IDF) analysis and
relatively simple and uses only extreme events (maximum values or peak rainfalls). The Gumbel method
calculates the 2, 5, 10, 25, 50 and 100-year return intervals for each duration period and requires several
calculations. In this method, from the raw data to compute the maximum precipitation (P) and the statistical
variables (arithmetic average and standard deviation) for each duration (10, 20, 30, 60, 120, 180, 360, 720
minutes) were computed
.
B.
Log Pearson type III
The Log Pearson type III (LPIII) probability model is used to calculate the rainfall intensity at different
rainfall durations and studies return periods to form the historical data IDF curves for each station. It is
commonly used in Vietnam. Log Pearson type III distribution involves logarithms of the measured values. The
mean and the standard deviation (statistical variables) are determined using the logarithmically transformed
data, using these frequency distribution functions, the maximum rainfall intensity for considered durations 2, 5,
10, 20, 50 and 100 years studies return periods. In the same manner as with Gumbel method, the rainfall
intensity duration frequency is obtained using LPIII method but using the logarithm of variables in the relations.
C. Log normal distribution
Application of normal logarithmic method requires converting rainfall values to logarithmic values (i.e.
logarithm values of the statistical variables). This distribution follows the same procedure of the Log Pearson
type III distribution but the Log normal distribution used KT by Gumbel method. Results of precipitation and
intensities value for eight durations(10, 20, 30, 60, 120, 180, 360 and 720 minutes) and six return periods using
Log normal distribution are obtained with same manner as before.
IV. DERIVATION OF IDF EQUATION
The intensity duration frequency (IDF) formulas are the empirical equations representing a relationship
among maximum rainfall intensity (as dependant variable) and other parameters of interest such as rainfall
duration and frequency (as independent variables). There are several commonly used functions relating those
variables previously mentioned found in the literature of hydrology applications (V.T.Chow, 1988).To derive an
equation for calculating rainfall intensity (It) for the regions of interest or the station, there are some required
steps for establishing an equation suit the calculation of rainfall intensity (I t) for a certain recurrence interval and
specific rainfall period which depends mainly on the results obtained from the intensity duration frequency
(IDF) curves and the corresponding logarithmic conversion, where it is possible to convert the equation into a
linear equation, and thus to calculate all the parameters related to the equation (see Chow (1988); Nhat el al.
(2006); AlHassoun (2011) and Elsebaie (2001)).The empirical parameters values (c, m, and e) shown in the
proposed equation ( I = C*Trm/Tde ) were estimated by analyzing the IDF data obtained from the applied
techniques using logarithmic relationships of dependent variables (T d and Tr ) against independent variable (It).
These parameters for Abha region are shown in Table (1).
Table (1)
Abah
Region
Parameter
c
m
e
the parameters values used in deriving formulas.
Gumbel
331.94
0.196
0.613
LPTIII
369.82
0.142
0.608
Log normal
287.42
0.307
0.611
Average
329.73
0.215
0.611
Thus so, the intensity duration frequency formula that can be used to be obtain rainfall intensity (I t) for any
design storm of specific duration (Td) and return period (Tr) for Abha region will be in the relation.
||Issn 2250-3005 ||
October||2013 ||
2013
Page 61
5. Development Of Intensity-Duration-Frequency…
It =
(1)
This concludes that the derived formula can be used to estimate any frequency rainfall data and to get deign
storm in Abha region.
V. GOODNESS OF FIT TEST
The aim of the test is to decide how good a fit is between the frequency of occurrence observed in a
sample and the expected frequencies obtained from the hypothesized distribution. A goodness-of-fit test
between observed and expected frequencies is based on the chi-square quantity, which is expressed as,
X2
2
/ Ei
(2)
Where,
Region
Distribution
Abha
X2 is a random variable whose sampling distribution is approximated very closely by the chi square
distribution. The symbols Oi and Ei represent the observed and expected frequencies, respectively, for the i-th
class interval in the histogram. The symbol k represents the number of class intervals. Since there is no fixed
rule for the choice of the number of class intervals. If the observed frequencies are close to the corresponding
expected frequencies, the X2 value will be small, indicating a good fit; otherwise, it is a poor fit. A good fit leads
to the acceptance of (null hypothesis), where as poor fit leads to its rejection. The critical region will, therefore,
fall in the right tail of the chi-square distribution. For a level of significance equal to , the critical value X2a is
found from readily available chi-square tables and X2 > constitutes the critical region (See A.A. Al-Shaikh,
1985). Table 2. Shows results of the chi-square goodness of fit test on annual series of rainfall.
Table (2): Results of chi-square goodness of fit test on annual maximum rainfall.
Gumbel
LPT III
Log normal
10
8.01
18.29
10.2
VI.
20
3.29
12.34
14.2
30
4.64
9.77
9.1
Duration (min)
60
120
6,71
2.94
6.29
9.76
14.7
15.4
180
6.97
15.41
14.7
360
3.23
18.29
13.3
720
5.33
9.24
8.6
RESULTS AND ANALYSIS
This study is about developing IDF curves and derives an empirical formula between intensities and
durations to estimate the rainfall intensity at Abha region in KSA. The curves allow the engineer to design safe
and economical flood control measures. Rainfall intensities (in mm/hr) estimates for various return periods and
different durations were analyzed using three techniques (Gumbel, Log normal and LPT III methods).
According to the IDF curves, rainfall intensities estimates are increasing with increase in the return period and
the rainfall intensities decrease with increase rainfall duration in the all return period. Rainfall intensities rise in
parallel with the rainfall return periods. The results obtained from the three methods have good consistency.
Figs 2-4 show results of the IDF curves obtained by Gumbel, LPIII and Log normal methods for Abha region. It
was shown that there were no much differences in the results of rainfall analysis of IDF curves in Abha area
between Gumbel, LPIII and Log normal methods. A derive equation, Eq. (1), was found to provide the best
correlated and consistent relationships of analytical and derived curves for Abha area. It used to estimate rainfall
intensity for various durations and different return periods to get deign storm in Abha region and can be used
instead of construction IDF curves. Also, goodness of –fit test were used to choose the best statistical
distribution among those techniques.. The results obtained from chi-square goodness of fit test for three methods
have good consistency, where Xcal < Xtab in all cases.
||Issn 2250-3005 ||
October||2013 ||
2013
Page 62
6. Development Of Intensity-Duration-Frequency…
Fig. 2 IDF curves by Gumbel method at Abah station (Log scale).
Fig. 3 IDF curves by LPT III at Abah station (Log scale).
||Issn 2250-3005 ||
October||2013 ||
2013
Page 63
7. Development Of Intensity-Duration-Frequency…
Fig. 4 IDF curves by Log normal method at Abah station (Log scale).
VII.
CONCLUSTION
This study has been conducted to derive a relationship between intensities and durations for a number
of recurrence intervals ranging between 2 and 100 years and construction of IDF curves using data from
recording station for Abha region by using three distribution methods: Gumbel, LPIII and Log normal
distribution. The results obtained using the three approaches are very close at most of the return periods and
have the same trend, this agrees with the results obtained by Al-Shaikh (1985) (station Abha, A001), very close
from the station used in that research. The results obtained from that work are consistent with the results from
previous studies. It can be concluded that these differences observed between the results of this study and the
results done before by Al-Shaikh (1985); this can be attributed to the record lengths of the rainfall data used for
this study. In this study used long record of the historical data starting from 1969 to 2003. The parameters of the
design storm intensity for a given period of recurrence were estimated for Abha region. The results obtained
showed a good match between the rainfall intensity computed by the methods used and the values estimated by
the derive formula.
The chi-square test was used to examine the combinations or contingency of the
observed and theoretical frequencies, and on the other hand, to decide about the type of distribution which the
available data set follows. The results of the chi-square test of goodness of fit showed that in all the durations
the null hypothesis that the extreme rainfall series have the Gumbel distribution, LPIII and Log normal
distribution are acceptable. Although the chi-square values are appreciably below the critical region using
Gumbel distribution, LPIII and Log normal distribution, it is difficult to say that one distribution is superior to
the other.
ACKNOWLEDGMENTS
All gratitude is due to Allah. The writer is thankful to the Ministry of Water and Electricity (MOWAE)
in Riyadh, hydrology department (KSA) for providing the data needed for the research. We deep thanks to all
who offered any direct or indirect assistance in the completion of this research.
REFERENCES
[1]
[2]
[3]
[4]
[5]
[6]
V.T. Chow, "Handbook of Applied Hydrology", McGraw-Hill Book, 1988.
Ministry of water and electricity (MOWE) in Riyadh (2011),"Hydrological Department" in Saudi Arabia.
Hassan Al-Niemi, " Rainfall frequency analysis of abha area " M.S. Thesis, Civil Engineering Department; King
University, Riyadh (K.S.A), 1984.
M.A.Al-Saleh," Frequency Analysis of Rainfall in Al-Quwayiyah Area, Saudi Arabia", Resarch Papers in Geography;
Saud
University, Riyadh (K.S.A), 1994.
A.A. Al-Shaikh, "Rainfall frequency studies for Saudi Arabia", M.S. Thesis, Civil Engineering Department; King
University, Riyadh (K.S.A), 1985.
J.M.Al-Jebreen,"Flood Frequency and Regional Analysis For Some Selected Basins In Saudi Arabia", B.S. Project,
Engineering Department; King Saud University, Riyadh (K.S.A), Decmber.1985.
||Issn 2250-3005 ||
October||2013 ||
2013
Saud
King
Saud
Civil
Page 64
8. Development Of Intensity-Duration-Frequency…
[7]
[8]
[9]
[10]
[11]
[12]
[13]
[14]
[15]
[16]
H.A. Al-Khalaf, " Predicting short-duration, high-intensity rainfall in Saudi Arabia", M.S. Thesis, Faculty of the college of
Graduate Studies; king Fahd University of Petroleum & Minerals, Dahran,(K.S.A), 1997.
D.Koutsoyiannis, D.Kozonis, and A.Manetas, "A mathematical Framework for Studing Rainfall Intensity-Duration-Frequency
Relationship",J.Hydrol., 206: 118-135, 1998.
Asquith,William H."Regionalization of Precipation Maxima for Texas".U.S. Geological Survey, Water Resources Division,
1998.
N.A. Hadadin,"Rainfall Intensity-Duration-Frequency Relationship in the Mujib basin in Jourdan ",Journal of
Applied Science 8(10):1777-1784,2005.
M. Samaw and, N. Sabbagh, "Application of Methods for Analysis of Rainfall Intensity in Areas of Israeli", Jordanian, and
Palestinian Interest, Jordanian Meteorological Department, Ministry of Water and Irrigation, Amman, Jordan, 2004.
Marta bara,silvia kohnova,Ladislva gaal,Jan szolgay,Kamila hlavcova),"estimation of IDF curves of extreme rainfall by simple
scaling in Slovakia". Contribution to
Geophysics and Geodesy. Vol 39/3, 2009 (187-206,(2009).
A.G. Awadallah, M. ElGamal, A. ElMostafa, and H. ElBadry, "Developing Intensity-Frequency Curves in Scarce Data Region:
An Approach using Regional Analysis and Satellite Data”, Scientific Research Publishing, Engineering, 2011,3,215-226.
J.P. Raiford, N.M. Aziz, A.A. Khan and D.N. Powel "Rainfall Depth-Duration-Frequency Relationships for Soujth Carolina, and
Georgia”, American Journal of Environmental Sciences 3 (2): 78-84, 2007.
Elsebaie, I.H. “Rainfall Intensity-Duration-Frequency Relationship for some Regions in Saudi Arabia " International Journal of
Sustainable Water and Environmental Systems (IASKS), ISSN: 1923-7537, Vol. 2 Issue: 01, pp. 7-16, 2011.
S.A. AlHassoun "Developing an empirical formulae to estimate rainfall intensity in Riyadh region”, Journal of King Saud
University-Engineering Sciences (2011).
||Issn 2250-3005 ||
October||2013 ||
2013
Page 65